Producers make several important marketing and risk management decisions throughout the year. One of the most important decisions is the choice of coverage levels when purchasing crop insurance. Revenue Protection (RP) – by far the most popular plan of insurance – provides an indemnity if realized revenue (combination of yield and price) drops below the guarantee (or a percent of expected revenue) for the insured unit. RP coverage levels range from 50% to 85% of expected revenue, increasing in 5% increments. Producers must weigh the choice of varying RP coverage levels against the changes in premium costs. Premium costs vary and consider factors such as the risk of loss for the insured crop in the specific county, coverage level, insurance product purchased, and production practices. This article examines the weighted average coverage level (WACL) by county and crop from 2011-2022 for corn, cotton, soybean, wheat, and peanut RP insurance plans. RP insurance plans from 2011 to 2022 covered 88% of all insured acres for corn, cotton, peanuts, soybeans, and wheat (USDA Summary of Business). The WACL is calculated as RP coverage level multiplied by acres insured for the coverage level divided by total RP acres insured for each county crop and year.
Corn
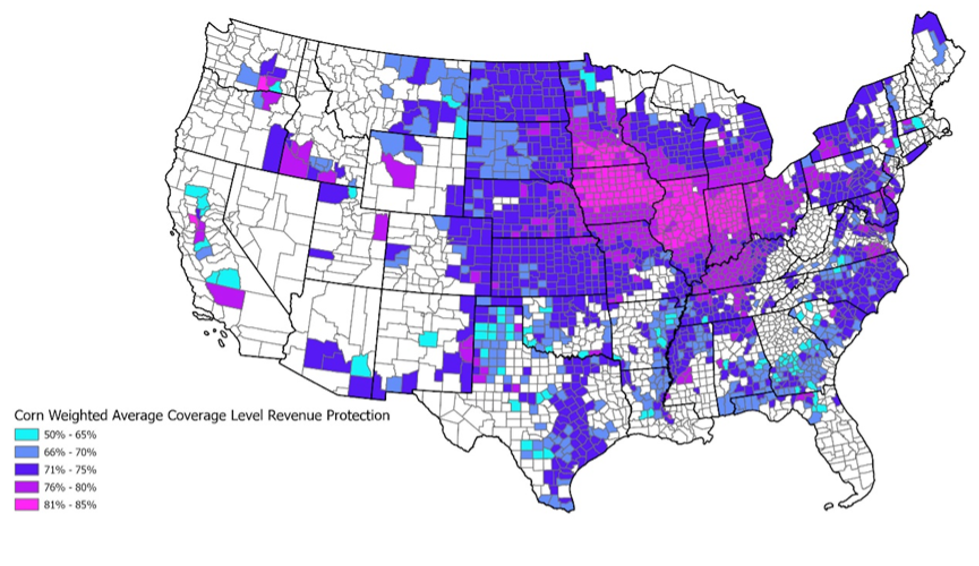
The Corn Belt states of Indiana, Illinois, and Iowa show most counties have a WACL of 81% to 85%, indicating higher insurance coverage purchases. Most counties in North Dakota, South Dakota, Nebraska, and Kansas exhibit a WACL of 71% or greater. However, there is more variability in the southern and eastern states, with coverage levels generally lower than in the Midwest.
Figure 1. Corn Acre-Weighted Average Coverage Level Revenue Protection 2011-2022
Cotton
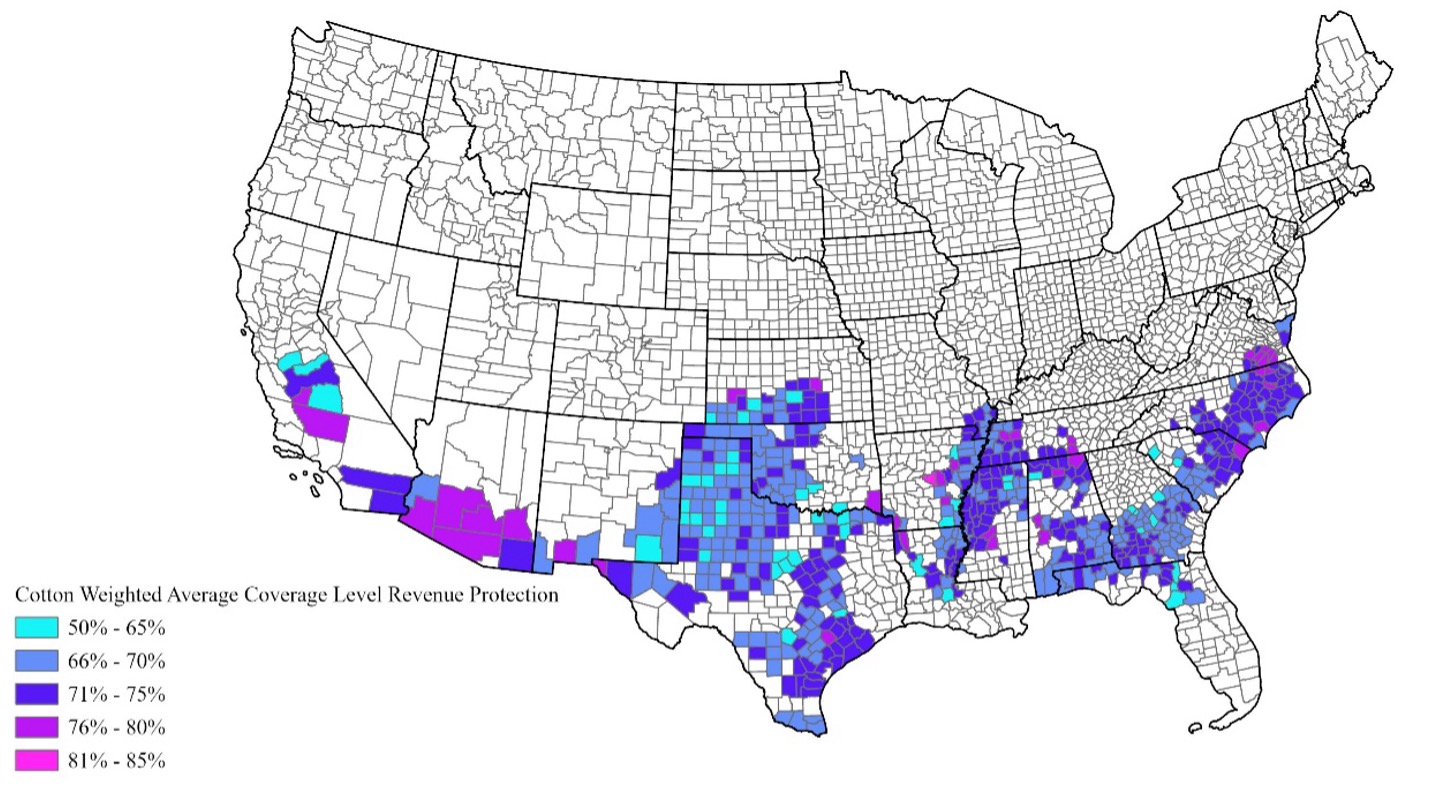
Southern Arizona has a concentration of 76% to 80% WACLs for cotton, while the majority of Western Oklahoma and Texas counties have a WACL for cotton of 66%-70%. The rest of the south’s cotton production is concentrated along the Mississippi River, the east coast, South Georgia, and South Alabama with a 71-75% WACL being the most prominent coverage level. Nationally, there are very few counties with a WACL above 80% for cotton.
Figure 2. Upland Cotton Acre-Weighted Average Coverage Level Revenue Protection 2011-2022
Peanuts
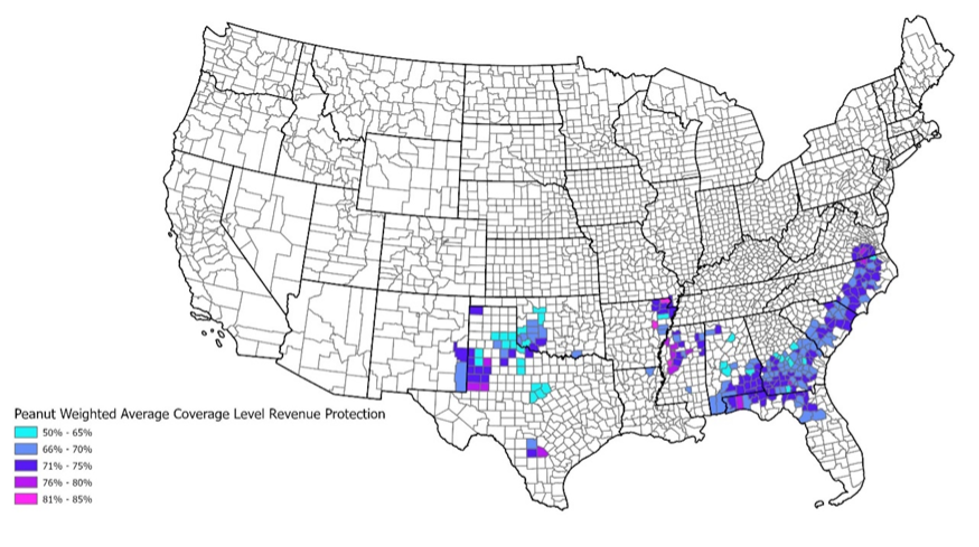
The southern regions of Alabama, Georgia, and the eastern Carolinas show a WACL between 66% and 75%. About half of the counties in Northeast Arkansas and Northwest Mississippi have a WACL of 76% or higher. The counties along the border of Western Oklahoma and Texas have lower WACLs, while those along the border of West Texas and Eastern New Mexico mainly have WACLs of 71% or higher. Like cotton, peanuts have few counties with WACLs that exceed 80% – fewer than twenty counties have WACLs greater than 76%.
Figure 3. Peanuts Acre-Weighted Average Coverage Level Revenue Protection 2011-2022
Soybeans
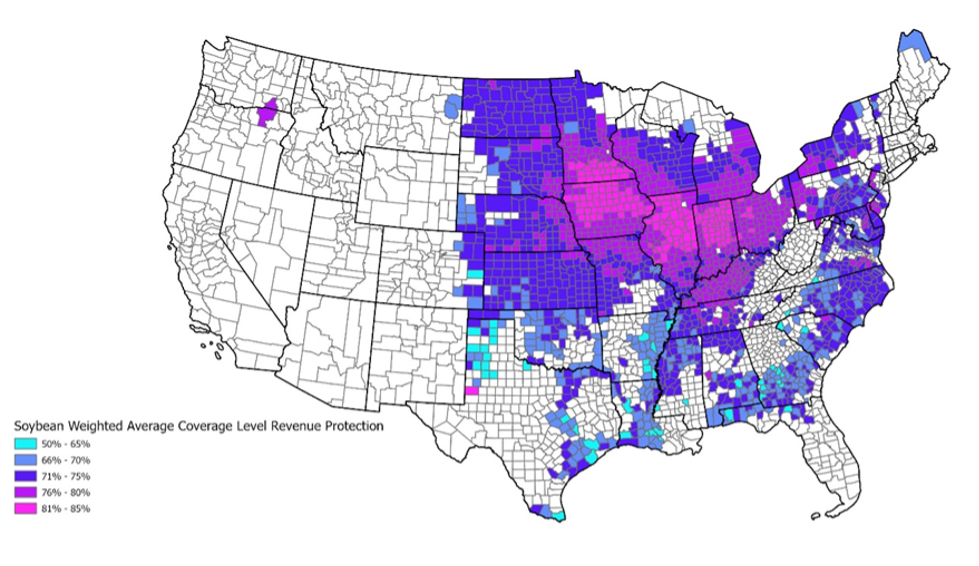
Trends for soybeans mirror those for corn, with counties in Ohio, Indiana, Illinois, Iowa, and Kentucky showing WACLs of 76% or higher, with many reaching 81% or higher. From North Dakota to Kansas, counties have WACLs of 71% or better. In the southern states, the WACL varies significantly.
Figure 4. Soybeans Acre-Weighted Average Coverage Level Revenue Protection 2011-2022
Wheat
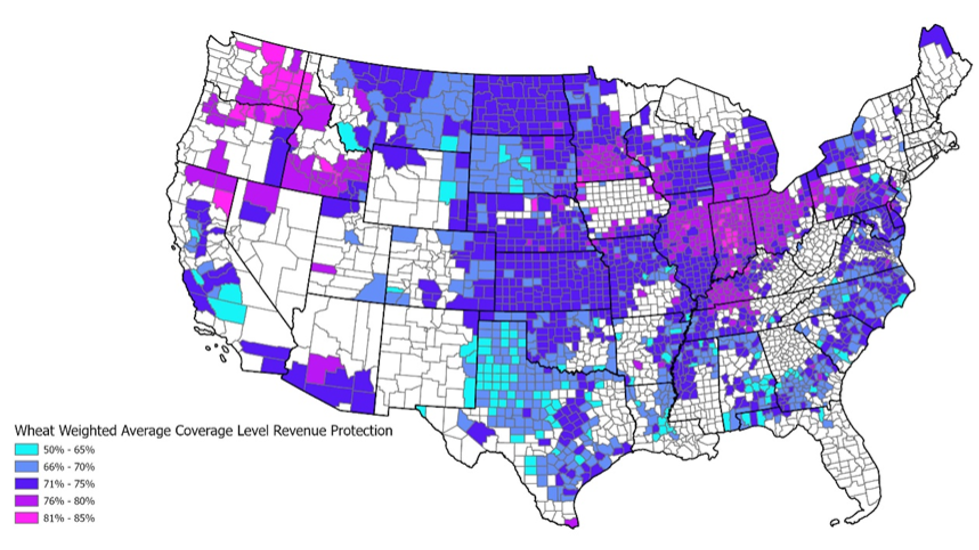
Northwestern states and parts of the Midwest exhibit WACLs of 76% or greater. In Texas, many counties show lower WACLs, ranging from 50% to 70%. Wheat production varies by season (spring or winter) and type (hard, soft, and durum). Wheat production in the northwestern states is typically soft spring wheat, whereas Texas wheat is mostly hard red winter wheat that produces lower yields than soft wheat.
Figure 5. Wheat Acre-Weighted Average Coverage Level Revenue Protection 2011-2022
Since the early 1990s, buyup coverage levels for crop insurance have trended higher (Smith, 2015). From 2011 to 2022, across commodities there is greater variability in WACLs in the South than the Midwest and Northern Plains. Variability in WACLs by crop and region highlights differences in risk levels, risk preferences, insurance premiums, and production costs. Regions with higher WACLs often have more consistent yields; regions with lower WACLs typically face higher premium costs due to greater production variability. Understanding trade-offs in risk and premium cost can help producers determine the correct RP insurance coverage level to meet their specific risk management needs.
References and Resources:
Biram, H.D. 2024. The Fundamentals of Federal Crop Insurance, University of Arkansas. Link
Smith, S.A., J. Outlaw, and R. Tufts. 2015. Surviving the Farm Economy Downturn. Chapter 10. Crop Insurance: Basic Producer Considerations. https://afpc.tamu.edu/extension/resources/downturn-book/.
USDA Risk Management Agency. Summary of Business. https://www.rma.usda.gov/SummaryOfBusiness
Duncan, Hence, and Aaron Smith. “Revenue Protection Weighted Average Coverage Levels by County and Crop.” Southern Ag Today 4(28.1). July 8, 2024. Permalink

Leave a Reply