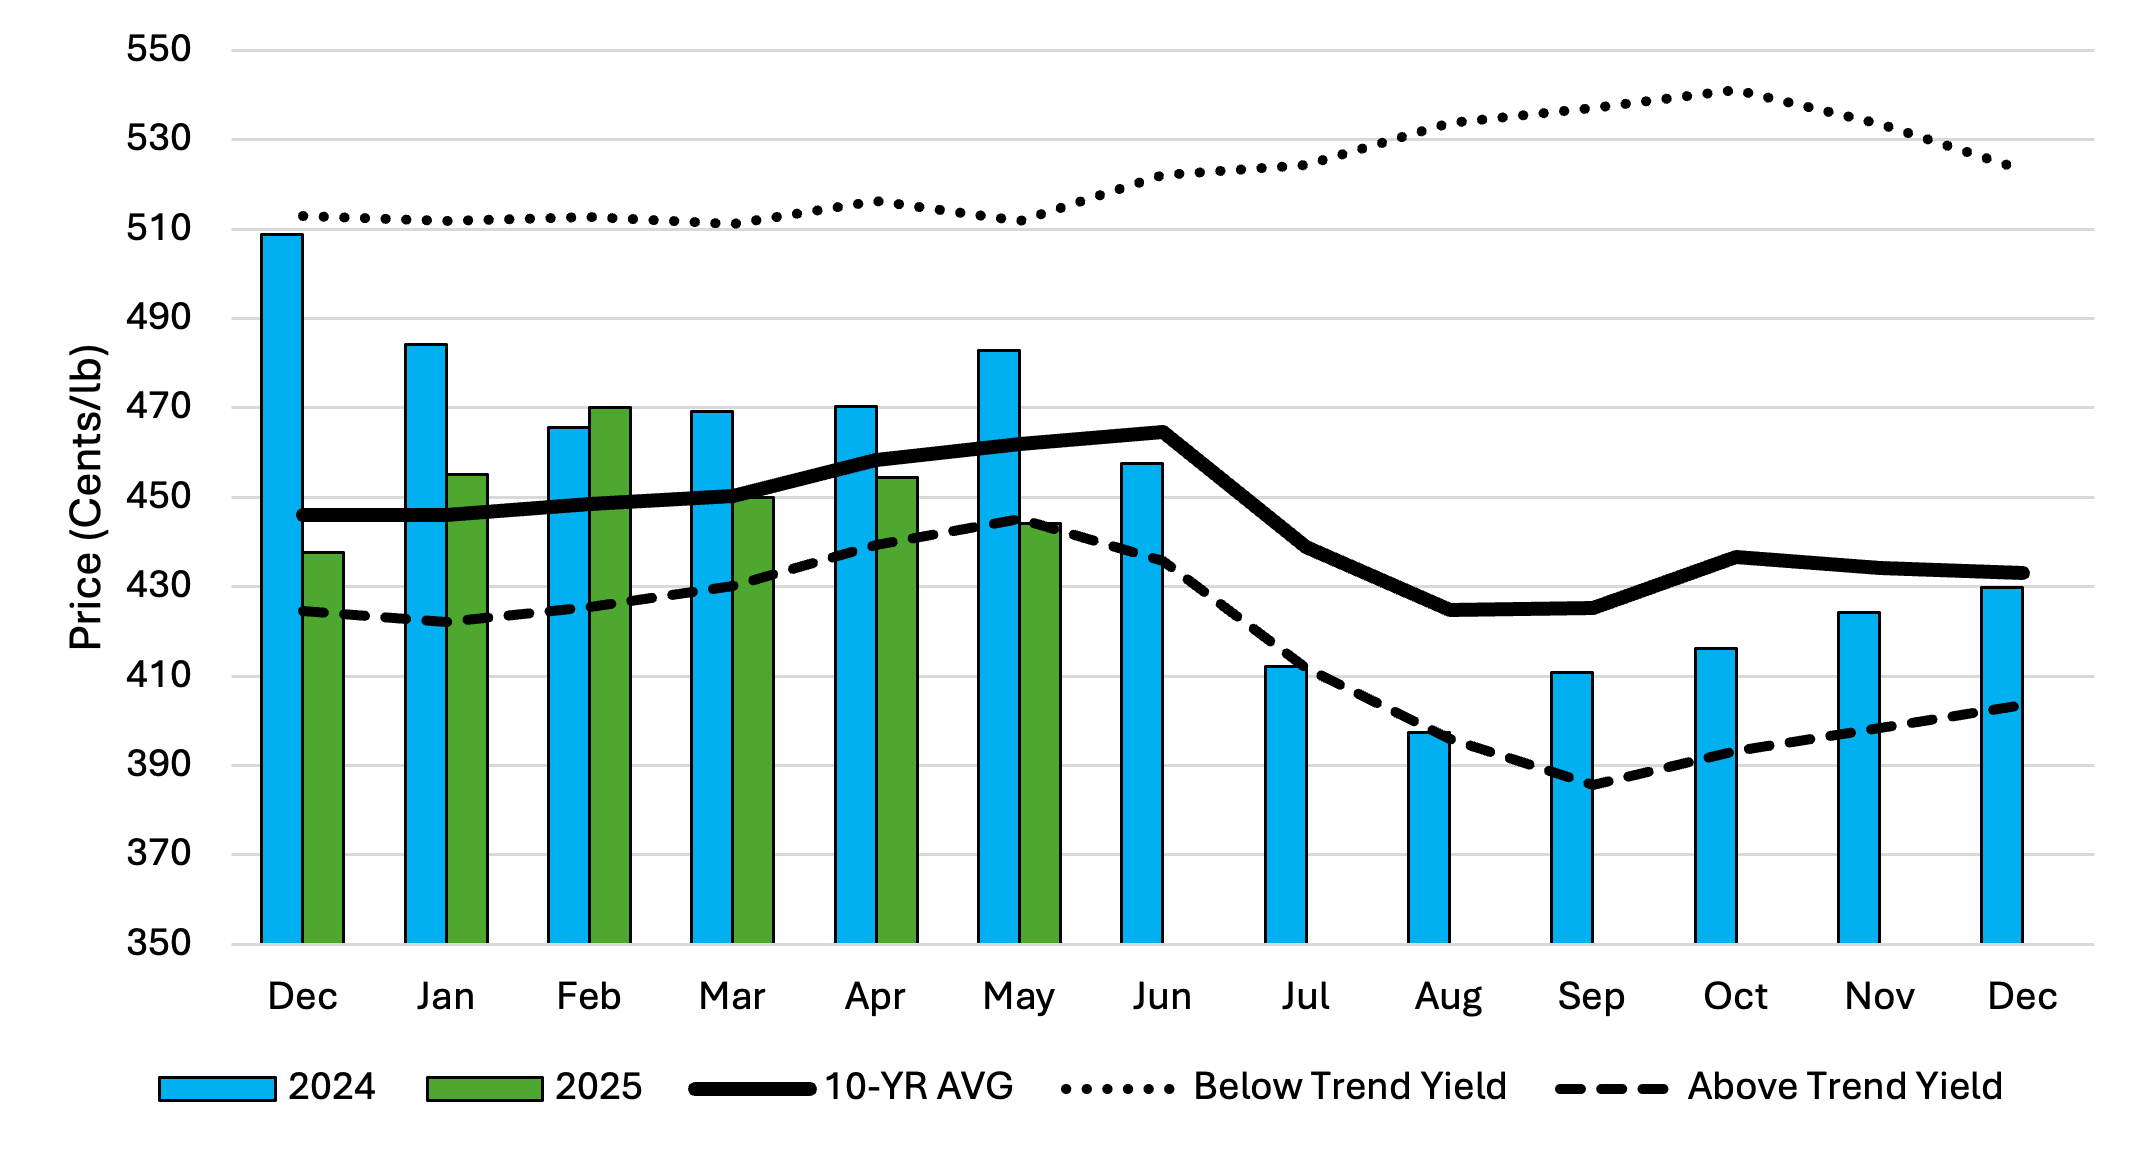
Over the past 10 years the monthly average December corn futures contract price has peaked in June and declined through harvest (Figure 1). However, prices react differently each year. This article examines the December corn futures contract monthly average price from 2010 to 2024, for years when national average corn yield is above the predicted trendline (2014, 2015, 2016, 2017, 2018, 2021, and 2024) and below the predicted trendline (2010, 2011, 2012, 2013, 2019, 2020, 2022, and 2023). In years when the national average yield is above the trendline, the monthly average December corn futures price peaks in May and declines to September, before recovering at the end of the year. This trend can also be seen in 2024 (blue bars; Figure 1). In years when the national average yield was lower than trendline, average monthly December futures prices increased from May to October. May and June have historically been the months when December futures prices begin to move higher or lower. This is largely due to three factors: 1) confirmation of planted acreage (USDA June Planted Acreage report); 2) early season weather and crop conditions; and 3) increased accuracy for June-July yield forecasts.
Figure 1. Average Monthly December Corn Futures Price, 2024, 2025, 10-Year Average, Below Trendline and Above Trendline National Average Yield

Currently, 2025 USDA estimates for national corn acres planted are at 95.3 million acres (March Prospective Plantings report). The USDA will release the Acreage report on June 30th which will provide revised estimates. Due to beneficial planting conditions throughout a large portion of corn producing regions of the U.S. and a corn-to-soybean ratio that favors corn planting, many analysts are anticipating an increase in corn acres compared to current USDA estimates.
Weather has also been mostly favorable across the corn belt. On May 27th, the USDA estimated that 5% of corn production was in severe drought or worse, indicating most of the major production areas had average to favorable soil moisture conditions. This can change rapidly and in the recent past many states have experienced flash droughts that have reduced state level yield estimates later in the growing season. The May 31st 30-day NOAA precipitation forecast indicates average to above average precipitation for the corn belt, the Mississippi river portal and the southern seaboard.
Farmers concerned with downside futures price risk could consider purchasing a December put option at or out of the money to provide short term price protection. If futures prices move lower the put would provide a futures price floor. If futures prices start to trend higher, the put option could be sold and part of the put option premium recovered. Managing the downside futures price risk at key times in the production year can assist in removing risk and protecting against financial losses.
References and Resources:
Barchart.com. December Corn Futures Price. https://www.barchart.com/futures/quotes/ZCZ25/overview.
NOAA Climate Prediction Center. 30-Day Forecast. https://www.cpc.ncep.noaa.gov/products/predictions/30day/.
USDA Ag in Drought. https://www.usda.gov/sites/default/files/documents/AgInDrought.pdf.
USDA Prospective Planting Report. https://usda.library.cornell.edu/concern/publications/x633f100h.
Smith, Aaron. “Seasonal Movements of the Monthly December Corn Futures Price.” Southern Ag Today 5(23.3). June 4, 2025. Permalink

Leave a Reply