
For its first official production estimates of the new crop year, published in the May World Agricultural Supply and Demand Estimates (WASDE), USDA relies on the planted acreage number from the Prospective Plantingssurvey conducted in late February to mid-March and reported at the end of March. Compared to those March survey numbers, the annual Acreage and quarterly Grain Stocks reports released by USDA at the end of June can change those numbers significantly, thus having the potential to be a major market mover.
In the May WASDE (and carried forward unchanged in the June WASDE), USDA estimated 95.3 million acres of corn for 2025 (Table 1) and harvested acres of 87.4 million (91.7% harvest rate). That compares to 90.6 million acres planted in 2024 and 82.9 million harvested (91.5% harvest rate). The average guess by traders ahead of the June Acreage report was 95.2 million corn acres planted. The Acreage report also showed U.S. farmers planted 95.2 million acres of corn for 2025, 100,000 acres below the March survey, but right on the average trade guess.
Also revised in the Acreage report was estimated acres harvested for corn. While acres planted were down only 100,000 from previous estimates, acres harvested were down 600,000. The harvested percentage dropped from 91.7% to 91.1%.
Plugging those numbers into the supply and demand balance sheet from the June WASDE, and leaving all other supply and demand factors unchanged, these new acreage numbers lower corn production for 2025 (and ending stocks) by 114 million bushels (Table 2). With use held steady and a reduction in ending stocks, days of use on hand at the end of the marketing year (a representation of the stocks-to-use ratio) decreases from a 41.3-day supply in the June WASDE down to a relatively tight 38.6-day supply.
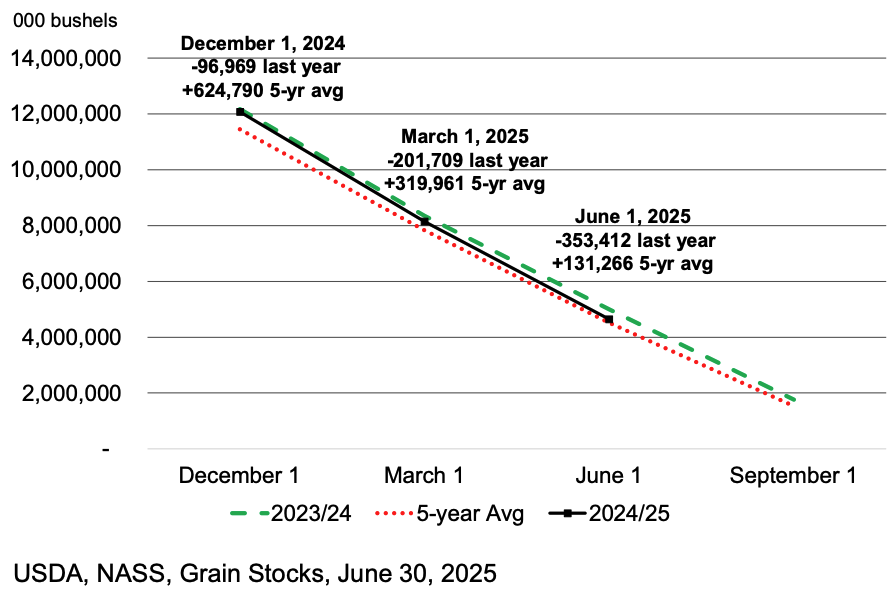
June 1 Grain Stocks were estimated at 4.64 billion bushels of corn, 1.01 billion bushels of soybeans, and 851 million bushels of wheat. Corn stocks are down compared to a year ago while soybeans and wheat stocks are higher. Corn disappearance in the period from December 1 to June 1 was a record 7.432 billion bushels, as depicted in Figure 1 as the difference from the December 1 stock to the June 1 stock. Last year, use in that period was 7.174 billion bushels compared to the five-year average 6.937 billion bushels.
Other items in the June USDA reports focused on Soybeans and Wheat. Soybeans came in at 83.4 million acres planted, 100,000 below the March Prospective Plantings and 200,000 below average trader expectations. Soybean acres harvested were revised from 82.7 million to 82.5 million, a 200,000-acre decrease. All wheat at 45.5 million acres was up 100,000 compared to Prospective Plantings and trader expectations. All wheat harvested acres were revised downward by 600,000 acres from 37.2 million to 36.6 million.
Given the numbers reported by USDA in the 2025 Acreage report, production estimates for U.S. corn, soybeans, and wheat will likely be revised lower on fewer harvested acres. However, the Grain Stocks report shows a small decrease in corn carryover and increased carryover of soybeans and wheat relative to trade expectations, implying forthcoming changes in old crop use estimates. Adding old crop ending stock adjustments to new crop production estimates, it looks like the new crop supply numbers got a little tighter for corn and wheat, and a small increase for soybeans.
Table 1. Planted Acreage and Grain Stocks from USDA and Industry Reports
| June 30th Acreage and Grain Stocks | |||||
| 2025 Planted Acres (millions) | |||||
| Planted | Average from Experts | Range from Experts | March Intentions | 2024 | |
| Corn | 95.2 | 95.2 | 93.8-96.0 | 95.3 | 90.6 |
| Soybeans | 83.4 | 83.6 | 83.0-85.0 | 83.5 | 87.1 |
| All Wheat | 45.5 | 45.4 | 45.0-46.0 | 45.4 | 46.1 |
| Winter Wheat | 33.3 | 33.3 | 33.0-33.4 | 33.3 | 33.4 |
| Spring Wheat | 10.0 | 10.1 | 9.8-10.2 | 10.0 | 10.6 |
| Durum | 2.1 | 2.0 | 2.0-2.1 | 2.0 | 2.1 |
| June 1st Grain Stocks (million bushels) | |||||
| June 1, 2025 | Average From Experts | Range from Experts | Mar 1, 2025 | Jun 1, 2024 | |
| Corn | 4,644 | 4,648 | 4,459-4,955 | 8,151 | 4,997 |
| Soybeans | 1,008 | 971 | 936-1,020 | 1,910 | 970 |
| Wheat | 851 | 835 | 805-852 | 1,237 | 696 |
| Source: USDA and DTN | |||||
Table 2. U.S. Corn Supply and Demand Balance Sheet
| U.S. Corn | 2024/25 | June WASDE2025/26 | June Acreage2025/26 |
| Planted Acreage (Mil. Acs.) | 90.6 | 95.3 | 95.2 |
| Harvested Acreage (Mil. Acs.) | 82.9 | 87.4 | 86.8 |
| Yield (Bushels) | 179.3* | 181.0* | 181.0* |
| Supply —Million Bushels— | |||
| Beginning Stocks | 1,763 | 1,365 | 1,365 |
| Production | 14,867 | 15,820* | 15,706* |
| Imports | 25 | 25 | 25 |
| Total Supply | 16,655 | 17,210* | 17,096* |
| Disappearance | |||
| Domestic Use | 12,640 | 12,785* | 12,785* |
| Exports | 2,650 | 2,675 | 2,675 |
| Total Use | 15,290* | 15,460* | 15,460* |
| Ending Stocks | 1,365 | 1,750 | 1,636 |
| Carryover/Use (days on hand) | 32.6 | 41.3 | 38.6 |
| Average Farm Price ($/Bu.) | 4.35 | 4.20 | 4.20 |
| *Record High | |||
| Source: USDA World Agricultural Supply and demand Estimates and Acreage 2025 | |||
Figure 1. U.S. Corn Stocks, All Positions
References:
DTN/Progressive Farmer. “USDA Reports Preview”, June 26, 2025 https://www.dtnpf.com/agriculture/web/ag/news/article/2025/06/26/acreage-stocks-reports-set-tone-us.
USDA, NASS. Acreage, https://usda.library.cornell.edu/concern/publications/j098zb09z.
USDA, NASS. Grain Stocks, https://usda.library.cornell.edu/concern/publications/xg94hp534.
USDA, Office of the Chief Economist. World Agricultural Supply and Demand Estimates (WASDE), https://www.usda.gov/about-usda/general-information/staff-offices/office-chief-economist/commodity-markets/wasde-report.
Leave a Reply