
The U.S. sorghum market enters 2025/26 with a bigger crop, weaker domestic demand, and uncertain access to China. The U.S. Department of Agriculture projects U.S. sorghum production at 9.94 million metric tons (MMT), up nearly 14% from last year. At home, demand is wilting, with domestic use set to fall by almost a quarter. The market hinges on foreign demand, especially from China.
China’s use is expected to jump nearly 50% in 2025/26 to over 11 MMT, and imports may approach 8 MMT (USDA-ERS, 2025). On a 2019-2023 quantity average, about 72% of China’s sorghum imports came from the United States (FAO, 2025). Yet, the U.S. export rebound is far from assured. In early 2025, following the U.S.-China trade dispute, Beijing imposed duties on U.S. sorghum and suspended firms on quality grounds. Shipments to China fell more than 95% in the first half of the year (Table 1).
Australia and Argentina moved quickly to fill part of the gap, sending sorghum—including some cleared for baijiu (a Chinese liquor made from fermented sorghum)—into South China ports. For farmers across Texas and the Southern Plains, the result has been a fragile Gulf basis, highly sensitive to whether Chinese demand resumes or alternative buyers step in. Mexico remains steady; Spain is emerging (Table 1); and Vietnam is showing interest. But no one matches Beijing’s scale.
The season-average farm price is forecasted to be near $3.70/bu., with sorghum trading at a discount to corn. A strong Chinese pull narrows the corn-sorghum spread; policy frictions widen it. In the near term, the U.S. has grain but not guaranteed access.
Producers can hedge sorghum against corn futures, closely monitor export flows, and scale sales when rallies appear due to demand from China or Mexico. For now, USDA is projecting U.S. sorghum exports to China to more than double to 5.72 MMT in 2025/26 (Figure 1). Ultimately, sorghum’s fate rests less in fields than in the outcomes of geopolitics.
Figure 1 – U.S. Sorghum Supply, Use, and Ending Stocks.
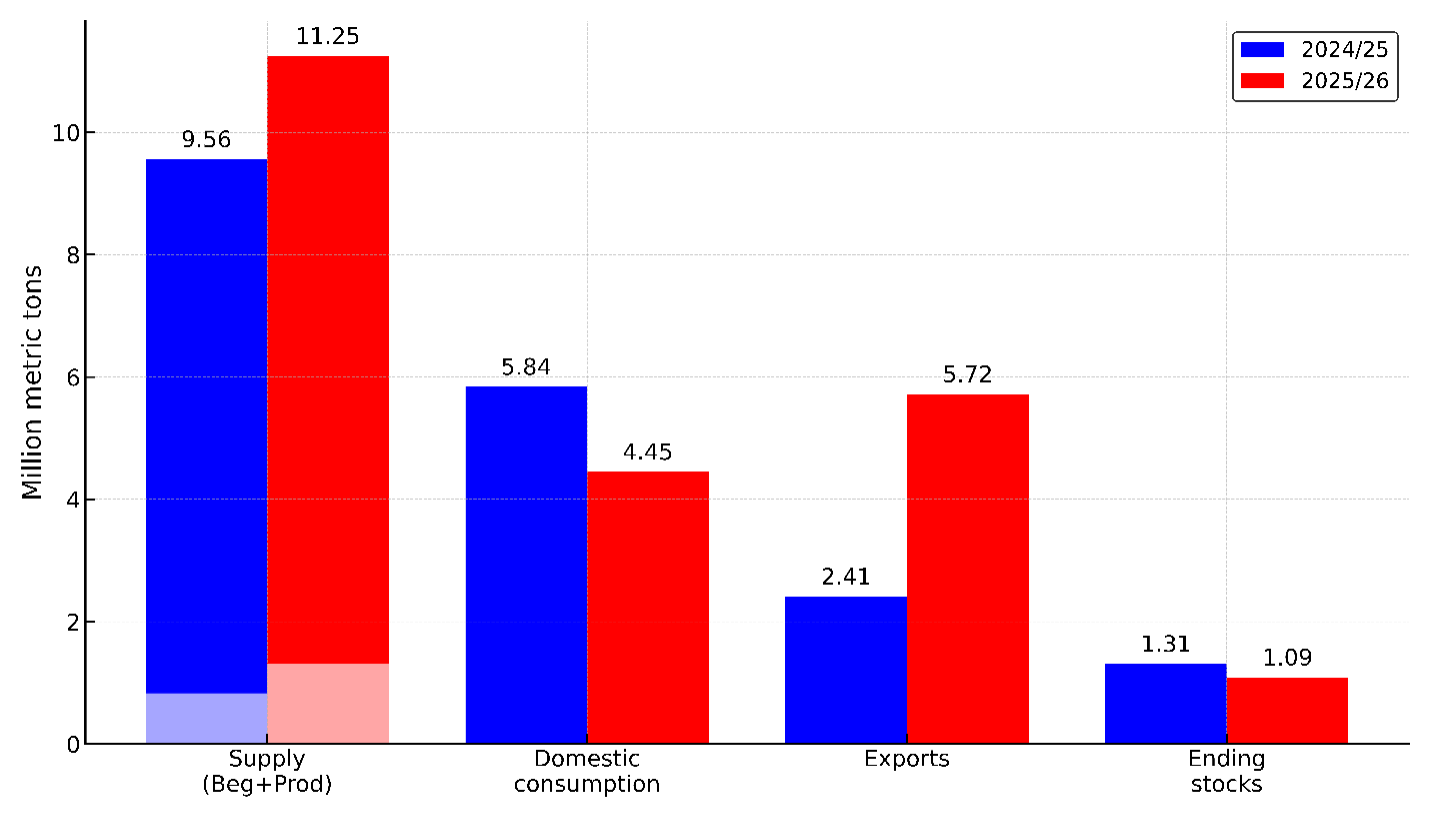
Source: USDA-ERS (2025).
Table 1 – U.S. Sorghum Export Shipments by Destination (metric tons
| Country | 2024 | 2025 | ||||
| Qtr1 | Qtr2 | Qtr3 | Qtr1 | Qtr2 | Qtr3 | |
| China | 1,944,822 | 1,156,280 | 1,018,670 | 83,291 | 3,117 | |
| Colombia | 53 | |||||
| Eritrea | 32,551 | 33,000 | 33,000 | |||
| Haiti | 239 | |||||
| Japan | 80 | 9,061 | 40 | 60 | 36,203 | 9,471 |
| Mexico | 493 | 23,724 | 202,791 | 117,619 | ||
| Spain | 51,932 | 110,342 | 33,967 | |||
| Taiwan | 2,000 | |||||
| United Kingdom | 22 | |||||
| Total | 1,977,946 | 1,198,341 | 1,051,710 | 159,268 | 354,453 | 161,110 |
Source: USDA-FAS (2025).
References
FAO (2025). FAOSTAT: Detailed trade matrix (TM) [Data set]. Retrieved September 8, 2025, from https://www.fao.org/faostat/en/#data/TM
USDA-ERS (2025) Commodity Outlook – WASDE projections at a glance. Retrieved September 2, 2025, from https://www.ers.usda.gov/topics/farm-economy/commodity-outlook/wasde-projections-at-a-glance
USDA-FAS (2025). Export sales query system. Retrieved September 2, 2025, from https://apps.fas.usda.gov/esrquery/esrq.aspx
Calil, Yuri, and Pancho Abello. “Sorghum’s Big Crop, Bigger Risks.” Southern Ag Today 5(37.3). September 10, 2025. Permalink
Leave a Reply