
This article extends the regional and industry concentration analysis of H-2A patronage trends laid out in a previous Southern Ag Today article. Given the larger shares of the Southern region and crop industries in total H-2A employment figures, we offer some wage-based explanations for these patronage trends.
H-2A employment decisions are anchored on the adverse effect wage rate (AEWR) principle, which was conceived to specifically revert any possible market anomaly when foreign workers are hired under the H-2A program. The Department of Labor (DOL) was tasked to issue a fixed wage rate (AEWR) to mitigate adverse effects on local labor market conditions that may be caused by the employment of underpaid alien workers. A current year’s AEWR is determined based on the results of the previous year’s Farm Labor Survey conducted by the U.S. Department of Agriculture (USDA) among farms with annual sales of $1,000 or more (USDA, 2023). For farm work not devoted to herding or production of livestock on the range (non-range occupations that comprise the bulk of H-2A employers),[1] AEWRs are set at the state level and enforced to apply to all workers regardless of nationality.
Figure 1 plots national average wages over a five-year period (2020-2024) for two farm work positions: farmworkers in crop, nursery, and greenhouse operations (usually accounting for more than 80% of all H-2A workers hired) and farmworkers in farms producing ranch and aquacultural products (which are positions held by about 4% of all H-2A workers). These wages are compared to the national average of state-level AEWRs. An adjusted AEWR level is added to the analysis to account for discrepancies between labor remuneration packages offered to domestic and H-2A workers. The latter not only receive wages conforming to the AEWR benchmark but are also provided with housing, transportation, meal allowances, and fringe benefits as mandated by the program. The plots in Figure 1 indicate that crop, nursery, and greenhouse workers were consistently paid higher than H-2A workers in all years, while the adjusted H-2A wages only exceeded average livestock wages in 2023 and 2024.
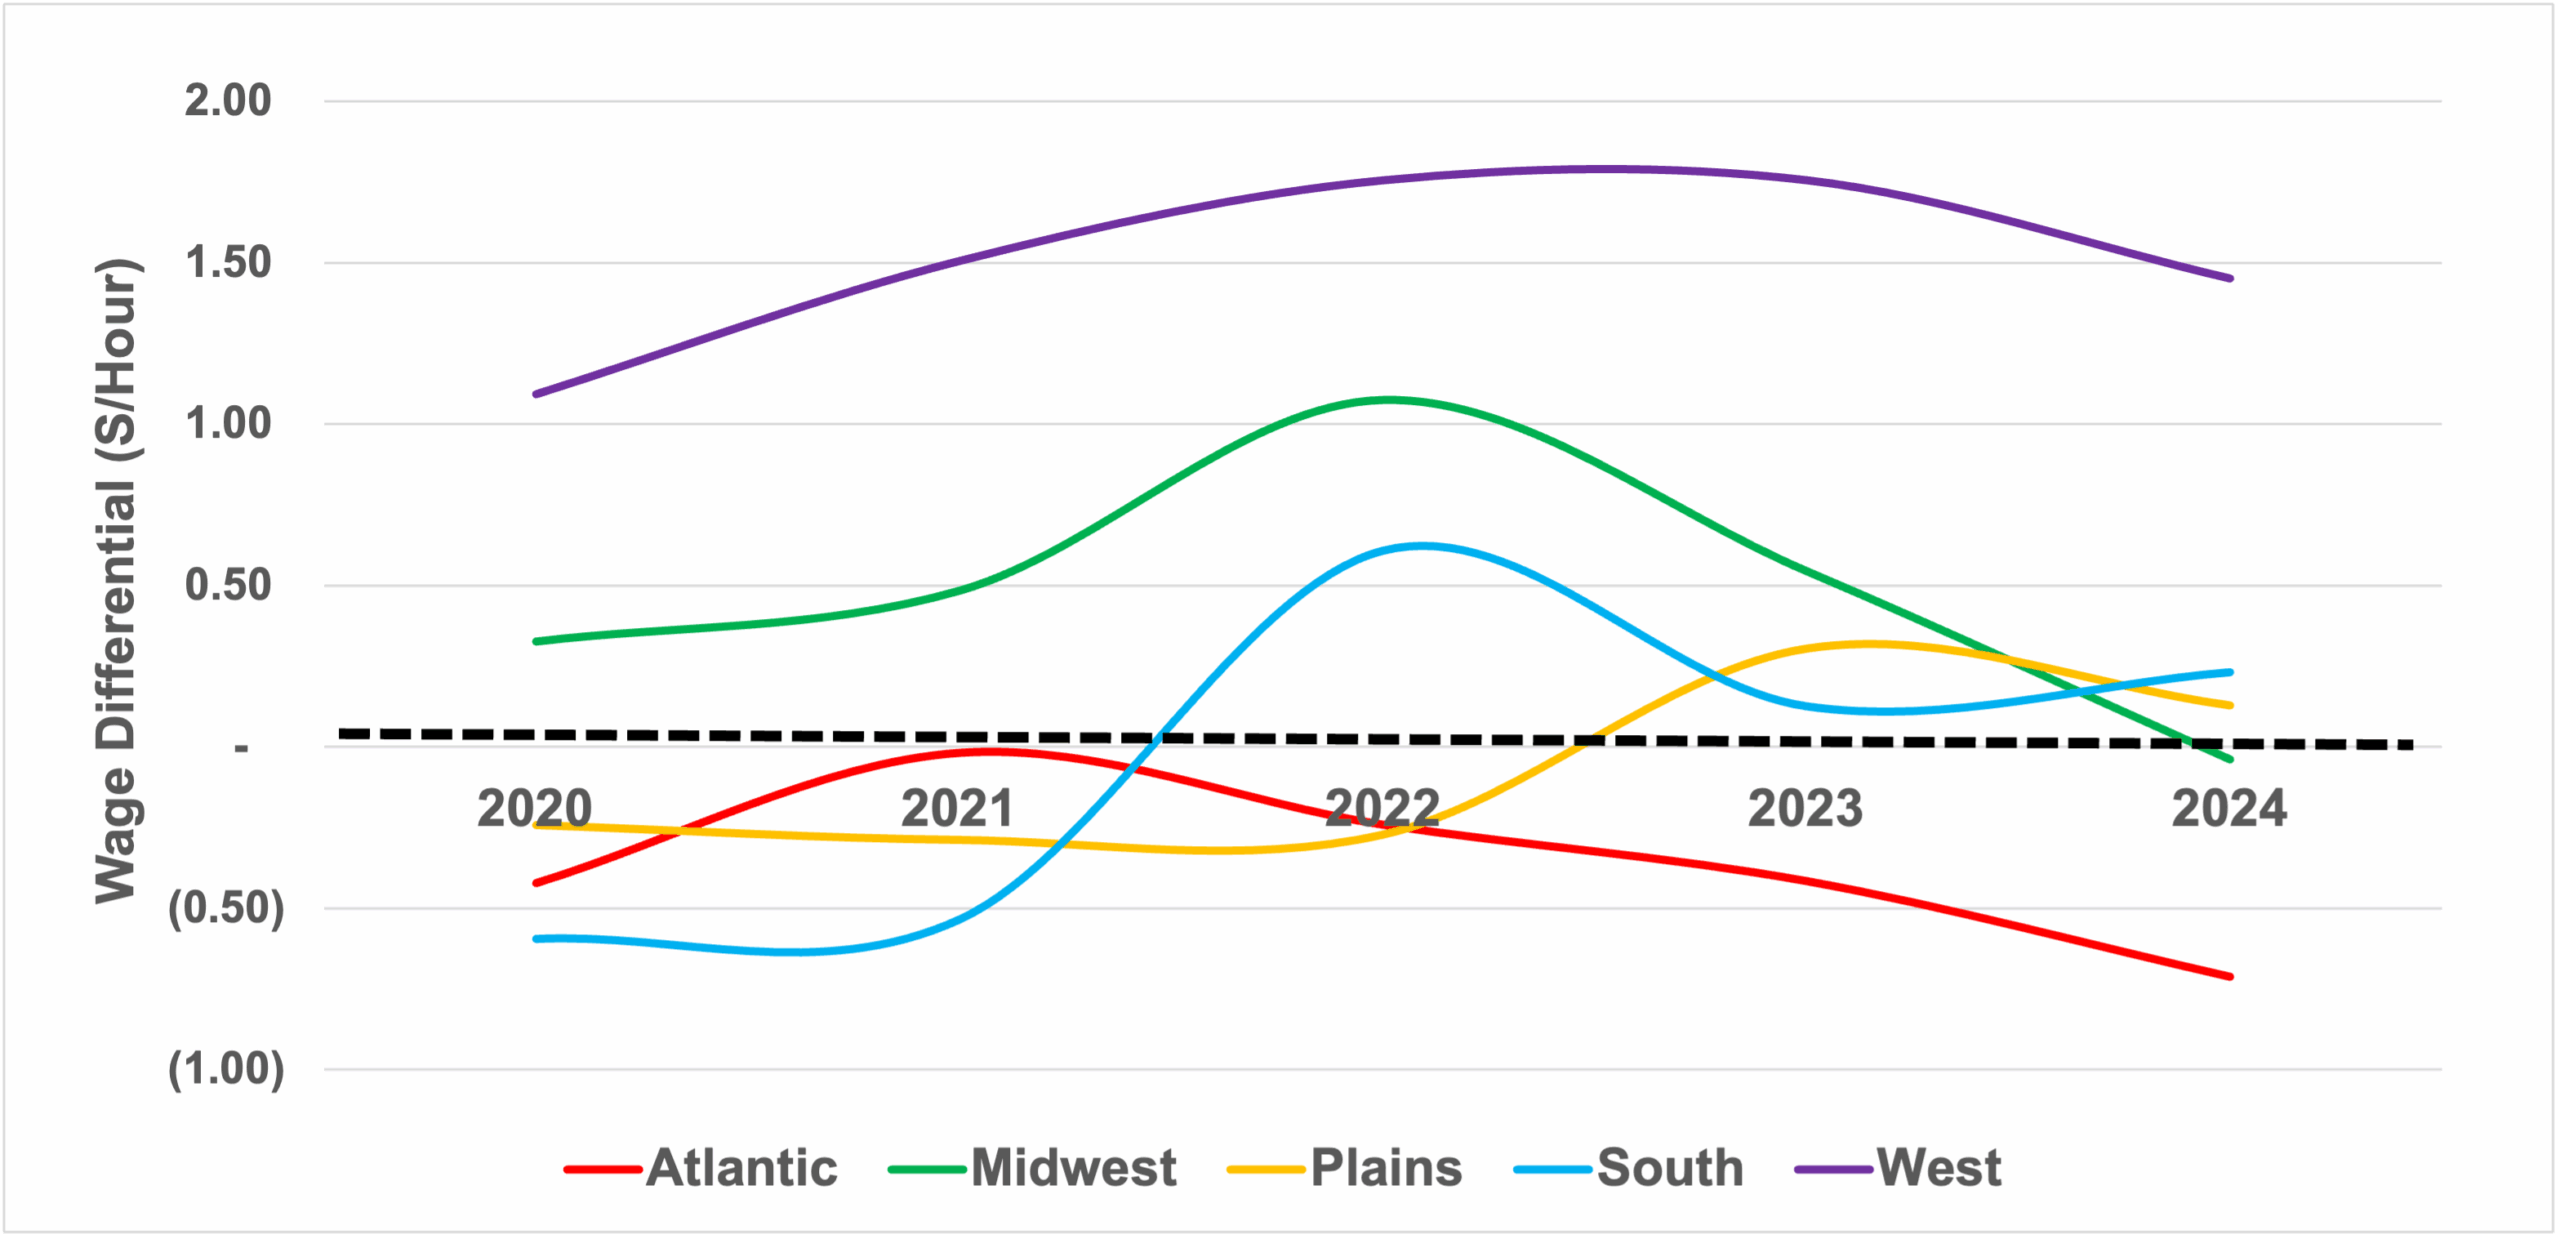
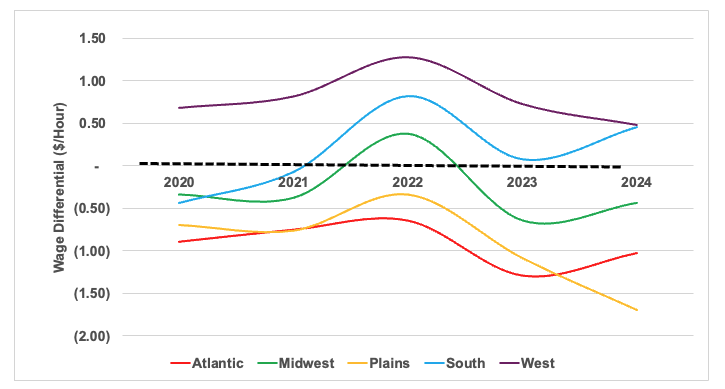
The regional wage analyses provide some deviations from the earlier trends (Figure 1), which could be influenced by regional variations in demographic, structural, and economic conditions affecting H-2A employment decisions. Figures 2 and 3 present plots of the domestic wage-AEWR differentials using regional average field and livestock wages, respectively, over the same five-year period. In these plots, a positive gap indicates a higher regional field/livestock wage than its average AEWR.
In Figure 2 (field workers’ wages), the South region’s wage differential is positive only in 2022, while remaining negative in other years. The West, which is the second most popular regional H-2A employer, has consistently maintained a positive field wage-AEWR gap in all years. These trends indicate that while the West farms’ decisions to hire H-2A workers for field work may be motivated by wage considerations (where H-2A labor is cheaper than domestic labor), the South’s decision to hire more expensive H-2A field workers in certain years could have been driven by non-wage factors. Some analysts argue that the higher labor productivity of more expensive H-2A workers rationalizes some farms’ preference for these workers.
In Figure 3, the South posted slightly negative domestic livestock wage-AEWR differentials in 2020 and 2021; it maintained a positive gap for the rest of the period. The West again maintained a positive gap during the entire period. These trends reveal some unique employment predicaments in livestock industries. Given that livestock farms in the country usually rely less on H-2A labor and would rather employ domestic residents, these decisions persist even when domestic livestock wages are higher than the adjusted AEWR. Compared to crop farms, livestock farms are more inclined to seek workers and employ them for a longer tenure as their operations have longer business and production cycles. These farms usually lure prospective workers with training offers that could upgrade their skills and job classification (from unskilled to better paying skilled positions). A follow-up article will present more detailed evidence on livestock farms’ domestic and foreign labor hiring practices.
Figure 1. Adverse Effect Wage Rates (AEWRs) and Farmworkers’ Wages in Crop and Livestock Farms, U.S. Average, 2020-2024
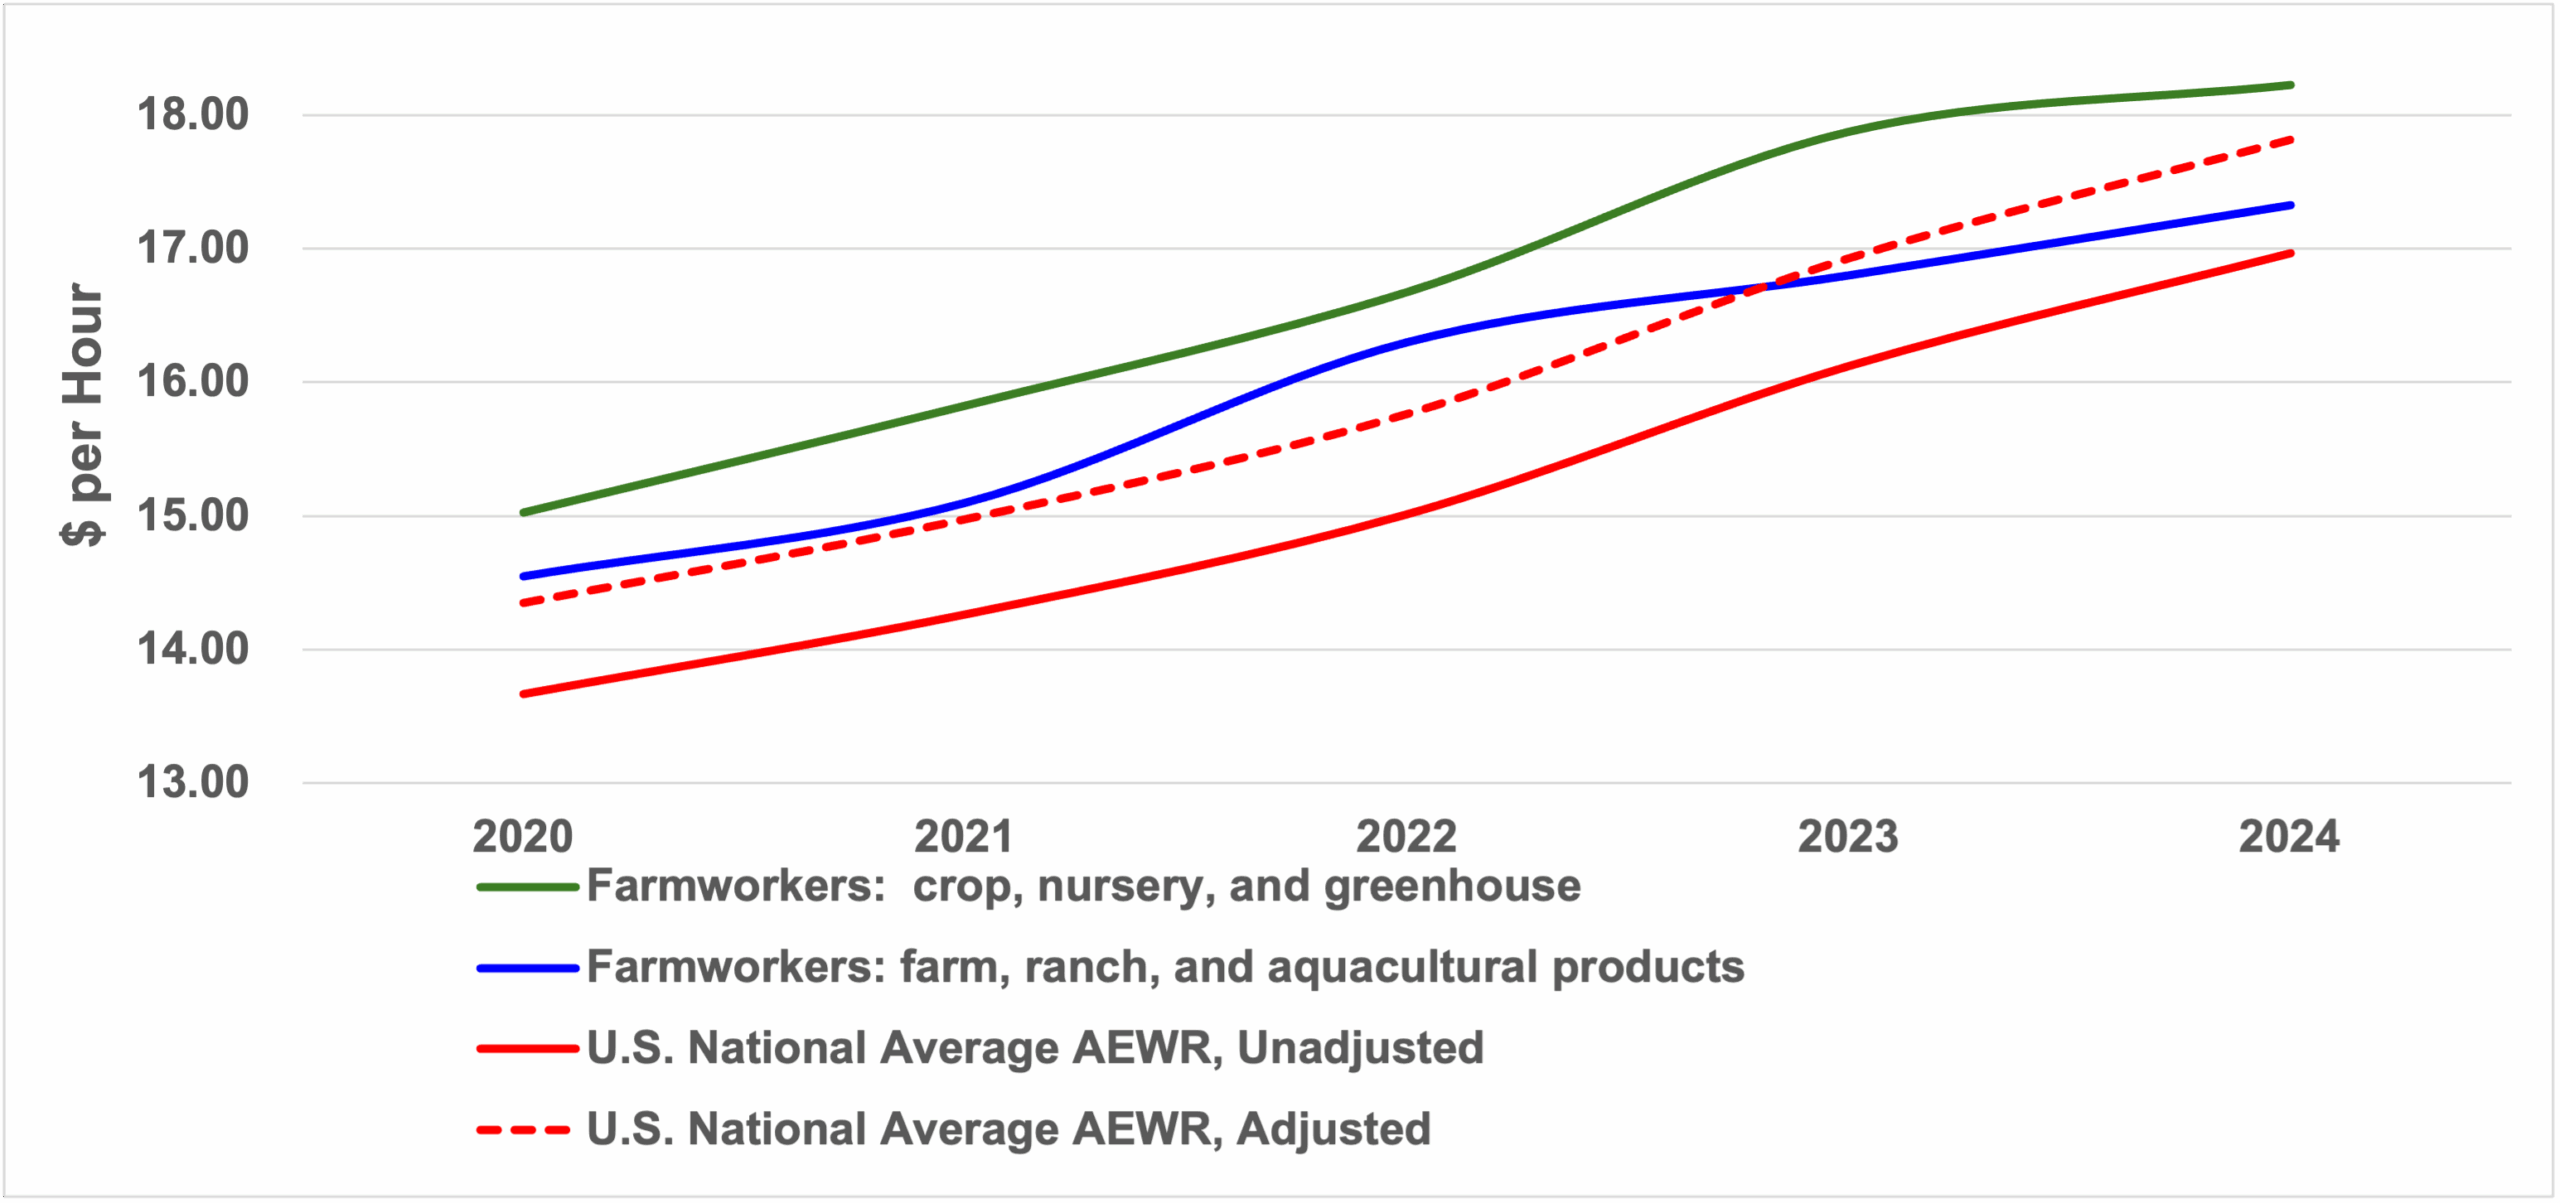
Note: Adjusted AEWRs include a 5% wage premium of AEWR over domestic wages as determined by Calvin, Martin, and Simnitt (2022). These authors estimate that when all H-2A fringe benefits are factored into the equation, these foreign workers receive a wage premium of $2.55 per hour over their domestic counterparts. However, H-2A employers are not liable to pay Social Security or Federal Unemployment Insurance taxes, thus realizing an 8% saving on payroll taxes. Such tax benefit minimizes the H-2A-domestic wage differential to just about 5 percent.
Figure 2. Gaps Between Adverse Effect Wage Rates (AEWRs) and Field Workers’ Wages, By Production Region, 2020-2024
Notes: (1) The regional classification of U.S. states are as follows: ATLANTIC states include North Carolina, Virginia, West Virginia, Maryland, Connecticut, Massachusetts, New York, Vermont, New Hampshire, Maine, New Jersey, Rhode Island, and Delaware; MIDWEST states are Minnesota, Iowa, Wisconsin, Illinois, Missouri, Indiana, Ohio, Pennsylvania, and Michigan; PLAINS states are Nebraska, Kansas, Texas, North Dakota, South Dakota, and Oklahoma; WEST states include California, Washington, Oregon, Idaho, Montana, Wyoming, Colorado, New Mexico, Arizona, Utah, Nevada, Alaska, and Hawaii; and the SOUTH states are Arkansas, Florida, Georgia, Louisiana, Mississippi, Alabama, Tennessee, South Carolina, and Kentucky.
(2) The Wage Gaps are calculated as the difference between Field Workers’ Wages and AEWR. A positive gap indicates that field workers’ wages are higher than AEWR.
Figure 3. Gaps Between Adverse Effect Wage Rates (AEWRs) and Livestock Workers’ Wages, By Production Region, 2020-2024
Notes: (1) The regional classification of U.S. states are as follows: ATLANTIC states include North Carolina, Virginia, West Virginia, Maryland, Connecticut, Massachusetts, New York, Vermont, New Hampshire, Maine, New Jersey, Rhode Island, and Delaware; MIDWEST states are Minnesota, Iowa, Wisconsin, Illinois, Missouri, Indiana, Ohio, Pennsylvania, and Michigan; PLAINS states are Nebraska, Kansas, Texas, North Dakota, South Dakota, and Oklahoma; WEST states include California, Washington, Oregon, Idaho, Montana, Wyoming, Colorado, New Mexico, Arizona, Utah, Nevada, Alaska, and Hawaii; and the SOUTH states are Arkansas, Florida, Georgia, Louisiana, Mississippi, Alabama, Tennessee, South Carolina, and Kentucky.
(2) The Wage Gaps are calculated as the difference between Livestock Workers’ Wages and AEWR. A positive gap indicates that livestock workers’ wages are higher than AEWR.’
[1] Distinctions in AEWR-setting are made between range and non-range occupations. Non-range workers are employed under jobs with the following Standard Occupational Classification (SOC) titles: graders and sorters of agricultural products; agricultural equipment operators; farmworkers and laborers in crop, nursery, and greenhouse; farmworkers in the farm, ranch, and aquacultural animals; packers and packagers (hand); and all other agricultural workers (Congressional Research Service, 2023).
References:
Calvin, L., P. Martin, and S. Simnitt. (2022). Adjusting to Higher Labor Costs in Selected U.S. Fresh Fruit and Vegetable Industries. EIB-235, Economic Research Service, U.S. Department of Agriculture, Washington, DC.
Congressional Research Service. (2023) Adverse Effect Wage Rate (AEWR) Methodology for Temporary Employment of H-2A Nonimmigrants in the United States. Washington DC. Available online at https://crsreports.congress.gov | IF12408. Accessed on August 3, 2023.
Escalante, Cesar L., and Alejandro Guitierrez-Li. “Relating Crop and Livestock H-2A Labor Decisions to AEWR and Sectoral Wage Gaps.” Southern Ag Today 5(18.1). April 28, 2025. Permalink
Leave a Reply