Author: Aaron Smith

  • Seasonal Movements of the Monthly December Corn Futures Price 

    Seasonal Movements of the Monthly December Corn Futures Price 

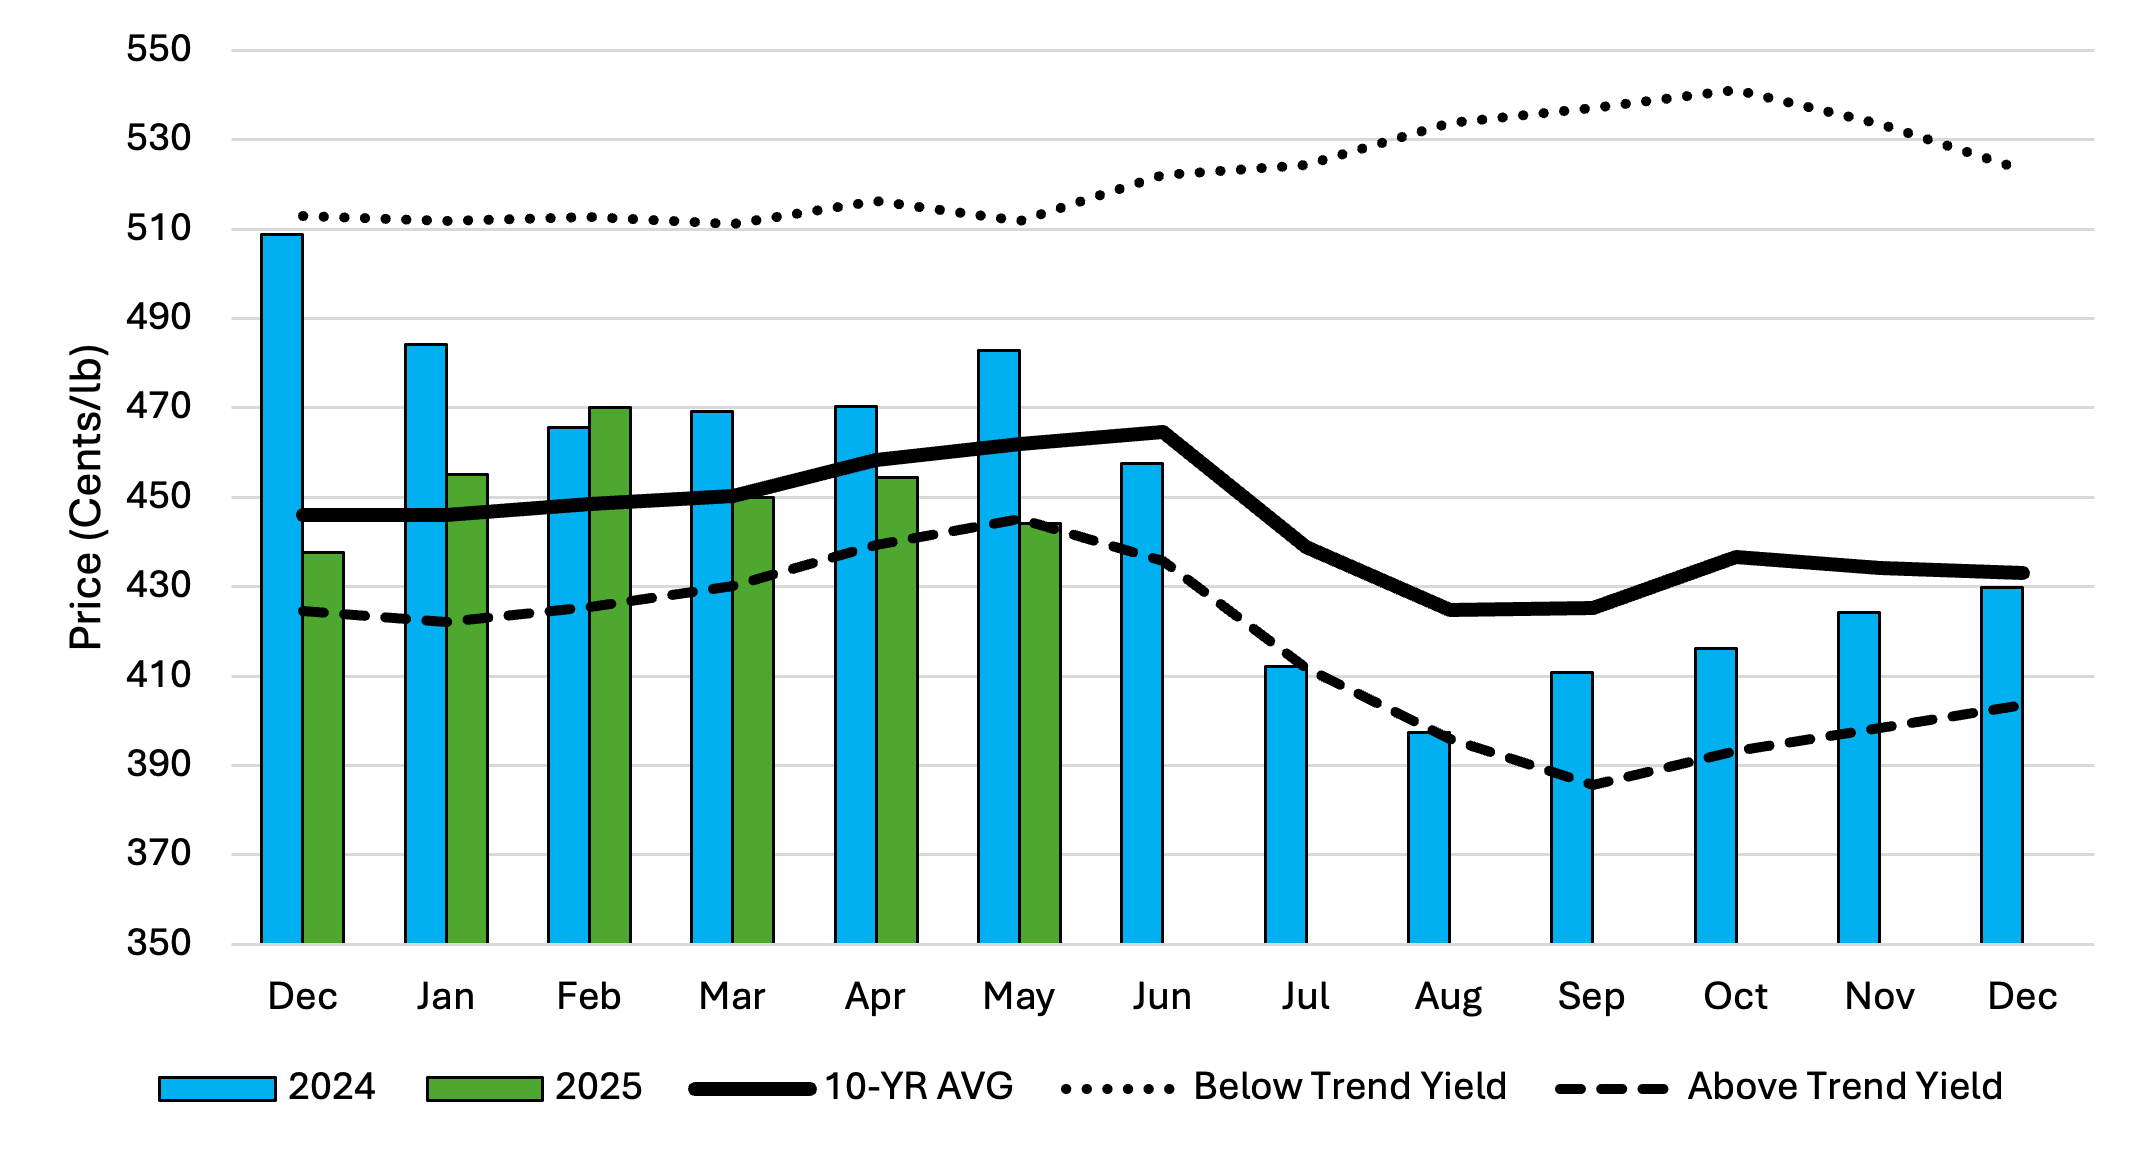
    Over the past 10 years the monthly average December corn futures contract price has peaked in June and declined through harvest (Figure 1). However, prices react differently each year. This article examines the December corn futures contract monthly average price from 2010 to 2024, for years when national average corn yield is above the predicted trendline (2014, 2015, 2016, 2017, 2018, 2021, and 2024) and below the predicted trendline (2010, 2011, 2012, 2013, 2019, 2020, 2022, and 2023). In years when the national average yield is above the trendline, the monthly average December corn futures price peaks in May and declines to September, before recovering at the end of the year. This trend can also be seen in 2024 (blue bars; Figure 1). In years when the national average yield was lower than trendline, average monthly December futures prices increased from May to October. May and June have historically been the months when December futures prices begin to move higher or lower. This is largely due to three factors: 1) confirmation of planted acreage (USDA June Planted Acreage report); 2) early season weather and crop conditions; and 3) increased accuracy for June-July yield forecasts. 

    Figure 1. Average Monthly December Corn Futures Price, 2024, 2025, 10-Year Average, Below Trendline and Above Trendline National Average Yield 

    Currently, 2025 USDA estimates for national corn acres planted are at 95.3 million acres (March Prospective Plantings report). The USDA will release the Acreage report on June 30th which will provide revised estimates. Due to beneficial planting conditions throughout a large portion of corn producing regions of the U.S. and a corn-to-soybean ratio that favors corn planting, many analysts are anticipating an increase in corn acres compared to current USDA estimates. 

    Weather has also been mostly favorable across the corn belt. On May 27th, the USDA estimated that 5% of corn production was in severe drought or worse, indicating most of the major production areas had average to favorable soil moisture conditions. This can change rapidly and in the recent past many states have experienced flash droughts that have reduced state level yield estimates later in the growing season. The May 31st 30-day NOAA precipitation forecast indicates average to above average precipitation for the corn belt, the Mississippi river portal and the southern seaboard. 

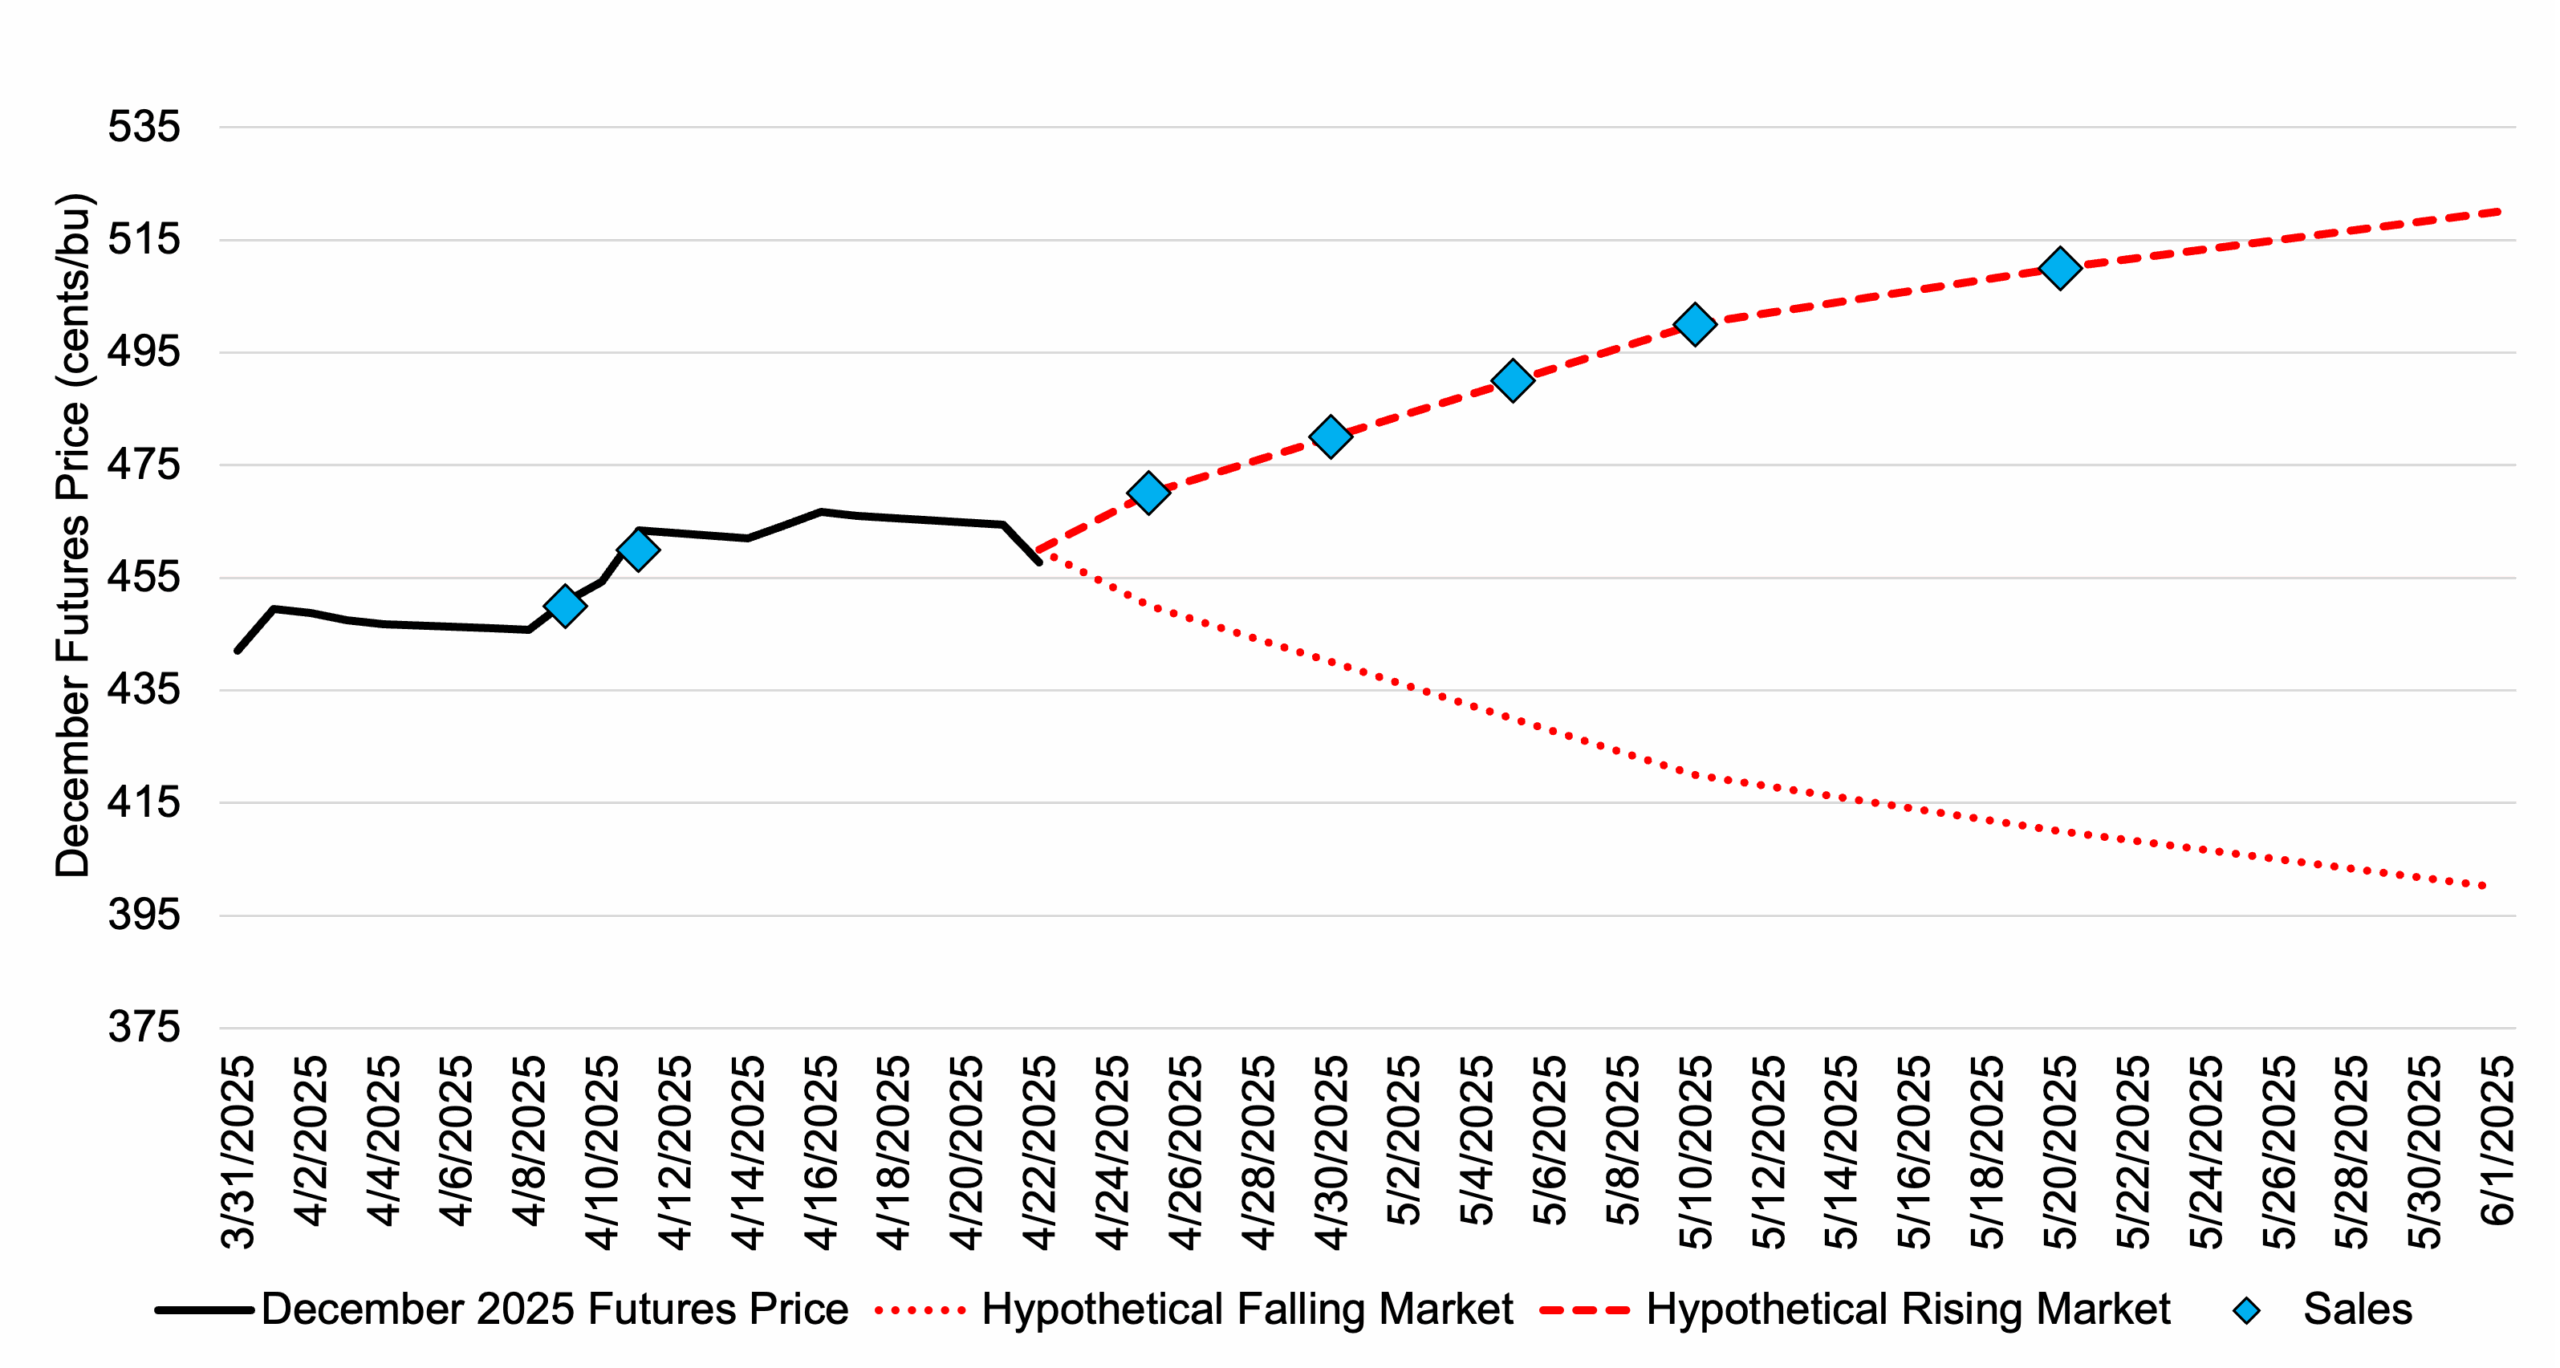
    Farmers concerned with downside futures price risk could consider purchasing a December put option at or out of the money to provide short term price protection. If futures prices move lower the put would provide a futures price floor. If futures prices start to trend higher, the put option could be sold and part of the put option premium recovered. Managing the downside futures price risk at key times in the production year can assist in removing risk and protecting against financial losses.     

    References and Resources:

    Barchart.com. December Corn Futures Price. https://www.barchart.com/futures/quotes/ZCZ25/overview.

    NOAA Climate Prediction Center. 30-Day Forecast. https://www.cpc.ncep.noaa.gov/products/predictions/30day/.

    USDA Ag in Drought. https://www.usda.gov/sites/default/files/documents/AgInDrought.pdf.

    USDA Prospective Planting Report. https://usda.library.cornell.edu/concern/publications/x633f100h.


    Smith, Aaron. “Seasonal Movements of the Monthly December Corn Futures Price.Southern Ag Today 5(23.3). June 4, 2025. Permalink

  • Incrementally Pricing Corn into a Futures Market Rally

    Incrementally Pricing Corn into a Futures Market Rally

    Tariff escalation remains a major source of uncertainty that could substantially move corn futures markets in the coming weeks/months. Managing some futures price risk based on the current rally is worth considering given the uncertainty in corn markets. On Friday April 11, December corn futures broke through a key resistance point at $4.60/bu. For those farmers that have not started pricing the 2025 crop, December corn futures above $4.50/bu represent a good starting point to remove some futures price risk (basis could be secured now or left to be fixed at an alternative date depending on local basis offerings). Pricing into a futures market rally, through incremental sales, is a strategy worth considering, and one that will take some of the emotion out of marketing decisions. For example, starting at a December futures price of $4.50/bu, consider pricing 5% of projected 2025 production. For each additional 10-cent increase in futures price, consider establishing a futures price on an additional 5% of estimated production up to a maximum of 35% of projected 2025 production. Pricing more than 35% of the crop before June can be risky and can result in exchanging price risk for production risk or having limited production to price should a bullish weather market occur in June/July/August. The maximum amount to be priced before June can be a personal preference based on the farmers’ risk tolerance, variability in yield for the farm, and access to storage.  This incremental pricing strategy would establish an average futures price of $4.80/bu on 35% of projected production if the December corn futures price rallied to $5.10/bu (Figure 1). However, it would also put some sales (10% of estimated production at an average price of $4.55/bu as of April 22) on the books if the current rally stalled or reversed. Futures prices above $4.50 plus a positive basis, which occurs in most Southern states, will result in cash prices of nearly $5.00. 

    Table 1. December Corn Futures Price and Sales into a Hypothetical Rising or Falling Market 

    References and Resources:

    Barchart.com. December Corn Futures Price. Accesses April 22, 2025. https://www.barchart.com/futures/quotes/ZCZ25/interactive-chart.


    Smith, Aaron. “Incrementally Pricing Corn into a Futures Market Rally.Southern Ag Today 5(17.3). April 23, 2025. Permalink

  • Changes in Relative Financial Risk for Corn, Cotton, and Soybeans in 2024 and 2025

    Changes in Relative Financial Risk for Corn, Cotton, and Soybeans in 2024 and 2025

    Compared to last year, pre-planting relative financial risk between corn, cotton, and soybean production has changed for many mid-south crop producers. The change in pre-planting financial risk can be illustrated using projected crop insurance prices and crop budgets for 2024 and 2025. Crop insurance prices in this analysis were determined February 1-28 and crop budgets were University of Tennessee Crop Budgets for non-irrigated production. For ease of comparison, actual production history (APH) is unchanged between years and is equal to the target yield in the crop budgets.

    Table 1 shows the difference between the crop insurance revenue guarantee for corn, cotton, and soybeans at a 75% buy-up coverage in 2024 and 2025. The crop insurance coverage per bushel or pound is the revenue guarantee divided by the APH. The crop insurance coverage level for corn increased slightly from $3.50/bu to $3.53/bu; however, coverage was reduced for cotton ($0.62/lb to $0.52/lb) and soybeans ($8.66/bu to $7.91/bu). At the same time, from 2024 and 2025, cost of production changed by +/- 2-3% depending on the commodity (Table 2). Cost of production will vary based on geographic location, targeted yield, and production practices.

    Cost of production should be estimated for two separate measures—cash costs and economic costs. Cash costs are expenses that need to be paid during the production and marketing year, while economic costs include cash costs as well as ownership and other non-cash costs. In the short run, farms can operate covering cash costs, however, economic costs need to be covered for the operation to remain viable in the long-term. The cash and economic cost per bushel or pound are calculated by dividing cost by target yield (breakeven cash and economic cost per bushel or pound).

    The crop insurance coverage per bushel or pound divided by the cash or economic cost provides an estimate of the relative financial risk by year and commodity. The analysis in Table 2 shows that in 2024, 74-75% of the economic cost of production for corn, cotton, and soybeans was covered by Revenue Protection crop insurance, compared to 76% for corn, 65% for cotton, and 67% for soybeans in 2025. For the start of the 2025 crop year, the financial risk mitigated by crop insurance favors corn over soybeans and cotton. 

    Calculating relative cash and economic risk exposure between commodities produced on a farm can help guide crop insurance purchasing decisions (buyup coverage, unit structure, and companion policies) and guide a marketing and price risk management strategy to secure prices beyond crop insurance protection. 

    Table 1. Revenue Protection Crop Insurance for Corn, Cotton, and Soybeans, 2024 and 2025

    2024 Crop Insurance
    CommodityProjected Crop Insurance Price($/bu or $/lb)APH(bu or lb)Coverage Level (%)Revenue Guarantee ($/acre)Crop Insurance Coverageper bu or lb
    Corn$4.6617575%$612$3.50
    Cotton$0.831,15075%$716$0.62
    Soybeans$11.555075%$433$8.66
    2025 Crop Insurance
    CommodityProjected Crop Insurance Price($/bu or $/lb)APH(bu or lb)Coverage Level (%)Revenue Guarantee ($/acre)Crop Insurance Coverage per bu or lb
    Corn$4.7017575%$617$3.53
    Cotton$0.691,15075%$595$0.52
    Soybeans$10.545075%$395$7.91
    *Crop insurance coverage per bushel or pound is calculated as the revenue guarantee divided by the APH.

    Table 2. 2024 and 2025 Estimated Cost of Production for Non-Irrigated Corn, Cotton, and Soybeans and Relative Crop Insurance Coverage 

     2024 Cost of Production
     Cash Costs ($/acre)Economic Costs ($/acre)Target Yield(bu or lb)Cash Cost ($ per bu or lb)Economic Cost ($ per bu or lb)Crop Insurance Coverage divided by Cash Cost (%)Crop Insurance Coverage divided by Economic Cost (%)
    Corn$697 $825 175$3.98$4.7188%74%
    Cotton$777 $958 1,150$0.68$0.8392%75%
    Soybeans$464 $579 50$9.28$11.5893%75%
     2025 Cost of Production
     Cash Costs ($/acre)Economic Costs ($/acre)Target Yield(bu or lb)Cash Cost ($ per bu or lb)Economic Cost ($ per bu or lb)Crop Insurance Coverage divided by Cash Cost (%)Crop Insurance Coverage divided by Economic Cost (%)
    Corn$696$817175$3.98$4.6789%76%
    Cotton$760$9321,150$0.66$0.8178%64%
    Soybeans$477$58750$9.54$11.7483%67%
    *Cash and economic cost per bushel or pound are calculated as cash/economic cost divided by target yield

    References and Resources:

    University of Tennessee Crop Budgets. 2024 and 2025. https://arec.tennessee.edu/extension/budgets/.

    USDA Risk Management Price Discovery. https://public-rma.fpac.usda.gov/apps/PriceDiscovery.


    Smith, Aaron. “Changes in Relative Financial Risk for Corn, Cotton, and Soybeans in 2024 and 2025.Southern Ag Today 5(10.3). March 5, 2025. Permalink

  • Flat Global Demand and Increased Brazil Production Provide Challenges for U.S. Cotton Prices

    Flat Global Demand and Increased Brazil Production Provide Challenges for U.S. Cotton Prices

    Cotton futures prices have struggled to gain traction over the past six months. The last time nearby cotton futures were above 75 cents was June 28, 2024. Since July, nearby cotton futures prices have traded mostly between 66 and 73 cents. New crop (December 2025) futures prices are currently below 70 cents, which will not provide attractive pricing opportunities for cotton producers. Additionally, if new crop futures prices remain low through the crop insurance price determination period, the safety net will be diminished and will likely result in decreased planted acres in the United States. Global supply and demand have played a role in low cotton prices. Figures 1 and 2 show global cotton demand and Brazil cotton production which have contributed to lower cotton prices. 

    Global cotton demand has been flat for more than two decades and per capita cotton consumption has trended lower (Figure 1). Projected global cotton consumption for the 2024/25 marketing year is 116 million 480 lb bales, the same as 2010/2011. Competition with synthetic fibers has resulted in a lower market share for cotton and reduced demand. Improved demand will be essential if cotton prices are to improve. 

    Compounding the challenges for U.S. cotton producers has been the rise of Brazil. In the last ten years, Brazil has more than doubled cotton production from 7.18 million 480 lb bales to 16.9 million 480 lb bales (Figure 2). The rise of Brazil cotton production has provided substantial competition for export markets. The combination of increased cotton production and flat global demand will continue to weigh on global cotton prices. 

    Figure 1. Global Cotton Consumption and Per Capita Consumption, 2000/01-2024/25

    Figure 2. Brazil Cotton Production, 2000/01-2024/25

    References

    USDA Foreign Agricultural Service (FAS), Production Supply and Distribution. Accessed at:https://apps.fas.usda.gov/psdonline/app/index.html#/app/home

    Barchart.com. Nearby Cotton Futures Contract. Accessed at: https://www.barchart.com/futures/quotes/CTH25/interactive-chart


    Smith, Aaron. “Flat Global Demand and Increased Brazil Production Provide Challenges for U.S. Cotton Prices.Southern Ag Today 5(5.3). January 29, 2025. Permalink

  • Corn Price Reaction to Changes in USDA WASDE Projections 

    Corn Price Reaction to Changes in USDA WASDE Projections 

    The January USDA World Agricultural Supply and Demand Estimates (WASDE) report provided more revisions to the U.S. corn balance sheet. Revisions to USDA domestic corn estimates have been mostly positive for corn prices since the USDA’s September WASDE projections. This month’s revisions propelled March corn futures 20 ½ cents higher in two trading days, from $4.56 to $4.76 ½. Since the September WASDE, March corn futures have increased from $4.04 ¾ to $4.76 ½, a $0.71 ¾ increase. 

    Was the price increase justified based on the revised information? Yes. 

    Table 1 compares the USDA WASDE estimates in September to January for corn. The two primary changes were a decrease in the national average yield of 4.3 bu/acre (183.6 to 179.3 bu/acre), a 2.3% decrease, and an increase in exports of 150 million bushels (2.3 to 2.45 billion), a 6.5% increase. Driven by these two adjustments, projected 2024/25 marketing year ending stocks in the United States decreased 517 million bushels, from 2.057 billion to 1.54 billion bushels. A 25.1% decline in ending stocks, combined with the change in use, resulted in a decline in stocks-to-use from 13.7% to 10.2%. Small percentage adjustments to supply and demand can result in relatively large changes in stocks-to-use and the marketing year average price.

    Table 1. September and January USDA WASDE Projections for Corn for the 2024/2025 Marketing Year

     2024/25 Marketing Year Projections
     SeptemberJanuaryChange% Change
    Planted (million)90.790.6-0.1-0.1%
    Harvested (million)82.782.90.20.2%
    U.S. Avg. Yield (bu/acre)183.6179.3-4.3-2.3%
    Beg. Stocks 1,8121,763-49-2.7%
    Production15,18614,867-319-2.1%
    Imports252500.0%
    Total Supply17,02216,655-367-2.2%
    Feed and Residual5,8255,775-50-0.9%
    Ethanol5,4505,500500.9%
    Food, Seed & Industrial1,3901,39000.0%
    Exports2,3002,4501506.5%
    Total Use14,96515,1151501.0%
    U.S. Ending Stocks2,0571,540-517-25.1%
    Foreign Stocks 10,08210,008-74-0.7%
    U.S. Mrk. Year Avg. Price ($/bu)$4.10 $4.25 $0.15 3.7%
    U.S. Stocks/Use13.7%10.2%-3.6%-25.9%

    Stocks-to-use is one of the better predictors of the corn marketing year average price. In September, the USDA projected stocks-to-use at 13.7% and estimated the marketing year average price at $4.10, higher than the predicted value of $3.68 (Figure 1). In January, stocks-to-use were projected at 10.2% and the marketing year average price at $4.25, lower than the predicted value of $4.73. The muted response in the USDA WASDE price and the stocks-to-use predicted price can be partially attributed to the crop marketed between September and January.

    The key takeaway from the USDA revisions to projected corn supply and demand estimates and the futures market reaction:, the revisions justify the increase in prices. Based on current information, a reasonable nearby corn futures price trading range is $4.60-$5.10.   

    Figure 1. Corn U.S. Stocks-to-Use Ratio and Marketing Year Average Price 2006/07 to 2023/24

    References

    USDA World Agricultural Supply and Demand Estimates (WASDE) report. January and September. https://www.usda.gov/about-usda/general-information/staff-offices/office-chief-economist/commodity-markets/wasde-report.

    Barchart.com. March 2025 Corn Futures Contract. Accessed at: https://www.barchart.com/futures/quotes/ZCH25/interactive-chart.