Author: Aaron Smith

  • 2025 Crop Planning

    2025 Crop Planning

    Farming in 2025 will be challenging for many row crop producers. Low commodity prices, disappointing 2024 yields, high input costs, and policy uncertainty will require crop farmers to make important agronomic, financial, and risk management decisions. Below are a few points to consider during the planning process.

    1) Commodity prices are low and there is currently nothing on the radar that would indicate substantial improvement will occur in 2025. Drought (beyond just the southern region), production disruptions abroad, and geopolitics could improve price prospects, but at this point in time, increases in commodity prices are highly uncertain and mostly wishful thinking.

    2) Trade/retaliatory tariffs are a concern and provide the potential for substantial downside price risk in commodities that are heavily reliant on export sales, like soybeans and cotton. Protecting against downside price movements should be considered.

    3) Producers need to distinguish between cash versus non-cash costs (capital recovery) in the short term. We can farm in the short-term covering cash costs, but in the long term we need to cover total economic costs. 

    4) Input costs and profit margins need to be managed effectively – do not cut costs at the expense of yield but do not pursue the highest yield possible. Approximately 90% of cash costs are in five cost categories: land, seed, chemical, fertilizer, and operating expenses for equipment (fuel, labor, repairs and maintenance). Farmers should evaluate the efficiency of these five costs to assist in managing profit margins.

    5) Secure financing early. It will be a challenging year for many farmers to secure operating credit for 2025. Obtaining financing needs to occur as early as possible. Understand your financial position and how lenders evaluate credit applications. There are five main factors lenders consider: repayment, liquidity, solvency, collateral, and relationship. Which factors lenders emphasize, and the ratio or measure to evaluate the factor, will depend on the agricultural lender or credit provider. Talk to your primary lender early and often.

    6) Develop a marketing and risk management plan that includes crop insurance, storage analysis, contracts, futures, and options. Do not use the same marketing and risk management strategy in the current market environment as when we had higher prices and higher volatility two years ago.

    7) There is the potential for payments from the federal government (FARM Act? or other Ad Hoc legislation) and a new Farm Bill is possible in 2025. Until they are realized, it is not advised to incorporate these potential payments into the 2025 financial plan. If realized, they are a bonus.

    Due to the above challenges and the complexity of modern farming, it is essential for farmers to surround themselves with a strong support network. Important roles in farmer support networks include:

    Lawyer – Having appropriate legal advice is essential for agricultural enterprises. This can include a local lawyer for general legal matters but may also include specialized legal advice for more complex legal concerns. Paying for specialization is often cheaper in the long run. 

    Accountant – Nobody likes paying taxes, but it is essential for farmers to obtain assistance when preparing tax returns, planning purchases, or transitioning the farm to the next generation. A good accountant can save you money and assist if you have issues with the IRS. 

    Crop Insurance Agent – Crop insurance is the primary risk management tool for most crop producers. Crop insurance can be complicated to navigate and requires individual, policy-specific analysis to ensure you are receiving the most effective coverage for the premium paid. 

    Agricultural Lender – Agriculture is a capital-intensive business. Adequate and consistent access to operating and term debt is essential for most farmers. Having a primary agricultural lender that understands your operation and that will stick with you through agricultural cycles is imperative. This is not to say that all credit will be obtained through one lender. Farmers need to make sure that the cost of credit is fully analyzed and that decisions make financial sense. 

    Broker / Marketer / Grain Merchandiser – Marketing is not a strength for most farmers. However, in times of low prices and tight margins, marketing can be the difference between profit and loss. Obtaining expertise or a second opinion can be a tremendous benefit.

    Crop Consultant / Agronomist – Every production year is different and will require problem solving so a crop can be produced and sold. Yield is important; however, in periods of low prices and elevated input costs, it is essential that each input pulls its own weight economically. The cost of the input must be fully covered by financial benefits. A good agronomist can help navigate the agronomic challenges of the production season. 

    Extension Agent / Specialist – Extension provides a network to problem solve and connect producers with expertise to address problems and verify information independent of a financial motive. Searching the internet can be a powerful tool to assist in decision making. However, the internet has carpet bombed the information landscape with unreliable advice, opinions, and conspiracies, so be wary of information sources. 


    Smith, Aaron. “2025 Crop Planning.” Southern Ag Today 4(51.3). December 18, 2024. Permalink

  • Changes to Supply and Demand Estimates in the November WASDE

    Changes to Supply and Demand Estimates in the November WASDE

    On November 8, the USDA released its monthly World Agricultural Supply and Demand Estimates (WASDE) report. Table 1 provides a summary of the November WASDE estimates for wheat, corn, soybean, and cotton.

    Table 1. Wheat, Corn, Soybean, and Cotton Supply, Use, Stocks, and Price Estimates, November 2024 WASDE

     WheatCornSoybeanCotton
     Production and Supply
    Planted (million acres)46.190.787.111.17
    Harvested (million acres)38.582.786.38.63
    Yield (bu/acre or lb/acre)51.2183.151.7789
    Production (millions of bushels or bales)1,97115,1434,46114.2
    Total Supply (millions of bushels or bales)2,78816,9284,81817.4
     US Exports and Use
    Exports (millions of bushels or bales)8252,3251,82511.3
    Total Use (millions of bushels or bales)1,97314,9904,34813.1
    Exports % of Total Use42%16%42%86%
     Stocks and Price
    U.S. Ending Stocks
    (millions of bushels or bales)
    8151,9384704.3
    Foreign Ending Stocks
    (millions of bushels or bales)
    8,64910,0354,37171.45
    U.S. Stocks/Use (%)41%13%11%33%
    U.S. Avg. Season Price ($/bu or $/lb)$5.60$4.10$10.80$0.66
    Data Source: USDA November WASDE

    Wheat

    Month-over-Month Changes

    Limited revisions were made to U.S. wheat supply and demand estimates. Imports increased 5 million bushels, and food use increased 2 million bushels, resulting in a 3 million bushel increase in U.S. projected ending stocks. Limited changes to foreign supply and demand resulted in a 9 million bushel decrease in foreign stocks.

    Year-over-Year Changes

    Compared to the last marketing year, U.S. production was up 276 million bushels and ending stocks were up 199 million bushels; however, foreign wheat stocks were down 438 million bushels, from 9.087 billion to 8.649 billion.

    Price Reaction and Outlook

    Prices for the report release day traded mostly flat, with price reaction limited to a 10-15 cents trading range. Overall, the report does not change the outlook for wheat prices.

    Corn

    Month-over-Month Changes

    The most substantial revision compared to the previous month was a decrease in the U.S. national average corn yield of 0.7 bu/acre, resulting in a 60-million-bushel decline in production. With use unchanged, ending stocks decreased 60 million bushels to 1.938 billion. Foreign stocks decreased 33 million bushels due primarily to increased corn use in Brazil, Mexico, and Southeast Asia. No production changes were noted in South America. 

    Year-over-Year Changes

    Year-over-year changes show a mixed supply and demand situation. U.S. corn production is estimated to be up 199 million bushels, with exports up 33 million. Net, the projected increase in U.S. ending stocks is 178 million bushels. Foreign stocks are projected to decline 575 million bushels compared to the previous marketing year.

    Price Reaction and Outlook

    Corn futures prices reacted positively to the report, with prices up a few cents for the day. Overall, the report can be viewed as neutral to slightly bullish for corn prices. The price outlook has not fundamentally changed; however, the report assists in stabilizing the downside of the market.

    Soybean

    Month-over-Month Changes

    The U.S. average soybean yield decreased 1.4 bu/acre to 51.7 bu/acre, resulting in a decline in production of 121 million bushels. Exports and crush were decreased 15 and 25 million bushels, respectively. Projected ending stocks decreased 80 million bushels to 470 million. Foreign projected ending stocks also decreased 26 million bushels. No changes were made to South American production estimates.

    Year-over-Year Changes

    Compared to the previous marketing year, U.S. soybean production is estimated up 371 million bushels, and total use is up 243 million bushels. U.S. and foreign ending stocks are estimated up 128 million bushels and 582 million bushels, respectively.

    Price Reaction and Outlook

    Futures prices reacted positively to the WASDE report, with prices up 3-5 cents for the day. Overall, the report was slightly bullish for soybean prices; however, price direction will be dictated by crop progress in South America.

    Cotton

    Month-over-Month Changes

    U.S. exports decreased 200,000 bales compared to October, resulting in a corresponding increase in U.S. ending stocks. Projected U.S. carryover into the next marketing year is 4.3 million bales. Foreign cotton stocks declined 780,000 bales due primarily to stock revisions in India and production decreases in Pakistan.

    Year-over-Year Changes

    Compared to the previous marketing year, U.S. production is up 630,000 bales, and exports are down 450,000 bales. Year-over-year ending stocks are projected to increase 1.15 million bales. Foreign stocks are projected to be unchanged compared to 2023/24.

    Price Reaction and Outlook

    Cotton prices showed limited movement for the day. Price ranges remained firmly intact, with nearby cotton futures trading 69-73 cents and deferred contracts at a 3-5 cents premium. Global demand remains the primary obstacle to improved cotton prices.

    References and Resources

    USDA World Agricultural Supply and Demand Estimates (WASDE). November 8, 2024. https://www.usda.gov/oce/commodity/wasde/wasde1124.pdf


    Smith, Aaron. “Changes to Supply and Demand Estimates in the November WASDE.Southern Ag Today 4(46.3). November 13, 2024. Permalink

  • A Soybean Pricing Alternatives at Harvest

    A Soybean Pricing Alternatives at Harvest

    As harvest continues to progress, farmers face the decision to sell or store soybeans. If soybeans are stored, farmers should evaluate the risks and rewards of holding soybeans priced or unpriced. Consideration should be given to both futures price risk and basis risk for individual locations. Holding soybeans in storage with no price protection is risky, as the value of the crop in storage has the potential to decline in value, while also incurring storage costs, such as interest. USDA projects Brazil’s soybean production to be a record crop of 6.2 billion bushels, up 10% compared to last year (USDA September 2024 WASDE). Brazil’s soybean planting season runs from September through December, with harvest occurring from January through May (USDA, FAS). As such, the price of U.S. soybeans held in storage will be strongly influenced by production risk during the growing season in South America. 

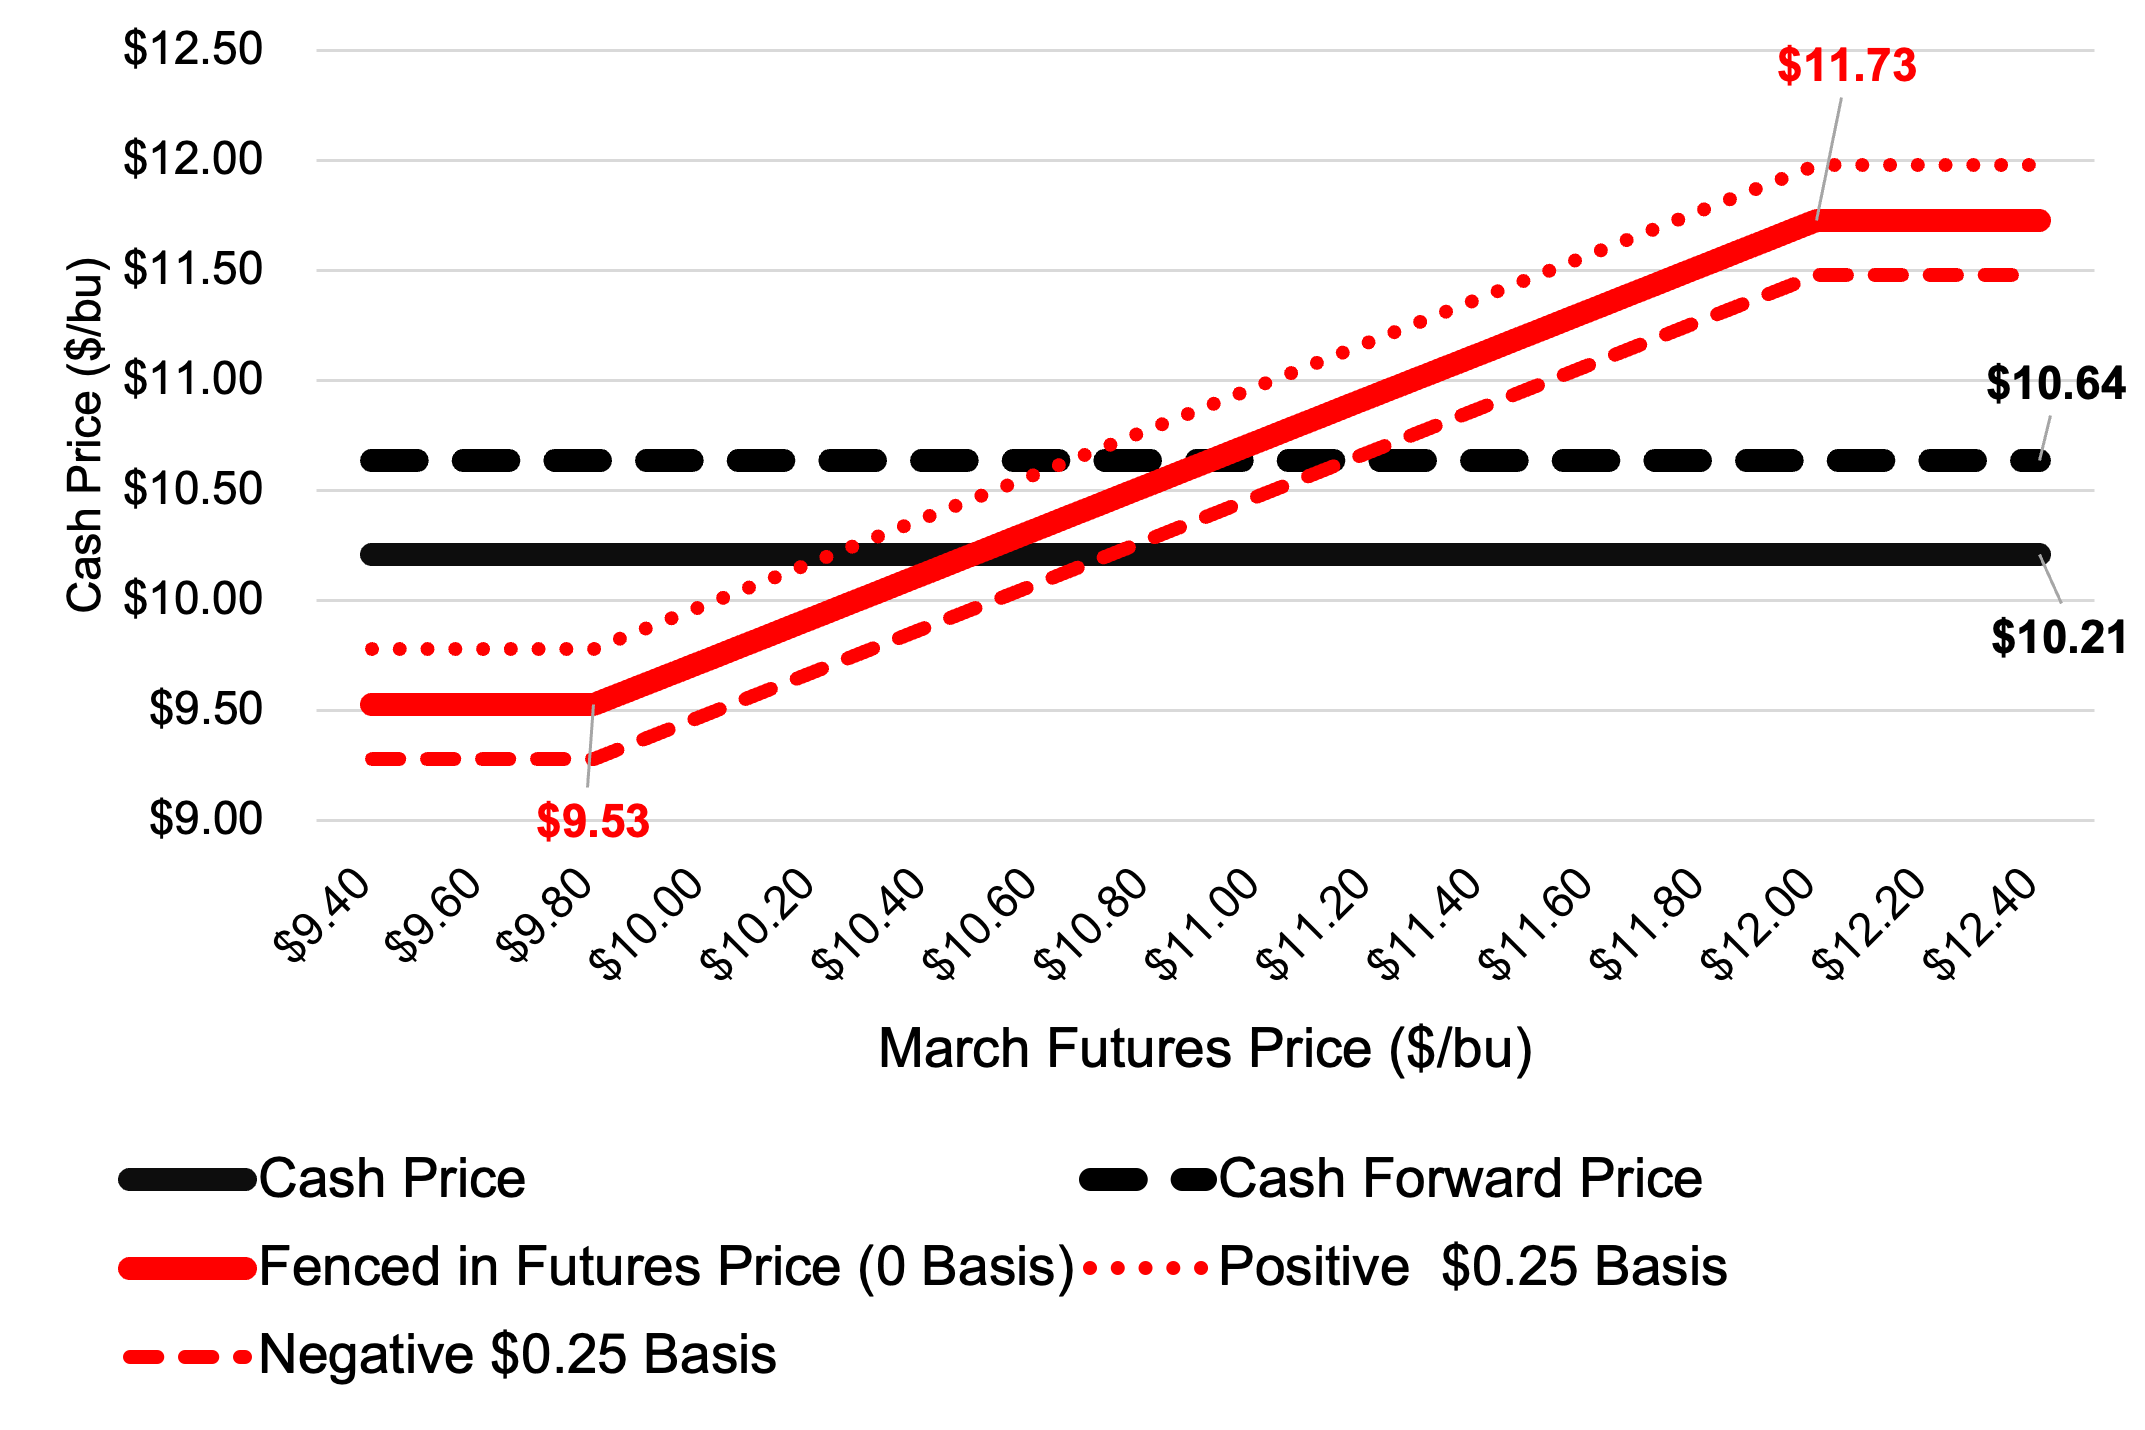
    Figure 1. Three soybean pricing scenarios in Memphis, TN as of Oct 3, 2024 

    This article examines three scenarios for pricing soybeans this fall.

    1. Sell soybeans at the current cash price;
    2. Store soybeans and establish a cash forward contract price for delivery in February; and
    3. Buy a put option and sell a call option to fence in a futures price with delivery of soybeans to a cash market in February.

    All futures market prices, premiums, and cash prices are for Memphis, Tennessee, as of October 3, 2024. Interest is assumed at an 8% rate.

    In scenario one, the cash price was $10.21 (November Futures contract $10.46; negative basis of $0.25). This is the most straight forward scenario. The farmer sells soybeans and receives $10.21 (solid black line in Figure 1).

    In scenario two, the farmer decides to store soybeans but wants to establish a price, so he enters a cash forward contract for delivery in February for $10.91. The interest cost to carry soybeans for four months is estimated at $0.27 ($10.21 x 8% x (4 months / 12 months)). Once delivered, the farmer receives $10.64 ($10.91 less $0.27 of interest expense; dashed black line in Figure 1). 

    In scenario three, the farmer stores soybeans for February delivery and buys a $9.80 March put option for $0.13 and sells a $12.00 March call option for $0.13, making the strategy premium neutral, without including transaction costs. This strategy has fenced in a futures price (does not include basis) between $9.53 and $11.73 (solid red line in Figure 1). Change in the March futures contract will determine the outcome. Positions in the futures market would be offset by cash sales. If March futures are below $9.80, assuming 0 basis, the producer will receive $9.53 ($9.80 less $0.27 in interest). For March futures prices below $9.80, the put option would be exercised, establishing a short position in the futures market for the farmer. If March futures are above $12.00, the producer will receive $11.73 ($12.00 less $0.27 in interest). For March futures prices above $12.00, the call option would be exercised, establishing a long position in the futures market for the farmer.  March futures prices between $9.80 and $12.00 will result in cash prices between $9.53 and $11.73. March futures prices above $10.48 would provide a net price greater than the cash sale in scenario 1, and a March futures price above $10.91 would provide a cash price greater than the storage with a cash forward contract in scenario 2. An additional benefit of the options strategy is that the farmer can set basis immediately or any time prior to delivery of the soybeans to the cash market. The dotted red lines in figure 1 show how a positive or negative $0.25 basis would affect the cash price received under the fenced in futures price scenario. 

    All three alternatives have advantages and disadvantages. Farmers need to determine their access to storage, price risk tolerance, and expectations for futures prices and basis for their market to evaluate which strategy is right for their operation.

    References

    Barchart.com. Soybean Futures and Options Prices and Premiums. https://www.barchart.com/futures/quotes/ZS*0/futures-prices?viewName=main

    USDA Foreign Agricultural Service. Country Summary. Brazil Soybean Area, Yield and Production. https://ipad.fas.usda.gov/countrysummary/Default.aspx?id=BR&crop=SoybeanUSDAUSDA September 2024 WASDE Report. https://www.usda.gov/oce/commodity/wasde

  • National Corn Yields and Deviation from Trendline Over Time

    National Corn Yields and Deviation from Trendline Over Time

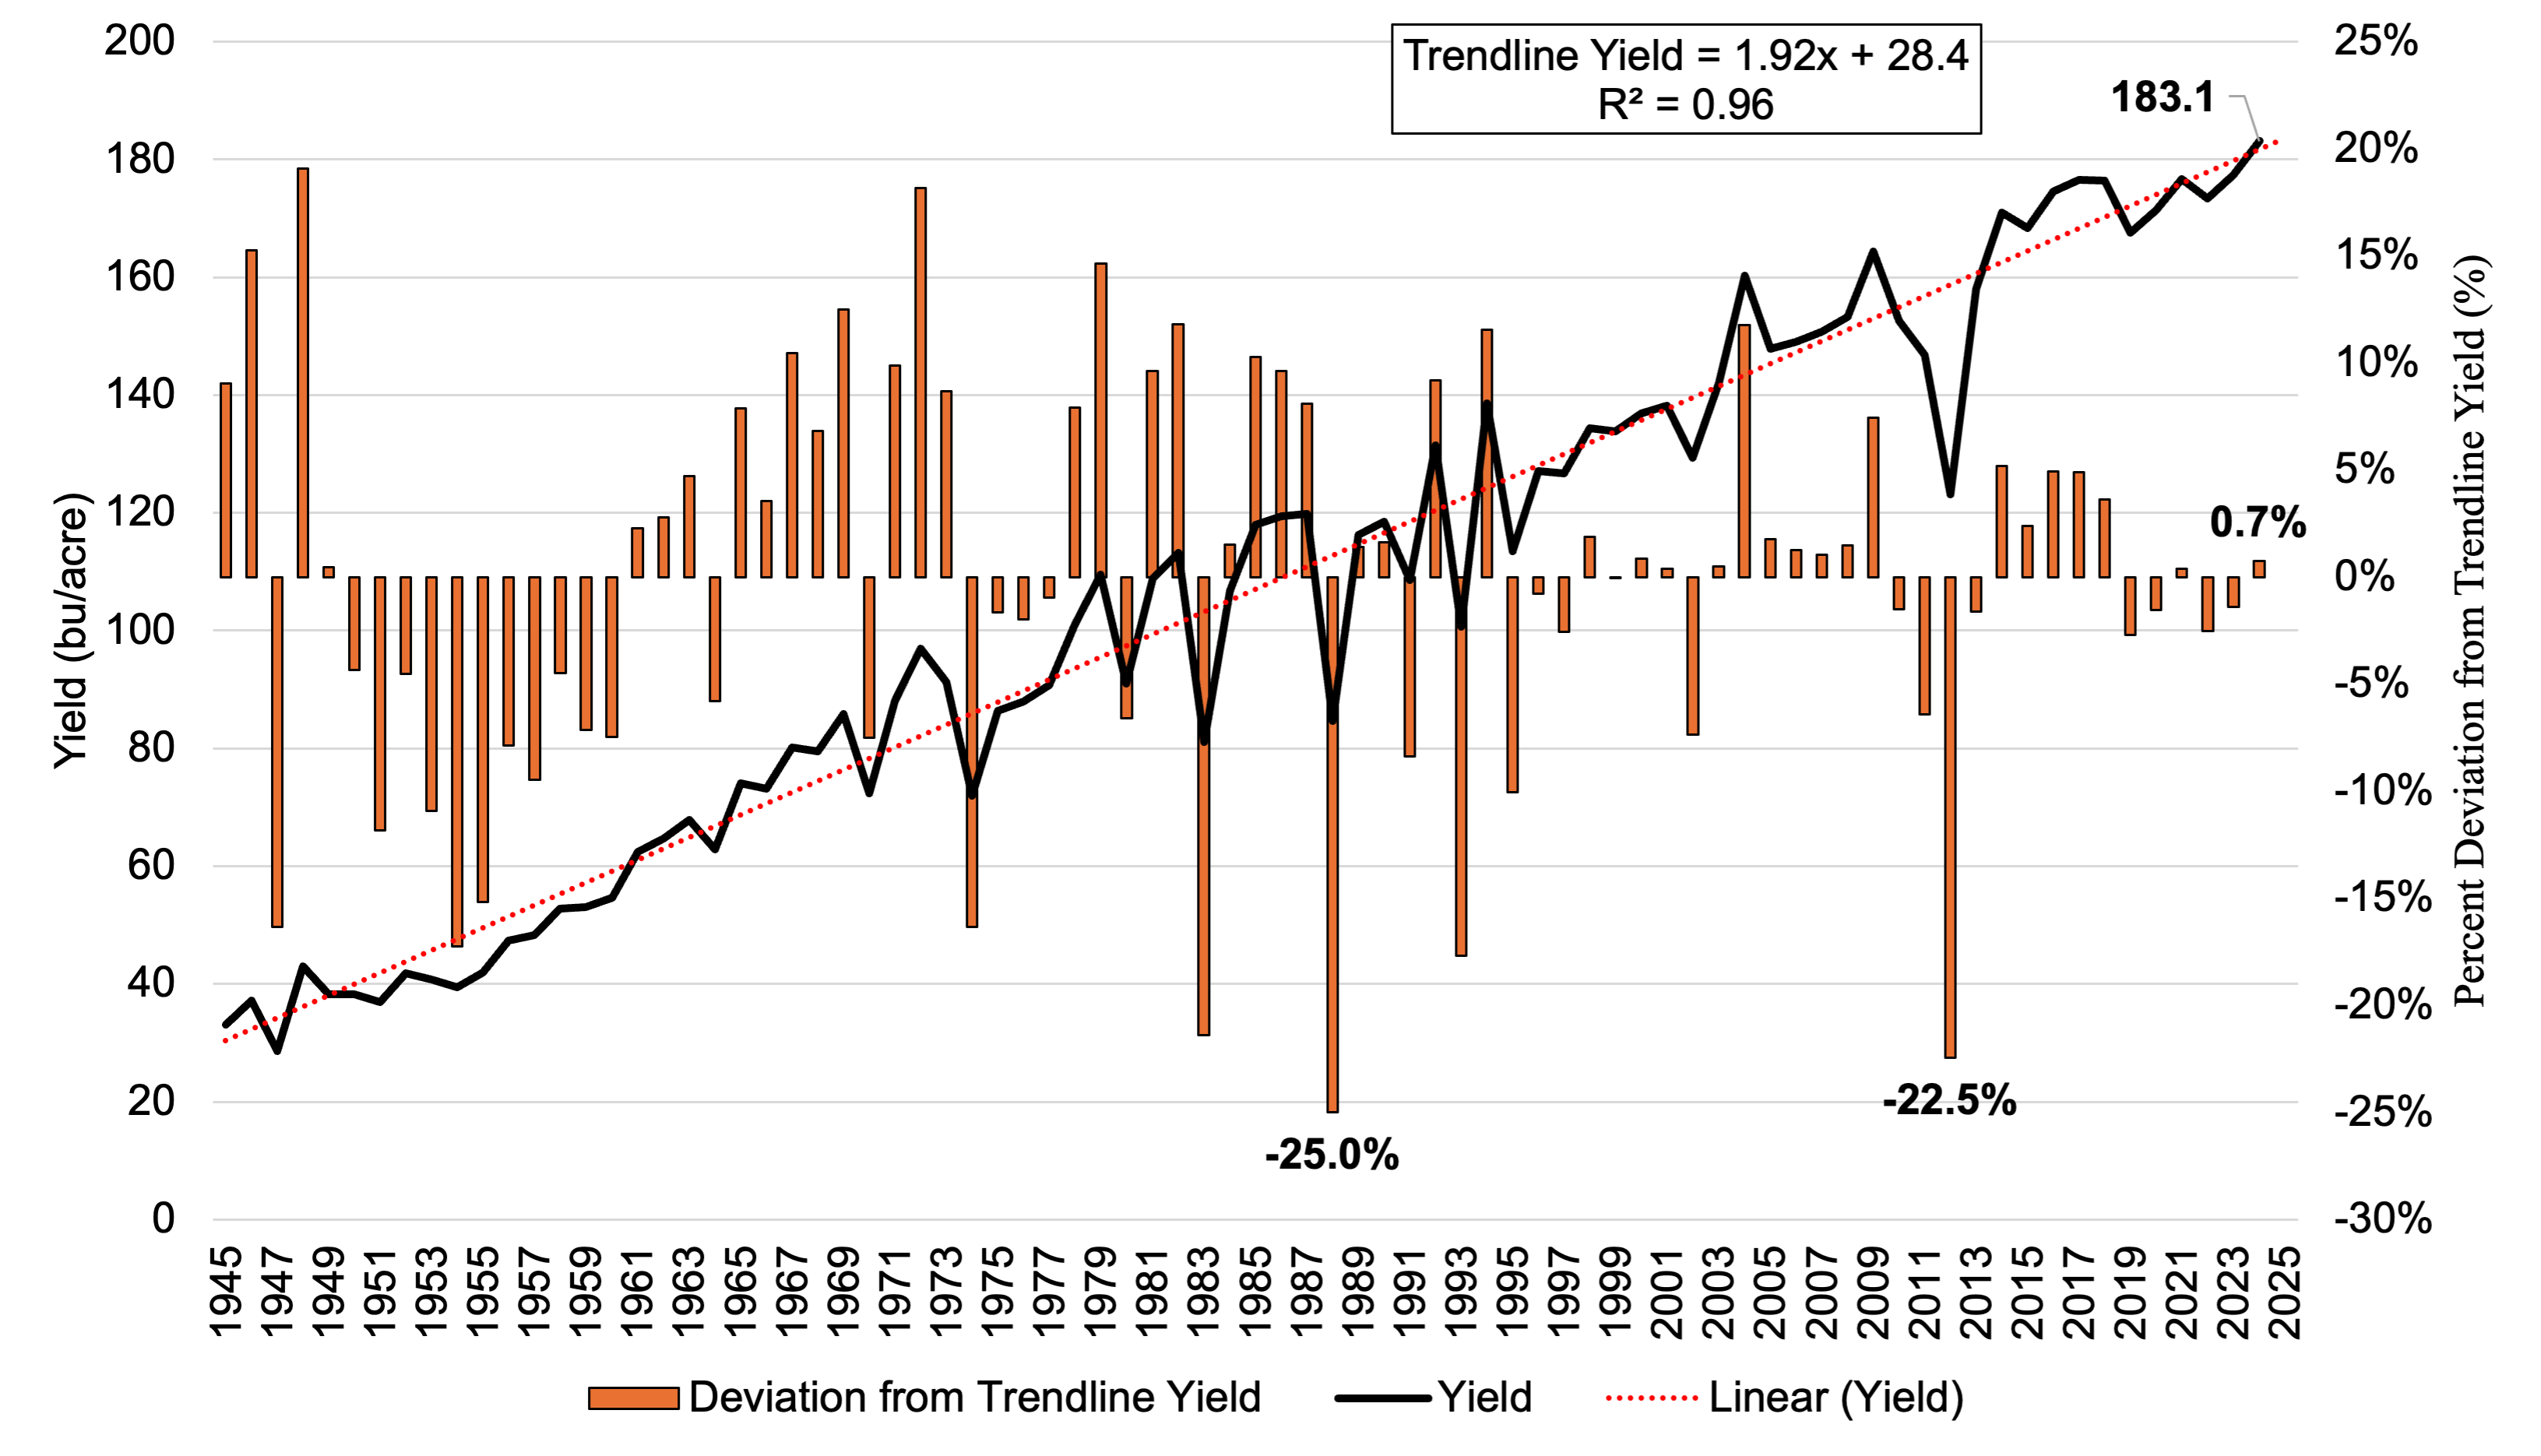
    The USDA is currently forecasting a record national average corn yield of 183.1 bushels per acre for 2024 (Figure 1). Record yield and flat demand have contributed to projected ending stocks of over 2 billion bushels, pushing December corn futures contract prices from $4.80/bu in May to a low of $3.85/bu at the end of August. Additionally, record yields across many regions will provide a weaker than typical basis for many corn producers. USDA will continue to modify yield estimates as additional harvest data are collected this fall and winter. The USDA’s final yield estimate will be provided in January 2025. This article examines national corn yields and changes in percent yield deviation from a trendline over time.

    Figure 1. U.S. corn average yield, linear trendline yield, and percent deviation from trendline, 1945-2024

    * 2025 yield is trendline forecast.

    Since 1945, U.S. national average corn yield has increased an average of 1.9 bushels per acre per year, or 19 bushels every 10 years. Drought is typically responsible for substantial negative deviations from the trendline (-25% in 1988 and -22.5% in 2012; Figure 1). Severe widespread droughts will continue to negatively impact national average corn yields in the future, presenting as large deviations from a long term trendline. However, there are patterns that emerge in the yield deviation from trendline data. There is a tendency to have multiple years of deviation above trend (2003-2009 and 2014-2018) or below trend (1995-1997 and 2010-2013). The number of years differs, and can contain a contradictory year, but there is a pattern. This is not to say that the current yield indicates that for the next few years yields will be above trendline. The second is there is a smaller percent deviation (positive or negative) from trendline in recent decades. From 1965-1994, U.S. corn yields deviated (+ or -) from trendline by more than 10% in 11 years and by more than 7.5% in 20 out of 30 years (Table 1). By contrast, from 1995-2024, yields deviated by greater than 7.5% in only 3 years. The average percent deviation from trendline from 1995-2024 was 3.7% compared to 9.4% from 1965-1994. Thus, with the exception of a few extreme years, yield in the past 30 years has been following a long term trendline. National average yield impacts the prices producers receive. Understanding long term national, state, and regional yield trends and patterns can assist in formulating a risk management and marketing strategy. 

    Table 1. The number of years from 1965-1994 and 1995-2024 with national corn yields 10%, 7.5%, 5%, or 2.5% higher or lower than the linear trendline

    References

    USDA NASS National Corn Yield Data. NASS Quick Stats. https://www.nass.usda.gov/Quick_Stats/

    USDA August WASDE Report. https://www.usda.gov/oce/commodity/wasde


    Smith, Aaron. “National Corn Yields and Deviation from Trendline Over Time.Southern Ag Today 4(37.1). September 9, 2024. Permalink

  • Storing corn or soybeans: what is the futures market incentivizing?

    Storing corn or soybeans: what is the futures market incentivizing?

    Storage is an important marketing and risk management tool that allows producers to extend the marketing interval and avoid seasonal low prices at harvest. As harvest rapidly approaches, producers will need to determine the amount of production that can be stored on-farm or in commercial storage and which commodities to store if limited space is available. Looking at current futures market price spreads provides an indication of whether the futures market is incentivizing storing corn or soybeans (Table 1 and 2). To compare the benefit of storage between commodities, we can look at the spread between the nearby and deferred futures contracts and the interest cost associated with carrying the commodity for sale at a later date. In this analysis, the interest rate is assumed to be 8.0%. This results in a monthly interest cost of $0.026/bu ($3.83/bu x 8% x 1/12 months) for corn and $0.067/bu/month ($10.08/bu x 8% x 1/12 months) for soybeans. 

    Comparing the May futures contract and interest cost for corn and soybeans indicates a benefit to storing corn over soybeans. The futures market spread between the September and May corn contract is $0.46/bu ($4.29/bu – $3.83/bu). The interest cost is $0.20/bu ($0.026/bu/month x 8 months). The spread less interest is $0.26/bu.  For soybeans, the September and May spread is $0.54/bu ($10.62/bu – $10.08/bu) with an interest cost of $0.54/bu ($0.067/bu/month x 8 months). This results in a soybean spread less interest of $0.00/bu. Examining other deferred contract months provides a similar result. Thus, the futures market is indicating a stronger incentive to store corn than soybeans. It is important to note that this analysis does not include changes in basis, which will vary by location and could change the storage preference between commodities.

    References

    Barchart.com. December Corn and Soybean Futures Prices. Accessed August 7, 2024 at: https://www.barchart.com/futures/grains?viewName=main


    Smith, Aaron. “Storing corn or soybeans: what is the futures market incentivizing?Southern Ag Today 4(33.1). August 12, 2024. Permalink