Author: Aaron Smith

  • Changes to Planted Acreage for Southern Crops in the June Acreage Report

    Changes to Planted Acreage for Southern Crops in the June Acreage Report

    On Friday June 28th the USDA released its annual Acreage report. The report estimates planted acreage of principal crops based on producer surveys conducted in the first two weeks of June. Nationally, principal acres planted were estimated at 315.177 million acres, up 1.866 million acres compared to the March Prospective Plantings report and 4.424 million acres lower than last year (Table 1). Southern states accounted for 22.8% of principal crop acreage. The largest negative and positive percent change (highlighted in Red and Black in the tables below) in principal crop acreage compared to the March Prospective Plantings report, in the southern states, were Oklahoma -5% and South Carolina +8%. Tables 2-7 show acreage changes, by state, compared to last year and the March Prospective Plantings report for corn, wheat, rice, soybean, peanuts, and cotton. 

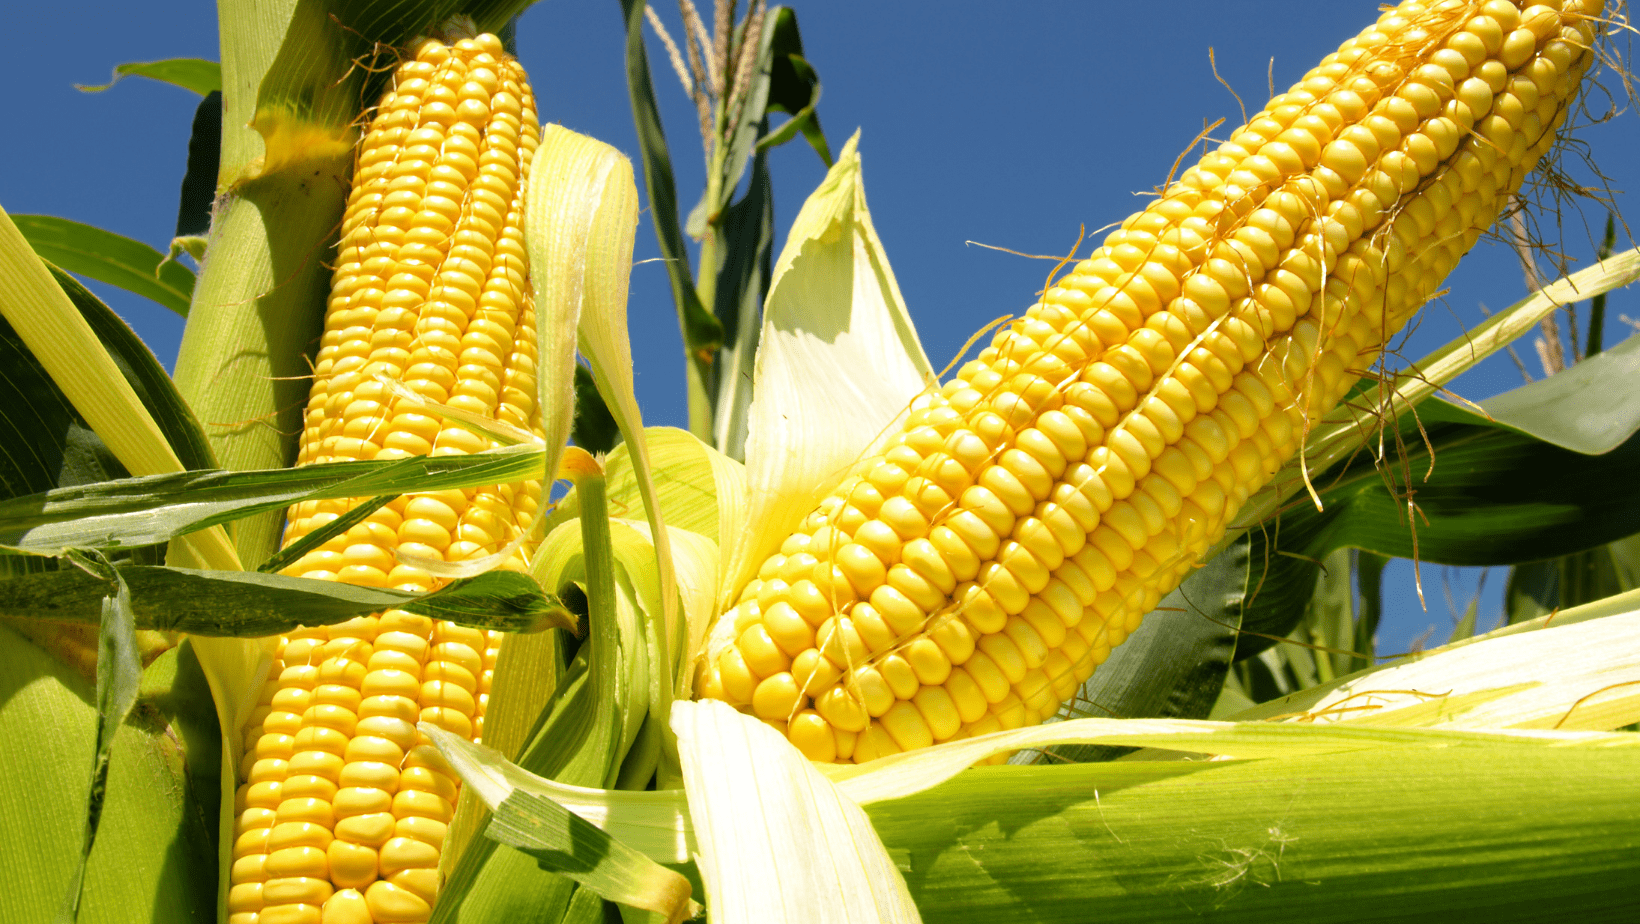
    Corn acres planted were estimated at 91.475 million acres nationally, with the southern states accounting for 10.1% of planted acres. National corn acres were higher than most pre-report predictions and 1.4 million acres greater than the March Prospective Plantings report. Corn futures prices declined 13 to 16 ½ cents for the day. In the southern states, South Carolina had the largest increase, compared to the March report, adding 80,000 acres (+27%), while Louisiana and Tennessee had 9% decreases in planted acres. Nationally, the report indicated that corn left to be planted was 3.36 million acres.

    All wheat planted acres were estimated at 47.24 million, down 258,000 acres compared to the March estimate. Revisions in acres were made for Alabama (-15,000 acres), Arkansas (+5,000), Georgia (-25,000 acres), South Carolina (-5,000 acres), Texas (-200,000 acres), and Virginia (-5,000 acres). Chicago wheat futures were down 4 ½ to 6 ¼ cents for the day, and Hard Red Wheat futures were down 4 ½ to 10 ½ cents.

    Southern states account for 75% of rice production nationally, with Arkansas the largest producer. Rice acres planted were unchanged in Texas and Mississippi, declined 30,000 acres in Arkansas and increased 30,000 acres in Louisiana.  

    Soybean acres were estimated at 86.1 million, down 410,000 acres compared to the March estimate – slightly lower than pre-report estimates. Soybean futures closed down ¾ to 2 ¾ cents for the day. In the southern states, planted acreage was reduced 10,000 acres compared to March, with reductions for Arkansas, North Carolina, and Oklahoma and increases for Alabama, Kentucky, Louisiana, South Carolina, and Tennessee. The report indicated that soybeans left to be planted were 12.8 million acres.

    Peanut acreage increased 7% (106,000 acres) compared to the March report. Increased planted acres in Texas, North Carolina, Georgia, and Mississippi were only partially offset by a small reduction in Alabama.

    Upland cotton acres were estimated at 11.488 million, nearly 1 million acres higher than the March estimate and pre-report forecasts. Cotton futures closed 1.63 to 2.21 cents per pound lower for the day. Texas planted acreage increased 890,000 acres compared to the March report, contributing by far the most to the change in national acreage. Arkansas had the largest percentage increase at +24%.

    Overall, the report provided bearish news for several markets that had already experienced substantial price declines this growing season. Moving forward, prices will continue to react to weather and revisions to planted/harvested acreage estimates.

    References and Resources

    Barchart.com. Daily futures prices. Accessed at: https://www.barchart.com/futures/grains?viewName=main

    USDA National Agricultural Statistics Service (NASS). June 28, 2024. Acreage Report. Accessed at https://usda.library.cornell.edu/concern/publications/j098zb09z

    USDA National Agricultural Statistics Service (NASS). March 28, 2024. Prospective Plantings Report. Accessed at https://usda.library.cornell.edu/concern/publications/x633f100h

  • Corn Yields and 2024 Projected Linear Trendline Yields in Southern States

    Corn Yields and 2024 Projected Linear Trendline Yields in Southern States

    Calculating trendline yields can be a useful tool for budgeting or developing a crop marketing plan. Using trendline yield estimates at the start of the production year can assist in determining potential profitability, at current market prices, and determine if additional sales or price risk management is warranted. Projected yields should be periodically revisited during the production year to make adjustments to management practices and marketing strategies to improve the likelihood of positive financial outcomes. This article examines differences in linear trendline yields for corn across Southern States.   

    There is tremendous variability in average USDA NASS corn yields across the Southern States (Figure 1).  Over the past five years (2019-2023), Arkansas had the highest average corn yield at 179.8 bu/ac followed by Kentucky (177.6 bu/ac) and Mississippi (176.2 bu/ac). The lowest five-year average yields occurred in Texas (121.2 bu/ac), North Carolina (129.2 bu/ac), and South Carolina (129.8 bu/ac). 

    Projected linear trendline yields in 2024 for corn, using USDA NASS data from 1980-2023, vary tremendously (Table 1). The slope coefficient, in Table 1, provides the annual average increase in yield for each state from 1980 to 2023. The constant in Table 1 is the initial yield at the start of the linear trend line. For example, on average from 1980-2023, corn yields in Mississippi increased 3.33 bu/ac per year from a starting trendline yield of 43.57 bu/ac. An easier way to think about this is that over a ten-year period, average yield in the state of Mississippi increased by 33.3 bu/ac. Increases can be a result of production practices (such as irrigation) or technology (genetic improvements). In the past ten years (2014-2023), the increase in annual yield improvement for most Southern states has slowed.  R2 is a measure of the proportion of variation in the dependent variable (yield) that can be explained by the independent variable (time). Across the Southern U.S., we see tremendous variation in the R2 for linear trendline yields, ranging from a high of 0.926 for Mississippi to a low of 0.285 for Texas. Low R2 values indicate that the independent variable (in this case time) does not explain the variation in yield, thus other variables need to be considered when projecting yield.  

    Ideally, projecting annual yield should be conducted at the farm or field level using producer data. Crop insurance records or yield monitor data can allow producers to analyze, and project, yield and production to guide management and marketing decisions.

    Figure 1. Corn Yields in Southern States, 1980-2023 

    References

    USDA NASS Quick Stats. Corn Yields, 1980-2023. Accessed at https://quickstats.nass.usda.gov/  


    Smith, Aaron. “Corn Yields and 2024 Projected Linear Trendline Yields in Southern States.Southern Ag Today 4(23.1). June 3, 2024. Permalink

  • December 2024 Corn Option Premium Movement from October 2023 to April 2024 

    December 2024 Corn Option Premium Movement from October 2023 to April 2024 

    December 2024 corn futures declined 10% from October 5, 2023, to April 9, 2024 ($5.20/bu to $4.68/bu; Figure 1). As expected over the same period, call option premiums have declined and put option premiums have increased. For example, on October 20th, a $5.50 call option traded for 32 cents/bu and a $4.20 put option traded for 8 cents/bu (Figure 1). On April 9th, put and call option premiums, for those same strike prices, traded for 12 cents per bushel. The change in December corn options premiums indicates the markets have factored in less upside potential and slightly more downside risk in December 2024 corn futures than six months ago. Part of the change can be attributed to markets digesting additional information over the past six months, such as South American corn production, U.S. planted acreage estimates, export sales, and projected United States (US) and global corn carryover into next year (USDA WASDE Report). 

    Figure 1. December Corn $5.50 Call and $4.20 Put Option Premiums and Daily Futures Contract Close, October 5, 2023- April 9, 2024

    Data Source: Barchart.com

    The change in call and put option premiums over the past six months indicates the importance of timing when looking at implementing a price risk management strategy. Figure 2 shows scenarios for a hypothetical strategy of fencing in a corn futures price using the sale of a $5.50 call option and the purchase of a $4.20 put option at different points in time (approximately 30-day increments). The difference in the seven lines in Figure 2 is the change in the price of the sold call option premium and the price of the purchased put option premium. The strike prices for both the call and put options do not change; only the net premium received changes (the premium collected from selling the call option less the premium paid for the put). For example, on October 9th the $5.50 call option could have been sold for 30 cents/bu and the $4.20 put option purchased for 8 cents/bu. This would have resulted in a net premium gain of 22 cents/bu, shifting the fenced in futures price to $4.42 to $5.72 (Figure 2). On April 9th, a call option could have been sold for 12 cents/bu and a put option purchased for 12 cents/bu, resulting in a net premium of 0 cents/bu, setting the fenced in futures price at the put and call strike prices of $4.20 and $5.50. This example illustrates the importance of timing when executing an option strategy to mitigate futures price risk.  It is important to note that this example does not consider the increased risk of entering the strategy on October 9th versus on April 9th when more information is known about the December corn futures underlying fundamentals and associated price direction. 

    This article is for information and education purposes and does not constitute a trading recommendation.     

    Figure 2. A December Corn Futures Fence Example: Selling a $5.50 Call Option and Purchasing a $4.20 Put Option at Seven Points in Time from October 5, 2023, to April 9, 2024.

    References

    Barchart.com. December Corn Futures Contract Close. Accessed at: https://www.barchart.com/futures/quotes/ZCZ24/price-history/historical

    Barchart.com. December Corn Options Prices, Option Price History. Accessed at:  https://www.barchart.com/futures/quotes/ZCZ24/options?futuresOptionsView=split

    USDA World Agricultural Supply and Demand Estimates (WASDE). Accessed at https://www.usda.gov/oce/commodity/wasde


    Smith, Aaron. “December 2024 Corn Option Premium Movement from October 2023 to April 2024.Southern Ag Today 4(16.1). April 15, 2024. Permalink

  • Soybean Option Strategies

    Soybean Option Strategies

    Since the start of 2024, soybean futures prices have declined dramatically (Figure 1). The March and November contracts have declined 88 cents and 57 cents, respectively. The primary reason for the decline in soybean prices has been the projected large crop in South America. The February USDA WASDE report estimated soybean production in Argentina and Brazil at 1.84 and 5.73 billion bushels, respectively, compared to last year’s record Brazilian crop of 5.95 billion bushels and Argentina’s drought-stricken crop of 0.92 billion bushels. In aggregate, the two South American soybean production powerhouses are projected to increase year-over-year production by 700 million bushels. Increased production with moderate global demand will continue to weigh on futures market prices in 2024. Prices could be pushed higher if China increases soybean purchases or drought impacts US soybean production.

    Figure 1. Daily Closing Futures Prices for March (ZSH24) and November (ZSX24) Soybeans, January 2 to February 13, 2024

    Producers may want to consider using options to help mitigate price risk during the production or marketing year. Options can be a useful tool to manage price risk during specific time intervals. Past articles have examined mitigating price risk between the time when inputs were purchased and projected crop insurance prices were determined (Duncan, 2024). This article examines two option strategies for the start of the 2024 crop.

    Strategy #1: Purchase a put option. Purchasing a put option establishes a futures price floor for the selected strike price (Table 1). For example, a producer could purchase a $10.20 put option for 16.5 cents and set a $10.03 ½ futures floor. Strike prices and premiums can be selected to reflect the purchaser’s risk preference. No margin is required for strategies that purchase put options.

    Table 1. Strike price and premium for November soybean put options, February 14, 2024

    Strike (cents/bu)Premium (cents/bu)
    1000-0P12.9
    1020-0P16.5
    1040-0P20.9
    1060-0P26.0
    1080-0P32.1
    1100-0P39.1
    1120-0P47.0
    1140-0P55.9
    1160-0P65.8
    1180-0P76.5
    1200-0P88.1

    Strategy #2: Purchase a $10.60 November put option for 26 cents and sell a $13.00 November call option for 26 cents. This strategy fences in a futures price between $10.60 and $13.00 for a net zero premium. The strategy protects against futures prices declining below $10.60 at the cost of forgoing price increases above $13.00. This strategy relies on maintaining margin requirements.

    There are two primary concerns that producers voice when examining options 1) premiums are too high and 2) options often expire worthless. These two factors are interrelated as options should be used for a defined period of risk and then the position liquidated if the option is out-of-the-money, before the option expires. This avoids having the option expire worthless and can assist in recouping part of the premium. If options are in the money, then the position can be exercised, and financial gains realized. For experienced users of options, there are near infinite variations in strategy to consider (contract month, strike price, buy/sell puts or calls). Developing knowledge on using options adds another tool producers can use to manage their price risk.

    References and Resources

    Barchart.com. November Soybean Options Price Quotes.   https://www.barchart.com/futures/quotes/ZSX24/options.  

    Duncan, W.H. 2024. “Bridging the Price Risk Gap.” Southern AgToday. https://southernagtoday.org/2023/11/27/bridging-the-price-risk-gap/

    USDA World Agricultural Supply and Demand Estimates (WASDE) Report. Office of the Chief Economist. February 2024. https://www.usda.gov/oce/commodity/wasde


    Smith, Aaron. “Soybean Option Strategies.” Southern Ag Today 4(8.1). February 19, 2024. Permalink

  • Real and Nominal Corn Futures Prices 

    Real and Nominal Corn Futures Prices 

    Most prices over time are displayed as nominal prices, indicating the numeric value of the item. This, however, can be misleading due to the declining purchasing power of money over time leading to increases in price, or inflation. Inflation can easily be conceptualized in the housing market. In 1980, the average price of a home in the United States was $80,000, while in 2023 the average house price was estimated at $513,000. The function of the home has not changed, but the numerical value has changed dramatically. To compare values over time, economists will transform nominal values into real values. The nominal price is the value of an item in dollars that are not adjusted for the value of the dollar over time. Real prices are an item’s nominal value adjusted for inflation and thus measure that value in terms of other items, over time. In the housing price example, the $80,000 average price in 1980 would be $238,320 in 2023 dollars.  This article adjusts nominal nearby corn futures prices from 1980 to 2023 to real prices. The baseline month for real prices for this analysis is November 2023 (for November 2023, nominal price = real price = $4.83; figures 1 & 2).

    Figure 1. Monthly Nominal Nearby Corn Futures Prices, 1980-2023

    Figure 2. Monthly Real Nearby Corn Futures Prices, 1980-2023 (Base = November 2023)

    * Real prices = nominal prices adjusted by the producer price index. 

    Since 1980, the monthly average corn futures price (nominal price) has averaged $2.89/bu. The highest monthly average price was in April 2022 at $8.14/bu, and the lowest monthly average price was $1.47/bu in January 1987. So, comparing the current price of corn – $4.83/bu – would indicate that although prices are down from the recent high, prices are still nearly $2.00 above the long-term average. 

    Examining real monthly nearby corn futures prices provides a very different comparison. The current price is the same $4.83/bu; however, this is $0.50/bu below the 1980 to 2023 real average price of $5.33/bu. The current price is near the price range from 2014 to 2020, a period that few corn farmers would associate with high prices. For real prices (in November 2023 dollars), the high and low occurred October 1980 at $10.73/bu and September 2005 at $3.00/bu. 

    So, are corn prices high or low? Like all good economic questions, it depends. Analyzing real prices can be beneficial to provide historical context and allow for a comparison considering the same purchasing power.  Decisions can then be based on longer-term price cycles and trends.

    References and Resources

    Barchart.com. Monthly Nearby Corn Futures Interactive Chart.  https://www.barchart.com/futures/quotes/ZCH24/interactive-chart

    U.S. Bureau of Labor Statistics, Producer Price Index by Commodity: All Commodities [PPIACO], retrieved from FRED, Federal Reserve Bank of St. Louis; https://fred.stlouisfed.org/series/PPIACO, January 10, 2024. 

    Smith, Aaron. “Real and Nominal Corn Futures Prices.Southern Ag Today 4(3.1). January 15, 2024. Permalink