Author: Aaron Smith

  • Trading Ranges and Volatility for November Soybean and December Corn Futures Prices

    Trading Ranges and Volatility for November Soybean and December Corn Futures Prices

    The 2021 and 2022 corn and soybean harvest futures prices for November and December had increased trading ranges (Figures 1 and 2). November 2022 soybean futures, from November 1, 2021, to contract expiration, had a trading range of $3.81 ($12.02 to $15.81; Figure 1). December 2022 corn futures, from December 1, 2021, to contract expiration, had a trading range of $2.23 ($5.43 to $7.66; Figure 2). Tight U.S. stocks, the Russia-Ukraine conflict, global inflation, supply chain disruptions, and drought in the U.S. and South America have propelled prices higher but have also increased volatility. In 2021 and 2022, the November soybean contract had 45 and 74 trading days, respectively, with a 20-cent up or down move. For the previous five years, the November soybean contract had a total of 64 days with a 20-cent up or down move. Similarly, the 2021 and 2022 December contracts had 49 and 65 trading days, respectively, with moves of 10 cents up or down. The previous five years had a total of 54 trading days with a 10-cent move.

    Figure 1. November Soybean Futures Contract Price from November 1 to Expiration, 2010-2023*

    Data Source: Barchart
    * November 1, 2022, to January 19, 2023
    Data Source: Barchart
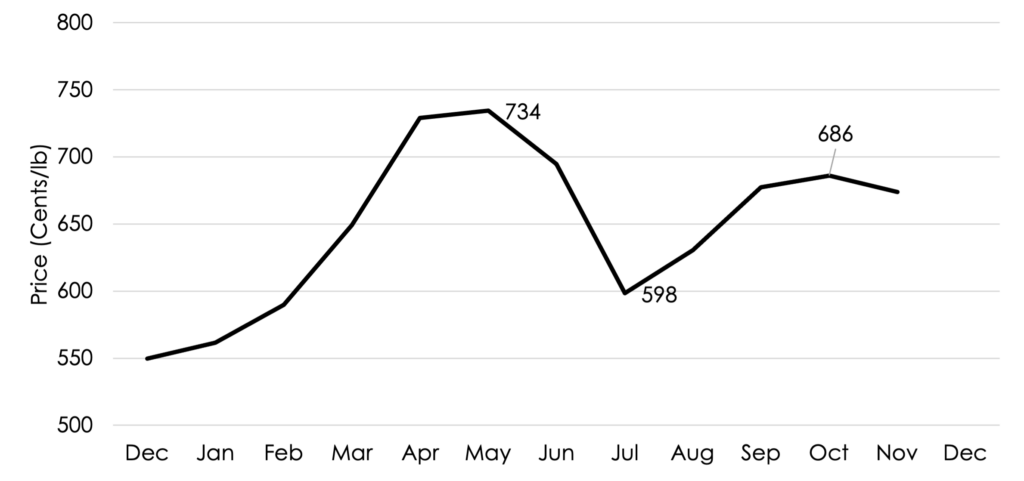
    * December 1, 2022, to January 19, 2023

    What will 2023 bring for soybean and corn futures prices and how should this affect producers marketing and risk management decisions? As of January 19, the 2023 average daily closing futures prices for corn and soybean harvest contracts were near the top of the 2010-2022 price range – November soybeans averaged $13.89 and December corn averaged $5.98. As such, it would be reasonable to think that prices have more downside risk than upside potential, but this will be largely determined by weather. Additionally, there remains a tremendous amount of uncertainty in the global economy, geopolitics, and U.S. and global production for the 2023 crop year. It is likely that volatility will continue in corn and soybean futures markets. 

    What should producers do? Protecting against downside risk seems logical given current market conditions. This can be accomplished using numerous marketing tools (futures, contracts, options, etc.). Put options provide an opportunity to establish a futures price floor. There are several strategies that producers can consider – at-the-money put options, out-of-the money put options, or a combination of put and call options to reduce premium expense. Each producer will have different risk tolerances, so there is no one size fits all approach. The key is to evaluate strategies and choose the one that makes the most sense for your individual circumstances. A simple example of an out-of-the money put option strategy (current December corn futures are trading at $6.00) is:

    Buy a $5.50 December Put Option for 27 cents setting a $5.23 futures floor. This removes 87% ($5.23/$6.00) of the futures price risk, while leaving the upside open and the flexibility to set basis at a later date.

    For producers interested in learning more about using futures and options to manage risk in grain and oilseed markets, the CME group has a self-study guide that explains several strategies.  The current uncertainty and volatility in corn and soybean futures markets necessitates downside price protection. Producers should evaluate strategies that can remove price risk for the 2023 crop. 

    References

    Barchart.com. December Corn and November Soybean Historical Daily Closing Prices. Accessed at: https://www.barchart.com/futures/quotes/ZCZ23/historical-download and https://www.barchart.com/futures/quotes/ZSX23/historical-download

    CME Group. 2019. Self-Study Guide to Hedging with Grain and Oilseed Futures and Options Accessed at: https://www.cmegroup.com/trading/agricultural/files/pm255_self-study-guide_hedging_en_2019.pdf

    Author: S. Aaron Smith

    Associate Professor and Extension Economist

    University of Tennessee Institute of Agriculture


    Smith, Aaron. “Trading Ranges and Volatility for November Soybean and December Corn Futures Prices.” Southern Ag Today 3(4.1). January 23, 2023. Permalink

  • Quantifying U.S. Corn Exports to Mexico

    Quantifying U.S. Corn Exports to Mexico

    There has been a lot of recent concern regarding Mexico potentially banning genetically modified (GM) corn. The crux of the issue started in December 2020 when Mexico’s president, Andrés Manuel López Obrador, issued a presidential decree calling for GM corn for human consumption to be phased out by the end of January 2024. Details of this decree and how it would be implemented are scarce. The United States has also engaged in negotiations with Mexico on this issue.  The purpose of this article is not to debate the merit, or lack of merit, in Mexico’s decree to ban GM corn, it is to quantify the potential amount of corn trade that could be affected.

    Mexico’s position revolves around the protection of native heirloom varieties and banning GM corn for human consumption.  The Mexican President’s position on GM corn used for animal feed and industrial use has softened recently however, the phrase “destined for human consumption” is opaque and subject to interpretation. Any potential ban is destined to have a two-pronged result. First, Mexico would pay more to secure the displaced U.S. corn (whether the replacement is U.S. non-GM or procured from another country), and second, U.S. corn would have to find an alternative market. 

    From 2009-2022, Mexico consumed an average of 12.5 million metric tons (MMT) of corn more than it produced (Figure 1). During this time interval, 94% of the corn imported to make up the deficit came from the U.S. (Figure 2). For the 2022-2023 marketing year, Mexico is projected to import 17.2 MMT of corn. Trade data can be examined by Harmonized System (HS) code. HS code is a standardized numerical method of classifying traded products. Table 1shows the value of U.S. corn exports to Mexico by HS code. Over 90% of corn exports to Mexico are Number 2 Yellow Corn. Available data did not provide an indication of intended use (food, feed, industrial etc.) for U.S. origin corn.

    Annually, the U.S. exports approximately 15% of total corn production. The top five export markets for U.S. corn over the past five years have been Mexico, Japan, China, Columbia, and South Korea. U.S. corn exports to Mexico represented 25% of all corn exports from 2009-2022. If access to Mexico’s market is restricted, then corn exporters would have to rely on alternative export markets or absorb the production domestically. Holding other factors constant, restriction of U.S. corn exports to Mexico would adversely affect domestic corn prices in the U.S.  Producers, Corn Growers Associations, and other stakeholders are rightfully concerned over attempts to restrict market access for U.S. corn exported to Mexico. The impact of any potential loss of access to Mexico’s corn market will be contingent on the details of the proposed restrictions. 

    Figure 1. Mexico Corn Production, Imports, and Consumption, 2009-2022

    Data Source: USDA-PSD

    Figure 2. Corn Exports to Mexico, 2009-2022

    Data Source: USDA-PSD and USDA-GATS 

    Table 1. Value of U.S. Corn Exports to Mexico by HS code, 2021 and 2022 (Jan-Oct) 

     HS CodeDescription2021% of Total2022% of Total
    1005902030Yellow Dent Corn (maize), U. S. No. 2, Except Seed4,350,527,44691.3%3,840,293,29992.4%
    1005902035Yellow Dent Corn (maize), U. S. No. 3, Except Seed25,919,3950.5%58,556,4961.4%
    1005902020Yellow Dent Corn (maize), U. S. No. 1, Except Seed37,924,0900.8%26,834,6230.6%
    1005904049Popcorn, Unpopped, Except Seed, Others32,252,0310.7%31,747,5990.8%
    1005904065Corn (maize), Except Seed, Yellow Dent Corn, Popcorn, Or White Corn, Others42,646,3640.9%24,584,5050.6%
    1005100010Yellow Corn (maize), Seed27,033,2250.6%18,781,4620.5%
    1005904055Corn (maize), White, Others229,351,3854.8%146,595,2033.5%
    1005100090Corn Other5,089,8310.1%3,375,8910.1%
    1005902070Yellow Dent Corn (maize), Except Seed, Others3,411,8390.1%2,732,2170.1%
    1005902045Corn (maize), Other Than Seed Corn9,543,7610.2%2,450,5650.1%
      $4,763,699,367 $4,155,951,860 
    Data Source: USDA GATS

    References and Resources

    International Trade Administration. Understanding Harmonized System Codes. https://www.trade.gov/harmonized-system-hs-codes#:~:text=The%20Harmonized%20System%20is%20a,International%20Trade%20Administration

    U.S. Department of Agriculture – Foreign Agricultural Service (USDA-FAS). Global Agricultural Trade System. Available on-line at: https://apps.fas.usda.gov/GATS/default.aspx

    U.S. Department of Agriculture – Foreign Agricultural Service (USDA-FAS). Production, Supply, and Distribution. Available on-line at: https://apps.fas.usda.gov/psdonline/app/index.html#/app/home


    Author: Aaron SmithAssociate

    Professor, Crop Marketing Specialist

    aaron.smith@utk.edu


    Smith, Aaron. “Quantifying U.S. Corn Exports to Mexico.” Southern Ag Today 2(53.1). December 26, 2022. Permalink

  • Corn Exports: Quality, Value, and Prices

    Corn Exports: Quality, Value, and Prices

    U.S. corn exports are important in determining farm level prices. For the 2022/2023 marketing year, the November USDA World Agricultural Supply and Demand Estimates (WASDE) report estimates 15.4% (2.15 billion bushels) of U.S. corn production will be exported to foreign markets. This does not include the export of corn products, such as ethanol and DDGS. 

    Figure 1. U.S. corn exports (quantity, value, and price) and USDA – National Agricultural Statistics Service (NASS) average monthly price, 5-year average, 2021, and 2022.

    Exports fluctuate month-to-month, with the majority of U.S. corn exports occurring January through July (Figure 1). In calendar year 2022, the quantity of U.S. corn exports has lagged behind last year’s pace – 2.038 billion bushels compared to 2.363 billion bushels in 2021 as of the end of October (Figure 1; Export Quantity). However, in terms of value, the U.S. has exported $400 million more in 2022 ($16.53 billion), than 2021 ($16.11 billion) (Figure 1; Export Value). 

    Price is the reason for the difference between lower quantity and greater value. USDA export sales do not report prices, but a monthly export price can be calculated by dividing value by quantity (Figure 1; Calculated Export Price). The calculated export price needs to be interpreted cautiously as this price does not represent prices established only in the month reported (prices can be established months in advance of exports). That being said, the calculated export price does provide a point of reference for comparison to other prices. 

    Table 1 shows the calculated export price (Figure 1; Calculated Export Price) minus the USDA NASS national estimated cash farm price (Figure 1; NASS Price).  From 2017 to 2020, the difference between the calculated export price and the NASS price ranged from a low of $0.80 to a high of $1.21 per bushel. In 2021 and 2022, the range of the price difference was $1.02 to $1.81 per bushel, $0.41 per bushel greater than the four prior year’s average. The price difference can be interpreted as a rough approximation of the costs associated with moving corn from the farm gate to the export terminal. 

    What is the reason for this increase in the price difference? The most likely factor is increased transportation costs. This is due to supply chain disruptions coming out of the pandemic, elevated fuel costs, and higher wage rates. While the price difference has increased the past two years, the NASS estimated price has accounted for a greater portion of the calculated export price: 80.5% in 2021 and 2022 compared to 77.5% from 2017-2020. So, even with a wider differential between cash farm prices and export prices, the farmer is receiving a greater proportion of the export value. Whether the increased price difference between calculated export price and NASS price, or the proportion allocation holds into the future is highly uncertain.  

    Table 1. Calculated monthly corn export price minus USDA NASS price ($/bu), 2017-2022

     JanFebMarAprMayJunJulAugSepOctNovDec
    20171.021.000.951.030.941.000.921.090.991.061.091.12
    20181.050.940.940.930.961.111.151.201.101.101.141.07
    20191.051.031.011.100.960.860.830.900.960.800.990.96
    20200.890.921.061.121.111.121.001.080.960.991.121.21
    20211.661.611.551.401.151.421.491.031.641.811.591.62
    20221.441.331.191.241.561.341.321.281.021.70  
    5-Year Average1.231.241.261.251.201.201.130.940.951.201.291.31

    References and Resources:

    U.S. Department of Agriculture – Foreign Agricultural Service (USDA-FAS). Global Agricultural Trade System (GATS). Available on-line at: https://apps.fas.usda.gov/GATS/Default.aspx

    U.S. Department of Agriculture – National Agricultural Statistics Service (USDA-NASS). November. Available on-line at: https://quickstats.nass.usda.gov/  

    U.S. Department of Agriculture – World Agricultural Supply and Demand Estimates (USDA-WASDE). November. Available on-line at: https://www.usda.gov/oce/commodity/wasde

    Author: Aaron Smith

    Associate Professor and Crop Marketing Specialist

    aaron.smith@utk.edu


    Smith, Aaron. “Corn Exports: Quality, Value, and Prices.” Southern Ag Today 2(51.1). December 12, 2022. Permalink

  • What Does Trendline Yield Tell Us About How Corn Futures Prices React During and After the Production Year?

    What Does Trendline Yield Tell Us About How Corn Futures Prices React During and After the Production Year?

    Producers face the challenge of when to sell or manage price risk during the growing season. Each growing season is different, but part of marketing and risk management is examining past data to improve the likelihood of making a decision that will increase the selling price received. Prices react to numerous factors. This article examines corn futures prices for years with above and below trendline national average yields. From 1980 to 2021, trendline yields have increased nearly two bushels per acre per year (Figure 1). In recent years, corn trendline yields have flattened, increasing less than one bushel per acre per year from 2013 to 2022. In general, actual national average yields above trendline indicate a mostly agreeable production year whereas below trendline yields indicate more widespread production challenges.  

    Figure 1. NASS Estimated National Average Corn Yield and Linear National Trendline Yield, 1980-2022.

    Data Source: USDA NASS

    What does trendline yield tell us about how corn futures prices react during and after the production year? Using the 1980-2021 trendline from 2010 to 2021, in years with annual estimated yields above trendline yields, December futures prices, on average, peak in May and June and decrease to a harvest low in September (Figure 2). In years with below trendline yields, the December futures price, on average, establishes a low in May / June before peaking in October (Figure 2). This time period coincides with when new crop production estimates, such as the USDA WASDE in May, are released. New crop estimates contribute to movements in the futures market as information is revealed and estimates are refined. Intuitively price movements in Figure 2 makes sense—lower yields contribute to prices increasing and higher yields contribute to declines in prices (all else being equal). Based on Figure 2, prices tend to break higher or lower in June / July, this is due to a greater likelihood of knowing whether the production year (or yield) has been mostly beneficial or has presented challenges to corn producers in the United States.  

    Figure 2. Monthly Average Daily Closing Price for the December Futures Contract in Years with Above and Below Trendline Yields, 2010-2021 

    *Below trendline years included 2010, 2011, 2012, 2013, 2019, and 2020. Above trend line yields occurred in 2014, 2015, 2016, 2017, 2018, 2021.
    Data Source: Barchart

    Moving outside of the preharvest through harvest interval, from 2010-2021, average March futures prices moved the same direction regardless of whether national average estimated yields were above or below trendline (Figure 3). On average, futures prices increased monthly from December through March. Years with below trendline yields had greater increases from December to March than years with above trendline yield.  

    As mentioned above, all years are unique in the challenges that producers and markets face. So, how has 2022 compared to averages? Currently, USDA projects 2022 national average corn yield at 5.8 bushels per acre below the 1980-2021 trendline yield of 178.1 bushels per acre (2.4 bushels per acre below the 2013-2021 trendline). In 2022, monthly average closing prices for the December contract peaked in May, established a low in July before rebounding in the Fall (Figure 4). The spike in May can be partially attributed to the challenging start to the 2022 production year when national average planting progress was two to three weeks behind normal levels. The slow start to the corn production season combined with persistent drought later in the summer caused prices to rebound in the Fall. There are two key takeaways from this basic analysis: 1) producers need to be aware of factors affecting national yield (production) estimates and incorporate it in to price risk management decisions; and 2) while each year is unique, examining price trends for years with comparable yields can help inform producers’ decisions in corn futures markets. 

    Figure 3. Average Monthly Futures price for the March Contract from December to March following a production year with above or below trendline yield, 2010-2021 crop years


    *Below trendline years included 2010, 2011, 2012, 2013, 2019, and 2020. Above trend line yields occurred in 2014, 2015, 2016, 2017, 2018, 2021.
    Data Source: Barchart

    Figure 4. Monthly Average Daily Closing Price for the December Futures Contract, 2022


    Data Source: Barchart

    References and Resources:

    Barchart.com. December and March Corn Historical Daily Closing Prices. Accessed at: https://www.barchart.com/futures/quotes/ZCH23/historical-download

    U.S. Department of Agriculture – National Agricultural Statistics Service (USDA-NASS). Quick Stats. Available on-line at: https://quickstats.nass.usda.gov/  

    Aaron Smith

    Associate Professor, Crop Marketing Specialist

    aaron.smith@utk.edu


    Smith, Aaron. “What Does Trendline Yield Tell Us About How Corn Futures Prices React During and After the Production Year?Southern Ag Today 2(48.1). November 21, 2022. Permalink

  • Fences Aren’t Just for Cattle

    Fences Aren’t Just for Cattle

    While the 2022 harvest season is not complete, it is a good time for producers to consider price risk management strategies for the 2023 crop. Agricultural commodities have a tremendous amount of uncertainty due to global and U.S. economic weakness, elevated input prices, weather, competition from South America, exchange rates, interest rates, and inflation.  With uncertainty comes greater price volatility, which is expected to continue in 2023. Additionally, many producers will be making input purchase decisions before the year’s end. With high input prices continuing into 2023, producers should consider establishing a price (or price range) for their crop when inputs are purchased. High input costs and uncertain commodity prices necessitate producers prioritizing price risk management. 

    Figure 1. Example of two December corn options fence strategies that are premium neutral

    For producers wanting to establish a price range in the futures market, consideration should be afforded to options fence strategies. In other words, how much upside potential are you willing to sacrifice to secure a minimum price? An options fence sets a minimum futures price and maximum futures price. To execute an options fence, a producer buys a put option with a strike price below the targeted futures price, sells a call option with a strike price above the targeted futures price, and maintains the option positions until the cash commodity is sold. For example, consider the following two option fence strategies (for reference, on October 20, December 2023 corn was trading at $6.24):

    Strategy #1: A producer buys a $5.60 put option for $0.30 and sells a $7.20 call option for $0.30 (Figure 1). The producer has “fenced” in a price between $5.60 and $7.20 using options in the futures market, or simply stated the producer will not receive a futures market price below $5.30 or above $7.20, assuming execution of the options contracts and sale of the cash commodity.

    Strategy #2: A producer buys a $6.00 put option for $0.50, sells a $6.50 call option for $0.50 (Figure 1). The producer has “fenced” in a price between $6.00 and $6.50 using options in the futures market, or simply stated will not receive a futures market price below $6.00 or above $6.50, assuming execution of the options contract and sale of the cash commodity.

    Similar to a short hedge, when using an option fence, it is imperative to have offsetting transactions in the cash market. If the December futures market price is above the call option, strike price money is made in the cash market at the same rate as the losses in the futures market (without accounting for basis). Similarly, if the December futures contract is below the put option strike price, losses in the cash market are offset by gains in the put option position. Thus, the net return to the producer remains between the put option strike price and the call option strike price (assuming no changes in basis). 

    Option fences can be set in a narrow (Strategy #2) or expanded range (Strategy #1), depending on the producer’s risk tolerance and the strike prices selected. An options fence is one of many strategies that can assist producers in managing their price risk. Obtaining professional advice to weigh risks and rewards when utilizing futures or options strategies is strongly recommended.

    Important considerations:

    • Fences do not need to be premium neutral.
    • Selling options require margin, so liquidity or access to credit is essential.
    • Options strategies do not protect against basis movements, this can be a positive or negative depending on your location and production season.
    • Premium neutral strategies carry transaction fees and finance charges.
    • Formulating reasonable price expectations are key.
    • Fences do not protect against production risk and require an offsetting transaction in the cash market.

    Resources and ReferencesBarchart.com. December 2023 Corn Options Prices. Accessed at: https://www.barchart.com/futures/quotes/ZCZ23/options?moneyness=20