Author: Adam Rabinowitz

  • Surprise!  January WASDE Report Moves Corn and Soybeans Lower – Cotton Flat

    Surprise!  January WASDE Report Moves Corn and Soybeans Lower – Cotton Flat

    On Monday, January 12, 2026, the USDA World Agricultural Supply and Demand Estimates (WASDE) report was released with some unexpected projections.  A record corn crop is even larger than expected, now projected at 17 billion bushels, up 269 million bushels from the prior month.  This is a result of a record yield of 186.5 bushels per acre on a record 91.3 million harvested acres.  While total use was also increased to 16.4 billion bushels, the stocks-to-use ratio is projected to be 13.6%, up from 12.5% a month earlier, and up from 10.3% compared to 2024/25.  

    It’s been well documented in previous Southern Ag Today articles that the stocks-to-use ratio is a good predictor of corn marketing year average prices.  Thus, the increase in the ratio is expected to result in a decrease in price.  In fact, the corn futures market responded with an immediate sharp decline on Monday.  The pre-report price of the March corn futures was $4.474/bu, which by close ended the day down 26 cents at $4.214/bu.  As a result, most of the gains that had accrued in this contract since the low price of $4.122 was projected on August 12, 2025, have since been returned.  The USDA did raise the marketing year price projections for 2025/26 to $4.10, although this is still down 14 cents from the 2024/25 price of $4.24.

    Soybean prices were also affected by the WASDE release, with March soybean futures falling 20.2 cents from a pre-WASDE release price of $10.692/bu to $10.49/bu at close.  This was on news that soybean supply for 2025/26 is 17 million bushels higher than estimated in December.  Yield remained at a record 53 bushels per acre, but harvested acres increased to 80.4 million, resulting in about 9 million bushels of additional production.  Beginning stocks for 2025/26 were also adjusted up about 9 million bushels since the prior month estimates.  On top of supply increases, total use dropped 43 million bushels, driven largely by a 60 million bushel drop in exports due to higher production and competition from Brazil.  The resulting stocks-to-use ratio increased to 8.2% for 2025/26, up from the 6.7% projected in December.  The USDA also adjusted the 2025/26 marketing year average price estimate down 30 cents to $10.20/bu.

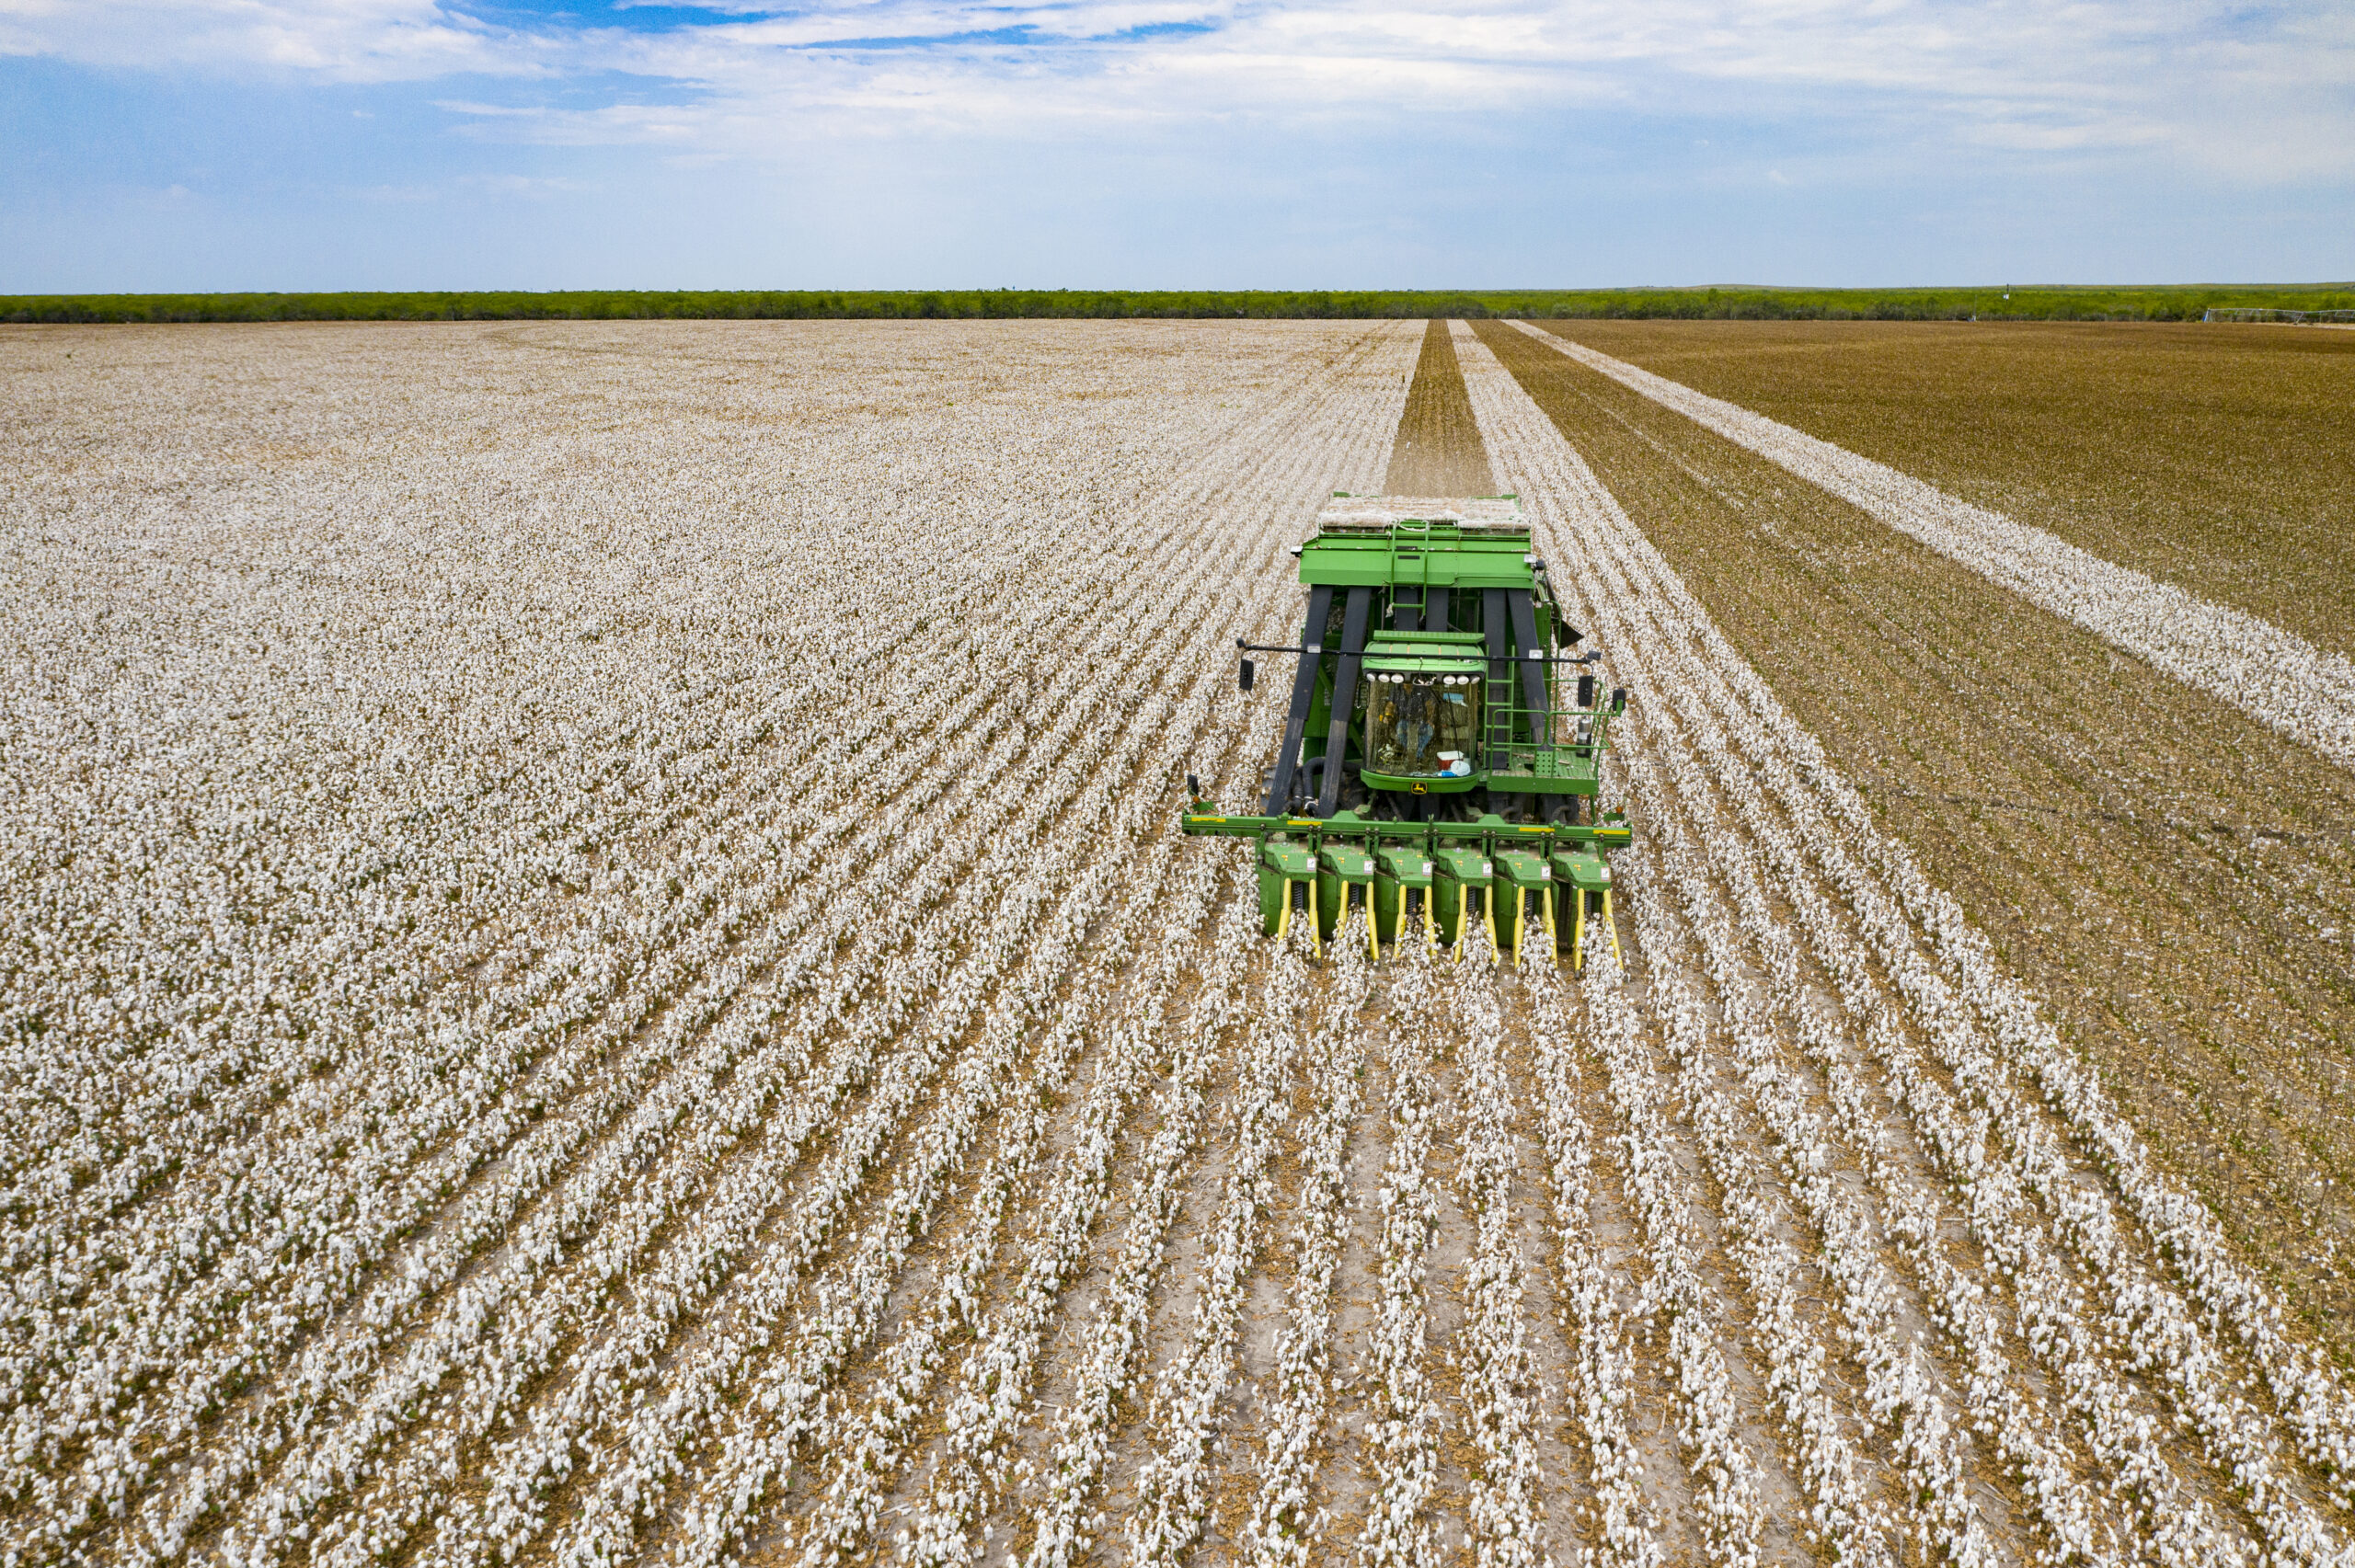
    All was not completely bearish for southern agriculture, though, as Cotton markets remained stable with March futures contracts staying just under $0.65/lb.  The WASDE report showed a lower expected yield of 856 lbs/acre on 7.8 million harvested acres.  This reduced production estimates to 13.92 million bales.  Meanwhile, total use was stable at 13.8 million bales.  The USDA now projects the 2025/26 marketing year average price for upland cotton at $0.61/lb.  The challenge for producers is that this report does not make planting decisions and marketing for 2026 any easier.  With a solid marketing plan, it’s best to avoid reactionary decisions to market movers like this and focus on executing the existing plan (see https://southernagtoday.org/2026/01/07/a-new-year-a-better-marketing-plan-for-the-farm/), which should account for the ups and downs in commodity markets.  


    Rabinowitz, Adam. “Surprise! January WASDE Report Moves Corn and Soybeans Lower – Cotton Flat.Southern Ag Today 6(3.3). January 14, 2026. Permalink

  • Will the 2025 Peanut Crop Set a New Record?

    Will the 2025 Peanut Crop Set a New Record?

    We often look at the World Agricultural Supply and Demand Estimates (WASDE) report for guidance on expected supply, demand, and pricing for commodities.  Rarely, however, does this report mention anything about peanuts.  The last WASDE (September 12, 2025) before the government shutdown was one of those rare exceptions when it included the statement that “Other changes [in oilseeds] this month include higher U.S. peanut production.”  To obtain more details, one needs to look at the monthly Oil Crops Outlook (OCO), which focuses on oil crops and animal fats.  The last OCO on September 16, 2025, reported that peanut production for marketing year 2025-26 was increased to a record-high 7.4 billion pounds, due to an expected higher harvested acreage (mainly in Georgia and Texas) as well as an increase in the average peanut yield.  With the government shutdown, this report has also not been updated, leaving the peanut industry with a month-old forecast during the peak harvest period that indicates a record crop.

    Figure 1 shows U.S. peanut production and uses from 2020/21 to forecasted 2025/26.  Production is forecasted to reach record levels at 7.4 billion pounds, representing a 14.7% increase.  Meanwhile, total use for food, crush, and exports are expected to increase 8.5%, to 7 billion pounds.  The additional production is expected to increase ending stocks by 29.6% to 2 billion pounds, levels similar to the ending stocks in the 2022/23 marketing year. 

    The lack of readily available data further limits information in an already thin market that, unlike other commodities, does not have a futures market to help establish prices.  This leaves producers questioning what the actual production levels will be during the peak of harvest.  One could look at various weather conditions, especially in Georgia, Texas, and Alabama, the three largest peanut acreage states this year.   Dry weather that is prevalent in these areas has the potential to bring down yields or affect quality.  

    Another source of alternative information comes from the Georgia Federal-State Inspection Service, which publishes the National Tonnage Report.  This report contains data provided by buying points throughout the peanut belt on peanut production classified by segmentation. The official report is also affected by the government shutdown, but unofficial tonnage data have been made available.  Since October 1, data have been self-reported only for Arkansas, Georgia, South Carolina, and Texas.  While the total tonnage reported thus far stands at 3.1 billion pounds, it is certainly a data point that has too many caveats to use for pricing decisions.  

    The last source of information is the weekly Crop Progress & Condition report, which has also been affected by the government shutdown.  The last report at the end of September showed harvest ahead of last year and the previous 5-year average. However, at the end of October, harvest over the last 5 years has been, on average, about 70% completed.  Thus, there is still a way to go before we can figure out how big the 2025 peanut crop may be. In the meantime, the lack of official USDA reports is leaving producers with limited guidance.

    Source:

    Bukowski, M., & Swearingen, B. (2025). Oil crops outlook: September 2025 (Report No. OCS-25i). U.S. Department of Agriculture, Economic Research Service

    Crop Progress & Condition. U.S. Department of Agriculture, National Agricultural Statistics Service. 

    World Agricultural Supply and Demand Estimates. U.S. Department of Agriculture, September 12, 2025.

    Rabinowitz, Adam. “Will the 2025 Peanut Crop Set a New Record?” Southern Ag Today 5(44.3). October 29, 2025. Permalink

  • March WASDE Estimates and Note on Inclusion of Trade Policy

    March WASDE Estimates and Note on Inclusion of Trade Policy

    USDA released the latest World Agricultural Supply and Demand Estimates (WASDE) report on March 11, 2025.  The most significant item presented was a clarifying “note” at the beginning of the report that is important for users of USDA WASDE estimates to understand.

    “The WASDE report only considers trade policies that are in effect at the time of publication.  Further, unless a formal end date is specified, the report also assumes that these policies remain in place.”

    In other words, the effects of tariffs that are to be implemented in the future, even if already announced, are not included in the report estimates.  This includes the Canada and Mexico tariffs that have been suspended until April 2.  Alternatively, retaliatory tariffs from Canada, along with U.S. tariffs on China and China’s retaliatory tariffs are all currently in effect and are reflected in the current WASDE estimates as if they will continue indefinitely into the future.  Users of these estimates need to consider this factor in their interpretation.  

    The effects of trade policy on markets are particularly important given the large percentage of exports that are reflected in crops contained in the WASDE report.  Table 1 shows the March 2025 WASDE estimates of supply, use, stocks, and prices of four major row crops produced throughout the southern region.  Total exports are reported, along with calculated exports as a percentage of total use.  Corn has the smallest estimated exports as a percentage of total use at 16%, followed by wheat and soybeans at 42% and cotton at 87%.  Thus, when and if tariffs are implemented, the USDA estimates have the potential to change with the inclusion of trade impacts in the WASDE report.  

    Beyond this note, there was very little movement in current estimates.  The average price of wheat at $5.50 per bushel is 5 cents lower than a month ago, continuing a downward trend.    Ending stocks of wheat increased to 819 million bushels.  For U.S. corn, the USDA is projecting no change in ending stocks from the prior month, staying at 1,540 million bushels and maintaining a $4.35 per bushel marketing year average price for 2024/25.  Soybeans were also stable at the prior month’s estimates; however, the USDA revised the marketing year average price down 15 cents to $9.95 per bushel.  Meanwhile, the balance sheet for cotton remained unchanged from last month, while the marketing year average price was adjusted down a half cent to 63 cents per pound.  The next potential market mover from the USDA comes at the end of the month with the release of the Prospective Plantings report.

    Table 1. 2024/25 Wheat, Corn, Soybean, and Cotton Supply, Use, Stocks, and Price Estimates, March 2025 WASDE

     WheatCornSoybeanCotton
     Production and Supply
    Planted (Million Acres)46.190.687.111.18
    Harvested (Million Acres)38.582.986.18.27
    Yield (Bushels/Pounds)51.2179.350.7836
    Production (Million Bushels/Bales)1,97114,8674,36614.41
    Total Supply (Million Bushels/Bales)2,80816,6554,72917.57
     US Exports and Use
    Exports (Million Bushels/Bales)8352,4501,82511.00
    Total Use (Million Bushels/Bales)1,98915,1154,34912.70
    Exports % of Total Use42%16%42%87%
     Stocks and Price
    U.S. Ending Stocks (Million Bushels/Bales)8191,5403804.9
    U.S. Stocks/Use41%10%9%39%
    U.S. Avg. Farm Price ($/Bushel or Pound)$5.50$4.35$9.95$0.63

    Data Source: USDA March 2025 WASDE


    Rabinowitz, Adam. “March WASDE Estimates and Note on Inclusion of Trade Policy.Southern Ag Today 5(11.3). March 12, 2025. Permalink

  • Using 2025 Cost of Production Forecasts to Assist in Marketing Row Crops

    Using 2025 Cost of Production Forecasts to Assist in Marketing Row Crops

    Knowing the expected cost of production for a farmer is essential for developing effective risk management and marketing strategies.  At an aggregate level, forecasts of costs provided by the USDA Economic Research Service (ERS) can offer a useful benchmark to help understand the gross revenue and cost of production for commodities at the national or regional level.  These forecasts can be used to determine breakeven prices to inform a risk management and marketing plan.

    The ERS’s 2025 national cost of production forecast for major southern row crops (cotton, peanuts, corn, and soybeans) indicates a decline in fertilizer and interest costs, contributing to lower total operating cost for most crops compared to 2024, except cotton. However, rising custom rates, other variable expenses, and allocated overhead costs offset some of these savings, resulting in an expected total cost of production that is effectively the same (within +/- 1%) as the estimated 2024 cost of production.  As shown in Figure 1, peanuts has the highest forecasted total cost per acre ($1,181.84), followed by cotton ($899.96), corn ($871.09), and soybeans ($624.77), highlighting the significant investment in producing southern row crops. It is important to note that these forecasts were released by the ERS in November of 2024, before tariff threats were made, that if implemented may increase costs of some agricultural inputs, notably fertilizer.

    At the currently forecasted cost of production, the negative returns experienced by row crop producers in 2024 are expected to remain a major concern for all four crops in 2025 if prices do not improve. Figure 1 shows the 2024/25 marketing year estimated gross revenue for each crop based on estimated yields and prices as of January 2025.  The gap between the two bars on each graph illustrates the potential shortfall in revenue needed to cover 2025 production costs if yields and prices are maintained at current 2024/25 marketing year levels.

    Whether yields can provide increased revenue is a question for the future, but given national corn yields in 2024/25 being estimated at record levels and soybean yields being estimated at about 2% below record levels, it is more likely that price is going to be the primary driver to increase revenue for these crops. Meanwhile, multiple weather events made a major impact on cotton yields that were about 12% below record levels and peanut yields that were about 11% below record levels.  Therefore, some of the shortfall in revenue for cotton and peanuts could come from higher yields.

    The other component of the revenue equation is price.  Determining a breakeven price assists in making informed decisions about the price necessary to cover production costs.  To determine a breakeven price, divide the forecasted cost of production by expected yield.  To help adjust for record yields or significant shortfalls, Table 1 shows the five-year average yield for each crop along with the computed breakeven price. At the current national forecasted cost of production and average yield for the last five years, the breakeven price for corn and peanuts would have to increase 17% over the estimated 2024/25 price.  For soybeans, the price would have to increase 21%, while cotton prices would have to rise 59%.  

    Ultimately, the actual cost of production varies among individual farms, as it depends on many factors such as economies of size and scope, relationships with input suppliers, and adopted management practices. Actual yields also vary, and thus, producers need to consider their own potential breakeven price. Repeating this exercise for a specific farm can be helpful in planning, making risk management and marketing decisions, and finding potential opportunities to make efficiency improvements to reduce costs for the upcoming crop year. 

  • Land Ownership and the Preservation of Family Farm Legacies 

    Land Ownership and the Preservation of Family Farm Legacies 

    The preservation of land for future generations and the creation of family legacies is an important part of the U.S. agricultural heritage.  Unfortunately, many families are left vulnerable to losing their land or face complicated management decisions.  This occurs because the land is passed down from one generation to the next without an appropriate transition plan or without a properly probated will.  

    Two recent Southern Ag Today articles (referenced below) focused on estate and transition planning, both illustrating the importance of the process of organizing and arranging the transfer of one’s assets, including real estate, to heirs in a structured and legally recognized manner. It typically involves creating a will or trust, designating beneficiaries, and addressing issues like taxes and debts. It is a crucial aspect of risk management that can keep land in the family.  Land ownership where property is passed down without clear legal documentation and is shared among all the heirs is known as heirs property.  

    Heirs property can limit land management and complicate access to some federal programs. Each heir has an equal right to full use and possession and is legally responsible for taxes and other property-related expenses and activities.  As land is passed down to future generations, and the number of heirs increases, it becomes more fractionated with each person’s percentage interest in the land decreasing.  Furthermore, heirs property becomes vulnerable to loss through issues such as partition sales, tax sales, or adverse possession.  Maintenance of the land and the ability to manage the use of the lands resources is also limited and can result in conflict and disputes amongst the heirs.  

    While heirs property is a significant issue, there are means to resolution and preventing the future creation of heirs property.  This starts with a will or appropriate estate or transition plan.  According to a Gallup Poll in 2020, only 46% of U.S. adults have a will.  Almost a quarter of adults 65 years and older are also without a will.  While we do not have these data for agricultural producers, the USDA Census of Agriculture does report the number of producers who are engaged in some form of estate and transition planning.  Table 1 reports the percentage of producers in the 13-state southern region that reported being engaged in estate or transition planning in the 2017 and 2022 Census of Agriculture.  In 2017, this percentage ranged from a low of 49% in Louisiana to a high of 62% in Oklahoma.  These numbers fell in 2022 in all states, with Louisiana remaining the smallest percentage at 44% and Oklahoma, while still the highest, dropped to 56%.  This illustrates the significant gap that exists in agricultural estate planning, leading to increased risk of creating heirs property for future generations. 

     There are various reasons why individuals do not engage in proper estate planning.  Sometimes they feel they do not have enough assets, the process is too expensive, or the process is too complicated.  Another reason is that some people are simply holding off because the conversation is uncomfortable and morbid. However, the best prevention for heirs property is education, choosing the right attorney, and formalizing a transition plan. A well-crafted estate plan can prevent a property from becoming heirs property by ensuring that a clear title is passed down to future generations.  More information on the resolution and prevention of heirs property can be found in the Heirs Property in Alabama publication. 

    Table 1: Percentage of Agricultural Producers Engaged in Estate or Transition Planning 

    State20172022Percentage 
    Change
    OK62%56%-6%
    AR57%53%-4%
    TX58%53%-5%
    VA56%53%-3%
    AL56%52%-4%
    GA55%52%-3%
    MS55%51%-4%
    SC56%51%-4%
    TN55%51%-4%
    KY55%50%-5%
    NC54%50%-4%
    FL51%48%-3%
    LA49%44%-5%
    Source: Author Calculations based on 2022 USDA Census of Agriculture 

    References:

    Gallup. “How Many Americans Have a Will?” The Short Answer. June 23, 2021.

    Graff, Natalie. “Government Incentives for Agricultural Generational Transfer?” Southern Ag Today 4(25.4). June 20, 2024.

    Johnson, Portia, Ryan Thomson, Adam Rabinowitz, and Katie Keown. “Heirs Property in Alabama.” Alabama Cooperative Extension System HE-0852. Revised July 2024.

    Martinez, Charley, and Kevin Ferguson. “Estate Transition Planning.” Southern Ag Today 4(27.3). July 3, 2024.


    Rabinowitz, Adam, Justin Anderson, and Jamie Mardis. “Land Ownership and the Preservation of Family Farm Legacies.Southern Ag Today 4(35.5). August 30, 2024. Permalink