Author: Andrew Muhammad

  • Trade War Fallout: The Collapse of U.S. Spirit Exports to Canada in 2025

    Trade War Fallout: The Collapse of U.S. Spirit Exports to Canada in 2025

    In 2025, U.S. spirit exports to Canada collapsed as a direct consequence of escalating trade tensions, marking one of the sharpest declines in cross-border alcohol trade in recent history. Prior to 2025, Canada accounted for about 11% of U.S. distilled spirit exports. Between 2022 and 2024, Canadian imports exceeded $250 million annually, making Canada the second-largest market for American whiskey, bourbon, rum, and other distilled spirits (USDA, 2025). In March 2025, Canada effectively halted imports and sales of U.S. wine and spirits in retaliation for tariffs imposed by President Trump on Canadian goods. Provincial liquor boards removed American products from shelves, triggering a dramatic plunge in U.S. spirit exports (DISCUS, 2025). Canada also imposed a 25% retaliatory tariff on U.S. distilled spirits and other products in March 2025, which was lifted in September (Government of Canada, 2025). However, the impact far exceeded what would be expected from a 25% tariff alone, underscoring the severity of the trade dispute.

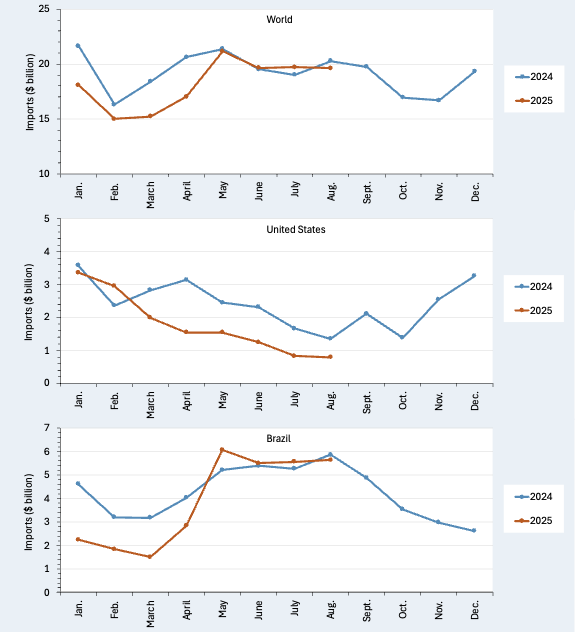
    Figure 1 shows monthly U.S. spirit exports to Canada (in million proof liters), comparing the 2022–2024 three-year average with 2025. The data show a sharp and sustained decline in 2025 relative to historical levels. From 2022 to 2024, monthly exports typically ranged between 1.2 and 2.3 million proof liters, peaking during summer months. In stark contrast, exports in 2025 fell dramatically after February, dropping from 1.4 million proof liters in February to just 0.2 million in April, and averaging less than 0.4 million proof liters per month for the remainder of the year. Overall, 2025 marks an unprecedented contraction in Canadian spirit imports from the United States. In terms of value, U.S. spirit exports to Canada averaged over $160 million between March and September in years prior. However, exports in 2025 during the same period were only $35 million (USDA, 2025). Comparing March through September, American distilled spirit sales to Canada were down approximately almost 80% compared to the prior three-year average, underscoring the severe impact of trade restrictions.

    Such a steep decline signals fundamental shifts in cross-border alcohol trade that may not be reversed by tariff removal alone. The restrictions on U.S. spirits were not merely retaliatory; they appear to have stimulated domestic production and potentially redirected Canadian consumers toward local and alternative sources. The long-term effects remain uncertain. However, it is noteworthy that imports of oak casks and barrels—essential for aging spirits—rose by 6% during this period (USDA, 2025), suggesting increased investment in Canadian distilling capacity.

    Figure 1. U.S. spirit exports to Canada: 2022-2024 and 2025

    Source: Global Agricultural Trade System (USDA, 2025). 

    References

    Distilled Spirits Council of the United States (DISCUS) (2025). Removal of U.S. Spirits from Canadian Stores in Retaliation to U.S. Trade Dispute Resulted in Sharp Sales Decline of U.S. Products, Canadian Products and Total Spirits Saleshttps://distilledspirits.org/news/spirits-canada-analysis-removal-of-u-s-spirits-from-canadian-stores-in-retaliation-to-u-s-trade-dispute-resulted-in-sharp-sales-decline-of-u-s-products-and-total-spirits-sales/

    Government of Canada (2025). https://www.canada.ca/en/department-finance/programs/international-trade-finance-policy/canadas-response-us-tariffs.html

    U.S. Department of Agriculture (2025). Global Agricultural Trade System. https://apps.fas.usda.gov/gats/default.aspx


    Muhammad, Andrew. “Trade War Fallout: The Collapse of U.S. Spirit Exports to Canada in 2025.” Southern Ag Today 5(51.4). December 18, 2025. Permalink

  • Recent Trade Tensions Cause U.S. Beef to Lose Ground in China, Spurs Gains for Australia and Brazil

    Recent Trade Tensions Cause U.S. Beef to Lose Ground in China, Spurs Gains for Australia and Brazil

    Over the past decade, China has gone from a minor player to the world’s largest beef importer, with purchases rising from around a $100 million in 2010 to nearly $18 billion in 2022, which is a staggering increase of over 17,000%. This surge isn’t just about spending more. The actual volume of beef purchased has grown by more than 8,000%, driven by rising incomes, urban lifestyles, and shifting diets that favor beef over traditional staples like pork. The outbreak of African Swine Fever in 2018, which devastated China’s pig population, further accelerated the shift, while government dietary guidelines have promoted beef as a healthier option. Due to rising demand and imports, coupled with lifting the import restriction on U.S. beef in 2017, China is now the third largest foreign market for U.S. beef—around $1.5 billion in 2024. This rise has been highlighted in previous Southern Ag Today articles (For example, see: https://southernagtoday.org/2025/04/17/high-tariffs-could-halt-u-s-beef-exports-to-china/).

    Rising trade tensions between the U.S. and China, which started earlier this year, raised concerns for U.S. beef exporters. Chinese tariffs on American beef soared as high as 145%, making it far more expensive than beef from countries like Brazil and Australia. Although those tariffs were later lowered to around 33%, the decline had already begun. On top of that, China let export approvals expire for nearly 400 U.S. beef processing plants in March, about 60% of all facilities allowed to ship beef to China, effectively blocking a large portion of U.S. supply (Marianetti, 2025). This move, seen as a non-tariff barrier, has created uncertainty, shaking confidence in the reliability of U.S. beef exports.

    In 2025, rising trade tensions quickly took a toll on American beef in China (see Figure 1). From January to September, U.S. beef exports fell sharply—from $814 million in 2024 to $442 million in 2025—a 46% drop driven mostly by lower volumes. The decline was even steeper in the second and third quarters, after China let key export approvals expire, with U.S. beef falling nearly 70%. This happened even as China’s overall beef imports grew in value. Meanwhile, Australia and Brazil gained ground: Australia’s exports to China rose 42%, and Brazil’s increased nearly 25%. In 2024, the U.S. held about 9% of China’s beef import market, compared to Brazil’s 48% and Australia’s 9%. By the third quarter of 2025, the U.S. share had dropped to less than 1%, while Brazil and Australia accounted for 59% and 13%, respectively. It’s a clear sign that when trade tensions rise, other suppliers are quick to take the lead.

    Figure 1. Chinese Beef Imports: 2024 and 2025 (Year-to-date: January–September) 

    Note: Imports are defined according to the Harmonized System (HS) classification HS 0202 meat of bovine animals, frozen. Frozen beef accounts for over 90% of China’s beef imports.
    Source: Trade Data Monitor®

    References

    Marianetti, J. (2025). USA Dairy Pork and Poultry Registrations Renewed while Beef Remains Overdue (GAIN Report No. CH2025- 0056). Foreign Agricultural Service, Washington, D.C.

    Trade Data Monitor. (2025). https://tradedatamonitor.com/


    Muhammad, Andrew. “Recent Trade Tensions Cause U.S. Beef to Lose Ground in China, Spurs Gains for Australia and Brazil.Southern Ag Today 5(44.4). October 30, 2025. Permalink

  • China’s Agricultural Imports from U.S. and Brazil Decline in 2025 – But the U.S. Faces Sharper Losses

    China’s Agricultural Imports from U.S. and Brazil Decline in 2025 – But the U.S. Faces Sharper Losses

    The decline in U.S. agricultural exports to China has made headlines, most notably due to China’s decision not to purchase U.S. soybeans this season. Soybeans are the largest agricultural export for the United States, and China has traditionally been the top foreign buyer of U.S. soybeans, making this shift particularly significant for American producers. While stories have been mostly about declines in U.S. exports to China, it is important to note that China’s agricultural imports—including related products like forestry, biodiesel, and seafood—are down overall in 2025 compared to 2024, reflecting a broader contraction in trade. 

    Figure 1 shows China’s total agricultural imports from global sources, including the United States and Brazil. Overall, total imports declined in 2025 compared to 2024, with the most significant drop occurring during the first half of the year. For example, imports in January 2025 fell to approximately $18 billion, down from $22 billion in January 2024. A year-to-date comparison (January–August) shows total imports decreased from $157 billion in 2024 to $145 billion in 2025, a reduction of $12.1 billion, or 7.5%. In terms of quantity or volume, the decline was even steeper—nearly 12% (Trade Data Monitor®, 2025), suggesting that lower import values were not solely driven by price changes but also by reduced quantities.

    Although China’s agricultural imports declined overall, imports from the United States experienced a sharper and more sustained drop, beginning later in the year. In January 2025, imports from the U.S. were down by only $220 million compared to the previous year, and in February, they were up by nearly $600 million. However, starting in March, imports consistently fell below 2024 levels. By August, year-to-date China’s imports of U.S. agriculture and related products had dropped from $20 billion in 2024 to $14 billion in 2025, a decline of more than $5 billion, or 27.5%.

    Brazil also experienced a decrease in agricultural export sales to China in 2025, though the decline was less severe than that of the United States. As of August 2025, imports from Brazil fell from $36.7 billion in 2024 to $31.2 billion, representing a 15.0% decrease. Month-to-month comparisons show sharper early-year declines: imports were down 51% in January, 43% in February, and 53% in March compared to the same months in 2024. However, beginning in May 2025, import levels from Brazil became more comparable to the previous year and even exceeded 2024 figures in some months. This mid-year rebound suggests that Brazil is benefiting from seasonal demand as well as favorable trade conditions.

    Figure 1. China’s total agricultural imports from the World, United States, and Brazil: January 2024 – August 2025  

    Note: Agricultural import values include related products like forestry, biodiesel, and seafood.
    Source: Trade Data Monitor® (2025)
     

    Reference

    Trade Data Monitor®. (2025). Retrieved from https://www.tradedatamonitor.com


    Muhammad, Andrew. “China’s Agricultural Imports from U.S. and Brazil Decline in 2025 – But the U.S. Faces Sharper Losses.” Southern Ag Today 5(40.4). October 2, 2025. Permalink

  • Outlook for U.S. Agricultural Trade in 2025: Exploring the Recent August Forecasts 

    Outlook for U.S. Agricultural Trade in 2025: Exploring the Recent August Forecasts 

    The August 2025 Outlook for U.S. Agricultural Trade provides a snapshot of the current challenges and opportunities in global markets (USDA, 2025a). The quarterly report has long been a valuable tool for understanding how international trends affect the U.S. farm economy. In the past, it included both data and written commentary to explain possible causes behind trade shifts. However, the May 2025 report sparked controversy when its release was delayed. The issue centered on explanatory text that linked rising agricultural trade deficits to tariffs (Ingwersen & Douglas, 2025). As a result, the USDA removed the commentary and now publishes only data tables. This change has raised concerns about transparency and the loss of expert interpretation that helped make sense of complex trade dynamics.

    The August report shows that the U.S. will continue to import more agricultural goods than it exports. However, the projected trade deficit for fiscal year (FY) 2025—running from October to September—was revised downward from $49.5 billion in the May report to $47.0 billion. This adjustment was driven by an upward revision in forecasted exports, while the import forecast remained unchanged from May at $220 billion. For FY2025, exports are now expected to reach $173 billion, with imports holding at $220 billion.

    These revisions raise important questions. Are they justified based on the available data? Most notably, is there clear evidence of increased export activity to support the upward revision? And given current trends, should the import forecast have been adjusted as well—either upward or downward? A closer look at recent trade is needed to assess whether these changes reflect actual market conditions or optimism. 

    Year-to-date (October to June) export values are reported in Table 1. The data suggest that the value of agricultural exports will remain relatively flat. During the first three quarters of the fiscal year, export values increased slightly from $135.0 billion in 2024 to $135.7 billion in 2025, which is a modest 0.6% rise. However, the volume of exports grew significantly, increasing from 162.4 million metric tons (MMT) to 175.9 MMT, an 8.3% increase. This growth in quantity was offset by a 7.2% decline in average prices (unit value), which fell from $831/MT to $772/MT, suggesting lower prices per unit across many commodities. Depending on prices, the upward revision in the export forecast could be justified despite current trade tensions (USDA, 2025b). 

    Assuming fourth-quarter imports in FY2025 will follow patterns seen in recent years, available data suggest that total imports could reach $223 billion. This supports the decision to hold the official import forecast steady at $220 billion given the small $3 billion difference (USDA, 2025b). If ongoing trade tensions continue, it would not be surprising if actual imports were lower than $220 billion. 

    Figure 1. U.S. Agricultural Imports: FY2021-FY2025

    Note: FY is the fiscal year (October – September) 
    Source: U.S. Department of Agriculture, Foreign Agricultural Service, Global Agricultural Trade System (GATS) (2025b) 
     

    Table 1. U.S. Agricultural Exports: FY2024 and FY2025 (year-to-date: October – June)

    ExportsOct. – June
    2024
    Oct. – June 2025% Change
    Value ($ billion)$135.0$135.70.6%
    Quantity (MMT)162.4175.98.3%
    Unit Value ($/MT)$831.1$771.5-7.2%
    Note: FY is the fiscal year (October – September) 
    Source: U.S. Department of Agriculture, Foreign Agricultural Service, Global Agricultural Trade System (GATS) (2025b

    Reference

    U.S. Department of Agriculture (USDA). 2025a. Outlook for U.S. Agricultural Trade: August 2025https://www.fas.usda.gov/sites/default/files/2025-08/AES-133.pdf

    U.S. Department of Agriculture (USDA). 2025b. Global Agricultural Trade System (GATS). Foreign Agricultural Service, Washington, D.C. https://apps.fas.usda.gov/GATS/default.aspx

    Ingwersen, Julie and Leah Douglas. 2025. “USDA redaction of trade analysis causes concern about report integrity” Reutershttps://www.reuters.com/world/us/usda-redaction-trade-analysis-causes-concern-about-report-integrity-2025-06-06/


    Muhammad, Andrew. “Outlook for U.S. Agricultural Trade in 2025: Exploring the Recent August Forecasts.Southern Ag Today 5(36.4). September 4, 2025. Permalink

  • U.S. Agriculture Could Face New Challenges with President Trump’s Proposed Tariffs on Japan and South Korea

    U.S. Agriculture Could Face New Challenges with President Trump’s Proposed Tariffs on Japan and South Korea

    According to the most recent data on U.S. and China reciprocal tariffs, as reported by the Peterson Institute for International Economics (Bown, 2023), U.S. tariffs on imports from China currently stand at 51.1%, while Chinese tariffs on U.S. goods are at 32.6%. This is an improvement compared to the tariff levels in late April and early May that exceeded 100%. However, these tariffs have had a significant impact on U.S. agricultural exports to China. China is among the top five export destinations for U.S. agricultural exports (Mexico, Canada, China, Japan, and South Korea). China experienced the most significant decrease among the top markets, with exports plummeting by 55.0%, from $11.1 billion in 2024 (YTD: January – May) to just $5.0 billion in 2025 (See Table 1). This sharp drop highlights the impact of geopolitical tensions, tariff disputes, and shifting global supply chains.

    This Monday (July 7, 2025), President Trump announced on Truth Social that the U.S. will impose a 25% tariff on imports from Japan and South Korea, effective August 1st (Fortnam, 2025). This move marks a significant shift in trade policy, targeting two major allies and the 4th and 5th largest destination markets for U.S. agricultural exports. While the tariffs are intended to address bilateral trade deficits and protect U.S. industries, this decision is likely to strain diplomatic relations and could have a significant impact on U.S. agricultural exports similar to what we have experienced with China. Unlike China, U.S. agricultural exports to Japan and South Korea showed positive growth in 2025 YTD. Japan’s imports increased by 6.0%, rising from $5.5 billion to $5.8 billion in 2025. South Korea had the highest growth among the top markets, with a 15.8% increase, from $3.8 billion to $4.4 billion in 2025 (See Table 1). This surge reflects South Korea’s expanding market for U.S. agricultural goods, driven by favorable trade agreements and growing consumer demand. 

    U.S. agricultural exports to Japan and South Korea totaled $11.9 billion and $8.5 billion in 2024, respectively. Japan is a major market for U.S. corn ($2.7 billion), beef products ($1.9 billion), pork products ($1.4 billion), and soybeans ($1.0 billion). South Korea is a significant market for U.S. beef products ($2.2 billion), pork products ($0.7 billion), and corn ($0.7 billion) (USDA, 2025). If President Trump imposes a 25% tariff on imports from Japan and South Korea, U.S. agricultural trade with these countries could face significant challenges. Japan and South Korea are the 3rd and 4th largest markets for U.S. agricultural exports, showing positive growth in recent years. The tariffs could lead to reduced demand for U.S. products, harming American farmers. Additionally, Japan and South Korea might retaliate with their own tariffs on U.S. goods, further exacerbating the situation and disrupting established trade relationships.

    Table 1. U.S. Agricultural Exports, Total and Top Destinations: 2024 and 2025 (January – May)

    Country2024Jan – May 2024Jan – May 2025% Change
    $ billion
    World (total)$176.4$74.2$72.2-2.6
    Mexico30.212.512.3-1.7
    Canada29.512.011.6-3.2
    China24.411.15.0-55.0
    Japan11.95.55.86.0
    South Korea8.53.84.415.8
    Source: U.S. Department of Agriculture (2025)

    For more information:

    Bown, C.P. (2025). US-China Trade War Tariffs: An Up-to-Date Chart. Peterson Institute for International Economics. https://www.piie.com/research/piie-charts/2019/us-china-trade-war-tariffs-date-chart

    Fortnam, B. (2025). “Trump tells Japan, Korea he’s imposing 25 percent tariffs as of Aug. 1.” Inside U.S. Trade (July 7, 2025) https://insidetrade.com/daily-news/trump-tells-japan-korea-he-s-imposing-25-percent-tariffs-aug-1 (subscription required for access).

    U.S. Department of Agriculture (USDA) (2025). Global Agricultural Trade System. Foreign Agricultural Service. https://apps.fas.usda.gov/gats/default.aspx


    Muhammad, Andrew. “U.S. Agriculture Could Face New Challenges with President Trump’s Proposed Tariffs on Japan and South Korea.” Southern Ag Today 5(28.4). July 10, 2025. Permalink