Author: Andrew Wright

  • Rising Custom Rates Add to Producer Cost Pressures

    Rising Custom Rates Add to Producer Cost Pressures

    Authors: Andrew Wright and Manuel Garcia

    Many producers hire custom operators to perform production activities on their farms. The costs of these services vary by state, service, and provider, and are often not publicly advertised. For this reason, many state extension services survey producers and custom operators to estimate the cost of custom services in their states. In February of this year, Texas A&M AgriLife Extension published its most recent survey of custom rates in Texas. The results offer additional insight into how rising costs have affected farmers’ bottom lines in the state.

    The survey was conducted from August through October 2025 and is based on responses from 391 individuals, including producers, custom operators, farm managers, and extension agents. While we cannot summarize all results here, we can highlight some general conclusions about row-crop operations. 

    Figure 1 summarizes the average percentage change in the reported custom rate for each category of operations included in the survey since 2020, the last time this survey was conducted. On average, the largest cost increases were observed in the tractor rental and application services categories. Custom rates for row crop operations (i.e., tilling, planting, harvesting, and application services) increased by 30 to 39 percent in Texas.

    As we consider these results, we might ask two questions: 1) How do the observations from the Texas survey compare with the general rise in costs across the national economy, and 2) How do the Texas custom rates compare with those of other Southern states? 

    To help answer the first question, Figure 1 also includes two measures from the Producer Price Index (PPI), which tracks the average change in selling prices producers receive for their output. The first measure shown in the figure is the percentage change in the average annual PPI from 2020 to 2025 across all goods and services. The second shows the percentage change in the average annual PPI for farm machinery and equipment manufacturing over the same period. Both measures fall within the range of increases we’ve seen for custom rates for row-crop operations in Texas.  

    The second question is more difficult to answer. Many states conduct surveys of custom rates, like the Texas survey (see Table 1 for links to the most recent reports on custom rates in other southern states). Table 2 compares selected Texas custom rates from our most recent survey with those for similar activities in other states. 

    Overall, the custom rates reported for Texas are not dissimilar to those reported in other states. However, keep in mind these surveys are not conducted on the same schedule or using the same methods, so direct comparisons are limited.

    Most of the custom rates we report here for Texas include the cost of machinery, fuel, and operator labor. Therefore, it is reasonable to assume that the increase in custom rates we observe can be explained in large part by increases in the retail price of farm machinery, higher interest rates (the cost of financing machinery purchases), and, more recently, higher fuel costs.

    While it is no secret that farm operating expenses have risen recently, the conversation typically focuses on fertilizer, fuel, and chemical costs. The 2026 Texas Custom Rate Survey highlights a broader rise in operating expenses beyond these categories. That said, we think it is important to note that since 2020, the sticker price for new and used farm machinery has increased significantly as well. While custom rates have certainly increased, many producers may still find it more cost-effective to hire custom work than to finance machinery purchases and perform these operations themselves.

    Figure 1. Average percentage increases in Texas custom rates, 2020-2026

    Table 1. Links to recent custom rate surveys conducted in southern states

    StateYearLink
    TX2026https://agecoext.tamu.edu/resources/custom-rate-survey/
    OK2021-2022https://extension.okstate.edu/fact-sheets/print-publications/cr/cr-205-farm-and-ranch-custom-rates-2021-2022.pdf
    AR2025https://www.uaex.uada.edu/publications/PDF/fsa-21.pdf
    MS2024https://extension.msstate.edu/sites/default/files/publications/P4048_web.pdf
    GA2024https://agecon.uga.edu/content/dam/caes-subsite/ag-econ/documents/extension/Decision%20Aids/Georgia%20Custom%20Rate%20Survey%20Summary%202024.pdf
    TN2023https://utia.tennessee.edu/publications/wp-content/uploads/sites/269/2024/07/D239.pdf
    KY2024https://agecon.mgcafe.uky.edu/sites/agecon.ca.uky.edu/files/CustomMachineryRatesApplicableKentucky%282024%29.pdf

    Table 2. Comparison of custom rates across similar activities in southern states

      Average rate ($/acre)
    CategoryCustom workTexas (2026)Arkansas (2025)Mississippi (2024)Georgia (2024)Kentucky (2024)
    Land tillageDisk/Disk-harrow $        24.2  $             15.3  $                16.8  $      21.7  $       20.0 
    Field Cultivator $        19.0  $             10.5  $                16.5  $      15.9  $       19.0 
    Fertilizer applicationLiquid fertilizer $        10.8  $             16.5  $                12.3  $      18.4  $          9.0 
    Aerial fertilizer $        13.6   $                13.6  $      25.1  
    Dry fertilizer $        13.4  $                4.6  $                   9.0  $      13.0  $          7.5 
    CombineCombine corn $        34.7  $             66.6  $                47.0  $      58.5  $       42.0 
    Combine soybeans $        39.7  $             43.1  $                43.0  $      54.7  $       40.0 
    Combine wheat/small grains $        31.3  $             40.7  $                41.0  $      52.3  $       38.5 
    Note: Arkansas rates are based on: Disk harrow (28′), Field cultivator (24′), Liquid fert appl (8R-30), and combines for corn (6R-30), soybean (25′ flex), and wheat/sorghum (22′ rigid).

    References

    U.S. Bureau of Labor Statistics, Producer Price Index by Commodity: All Commodities [PPIACO], retrieved from FRED, Federal Reserve Bank of St. Louis; https://fred.stlouisfed.org/series/PPIACO, June 20, 2026.  

    U.S. Bureau of Labor Statistics, Producer Price Index by Industry: Farm Machinery and Equipment Manufacturing [PCU333111333111], retrieved from FRED, Federal Reserve Bank of St. Louis; https://fred.stlouisfed.org/series/PCU333111333111, June 25, 2026.


    Recommended citation format: Wright, Andrew, and Manuel Garcia. “Rising Custom Rates Add to Producer Cost Pressures.Southern Ag Today 6(31.1). July 27, 2026. Permalink

  • The Outlook for Interest Rates in 2026

    The Outlook for Interest Rates in 2026

    Although it may be a new year, it brings many old questions, including how the Federal Reserve will manage interest rates in 2026. The Federal Reserve adjusts the federal funds rate, the rate at which banks in the Federal Reserve System lend to one another.  Their objective in adjusting rates is to 1) keep inflation low and stable and 2) maintain full employment in the economy. After swiftly raising the federal funds rate in 2022 to combat inflation, the Federal Reserve began lowering its target rate slowly in the second half of 2024. The federal funds rate held steady for most of 2025; however, the Federal Open Market Committee (FOMC), the group within the Federal Reserve that sets interest rates, resumed rate cuts at its September meeting. The FOMC implemented additional cuts at its next two meetings in October and December.

    Additionally, at the December meeting, the FOMC released its latest economic projections and monetary policy expectations. These projections summarize the views of the thirteen FOMC members on economic growth, unemployment, and inflation, as well as their views on appropriate monetary policy in both the short and long term. Table 1 summarizes FOMC members’ projections for 2026. While FOMC members largely agree on how the economy will perform this year, they differ on how the federal funds rate should change.

    Table 1. 2026 Economic Projections of FOMC Members as of December 30, 2025

     Median (%)Central Tendency (%)1Range (%)
    Change in Real GDP2.32.1 – 2.52.0 – 2.6
    Unemployment Rate4.44.3 – 4.44.2 – 4.6
    PCE Inflation2.42.3 – 2.52.2 – 2.7
    Federal Funds Rate3.42.9 – 3.62.1 – 3.9
    The central tendency represents the range of projections, excluding the 3 highest and 3 lowest values.

    How the FOMC manages the federal funds rate in 2026 will depend on how inflation and unemployment change. All else equal, if inflation rises again, the FOMC is more likely to maintain or raise the federal funds rate. On the other hand, if unemployment increases, the FOMC is likely to lower the federal funds rate and may do so more rapidly than it currently plans. If we take the FOMC’s median projection as its most likely course of action, we expect the FOMC to make a single quarter-point cut to the federal funds rate in 2026. While it may implement this cut early in 2026, during its January or March meeting, it’s more likely that a single cut would occur in the third or fourth quarter of 2026. This would imply a 3.5-3.75 percent federal funds rate to start the year, with a cut to 3.25-3.5 percent at some point between June and December.

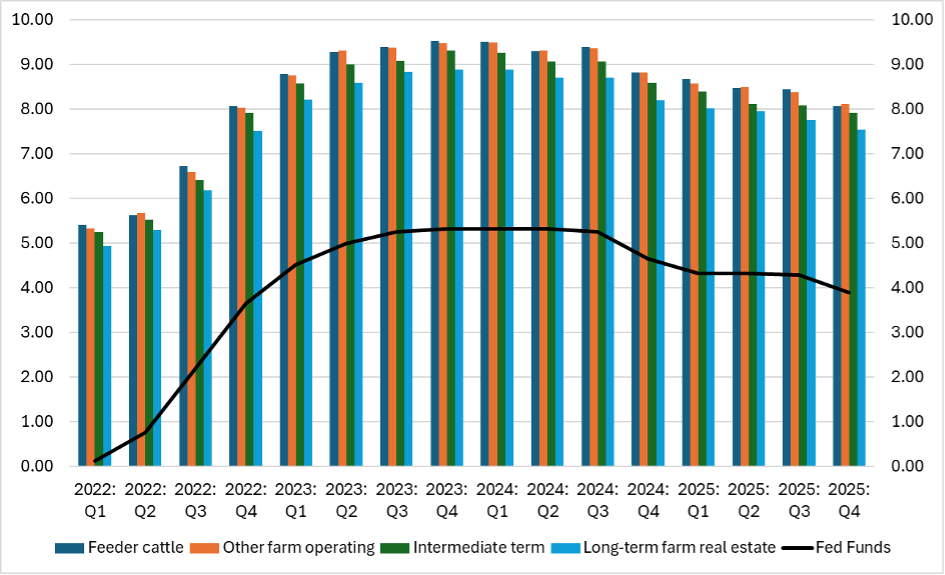
    Figure 1 uses data from the Dallas Federal Reserve’s Agricultural Survey to illustrate how the FOMC’s actions affect agricultural lending rates. Ag lending rates tend to move with the federal funds rate and are about 4-5 percentage points higher on average. If this relationship continues, a single quarter-point cut would imply average ag lending rates in the Dallas Federal Reserve District in the mid-to-upper 7 percent range for operating loans and in the low-to-mid 7 percent range for intermediate and real estate loans. However, the actual rate a borrower receives will depend on their relationship with the lender and their perceived creditworthiness.

    Figure 1. Agricultural Lending Rates by type and the Federal Funds Rate, 2022-2025

    References

    Board of Governors of the Federal Reserve System (US), Federal Funds Effective Rate [FEDFUNDS], retrieved from FRED, Federal Reserve Bank of St. Louis; https://fred.stlouisfed.org/series/FEDFUNDS.

    Board of Governors of the Federal Reserve System (US), Agricultural Survey, retrieved from the Federal Reserve Bank of Dallas; https://www.dallasfed.org/research/surveys/agsurvey.

    Board of Governors of the Federal Reserve System (US), December 30, 2025: FOMC Projections Materials, Accessible Version.  Retrieved from: https://www.federalreserve.gov/monetarypolicy/fomcprojtabl20251210.htm.


     Wright, Andrew. “The Outlook for Interest Rates in 2026.Southern Ag Today 6(6.1). February 2, 2026. Permalink

  • Recent Trends in Farm Operating Costs

    Recent Trends in Farm Operating Costs

    In May, the USDA Economic Research Service (ERS) released commodity cost and return estimates for crop and livestock products grown in the United States. These estimates are published twice a year and offer insights into the costs faced by the “average” producer at the national and regional levels across the United States. Additionally, on June 18, ERS released cost-of-production forecasts for the 2025 and 2026 production years. This article uses the ERS data to examine changes in operating costs[1] for producers in southern states since 2022, when farm operating costs peaked, and to estimate future cost trends.

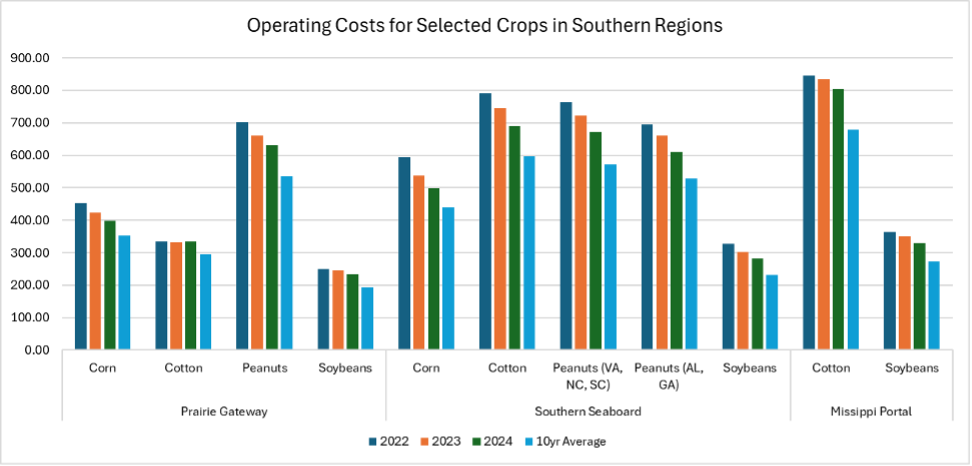
    Figure 1 compares operating costs for selected crops in 2022, 2023, and 2024 based on ERS data. Note that ERS divides states into farm resource regions for their estimates. The Prairie Gateway includes most of Texas, parts of New Mexico, Oklahoma, Colorado, and Nebraska, as well as all of Kansas. The Southern Seaboard consists of the easternmost counties of Texas, the northwestern counties of Louisiana, the southeastern counties of Mississippi, and most of Alabama, Georgia, South Carolina, North Carolina, and Virginia. Finally, the Mississippi portal covers the eastern parts of Arkansas and Louisiana, along with the western parts of Tennessee and Mississippi.

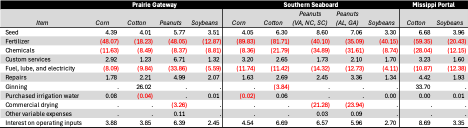
    The data show that operating costs in the southern United States have decreased from their recent highs in 2022; however, they are still significantly above their 10-year averages. The only exception is cotton in the Prairie Gateway states, where increases in ginning costs (due to higher production in 2023 and 2024) and interest costs were enough to offset reductions in other expenses. Table 1 outlines the changes in specific operating costs from 2022 to 2024, explaining why overall costs have decreased since 2022. Unsurprisingly, reductions in operating expenses are mainly due to lower costs for fertilizer, chemicals, and fuel over the past two years.  

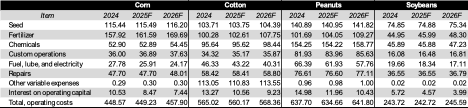
    Unfortunately for producers, the recent decline in operating costs is likely to be temporary. Table 2 presents the ERS forecasts for corn, cotton, peanuts, and soybeans’ operating expenses in 2025 and 2026, alongside the 2024 cost estimates for comparison. The forecasts indicate that operating expenses will remain close to their 2024 level this year and are expected to rise slightly in 2026. Note that the commodity cost forecasts are reported at the national level rather than the regional level. However, regional and national trends are highly correlated in the ERS cost estimates. Therefore, it is reasonable that regional cost forecasts would resemble the national forecast provided by ERS.

    Figure 1. Operating Costs ($/ac) for Selected Crops in Southern Regions, 2022-2024 and 10-Year Average

    Table 1. Change in Operating Costs ($/ac), 2022-2024 

     Table 2. Estimated and Forecasted Operating Costs, 2024-2026


    [1] Operating costs for all crops include seed, fertilizer, chemicals, custom services, fuel/lube/electricity, repairs, purchased irrigation water, and interest on operating inputs. In addition, cotton operating costs includes ginning, and peanut operating costs includes commercial drying.     


    References and Resources

    U.S. Department of Agriculture, Economic Research Service. Commodity Costs and Returns data. https://www.ers.usda.gov/data-products/commodity-costs-and-returns/documentation    


    Wright, Andrew. “Recent Trends in Farm Operating Costs.Southern Ag Today 5(28.1). July 7, 2025. Permalink

  • Fertilizer Prices: What Can We Expect in 2025?

    Fertilizer Prices: What Can We Expect in 2025?

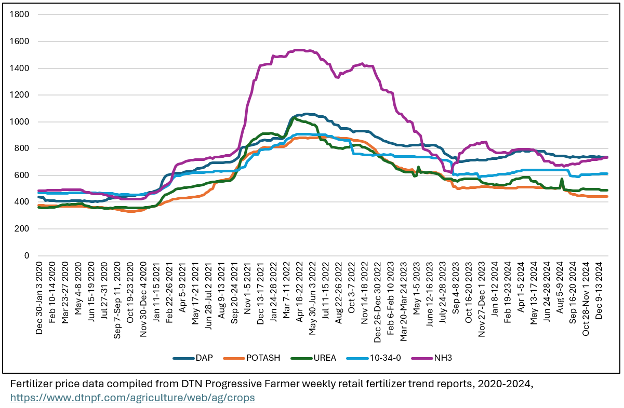
    Over the last few years, producers have been challenged to balance decreasing commodity prices against high input costs. One of the major factors contributing to this challenge has been above-average fertilizer prices. In 2021 and 2022, a combination of increased demand for fertilizer and disruptions to fertilizer production and supply caused prices to double or, in the case of anhydrous ammonia (NH3), triple in a few months (Figure 1), reaching record highs. The good news is that nominal fertilizer prices decreased throughout 2023 and 2024 as these shocks were largely corrected. In the first half of 2023, prices decreased by 20%-40%, depending on the product, from their 2022 highs. Prices largely declined in 2024 until the last quarter of the year. Since then, prices for most fertilizer products have either remained stable or increased.

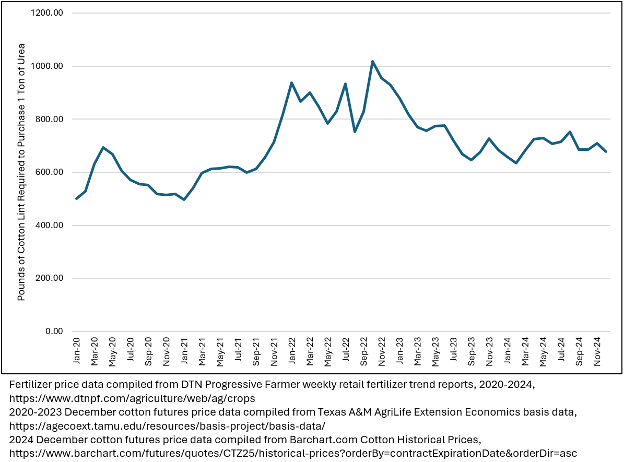
    Of course, the cost of fertilizer depends not only on the price of fertilizer but also on the price of the commodity the fertilizer is used to grow. It’s much easier for producers to purchase fertilizer when they can sell corn for $7/bushel, as opposed to $4/bushel, regardless of the nominal fertilizer price. Figures 2 and 3 illustrate the price of urea relative to corn and cotton prices for the years 2020-2024. Fertilizer prices used to calculate these ratios come from DTN Progressive Farmer’s weekly average fertilizer price updates. Cotton and corn prices use the weekly closing price for the nearby December contract as reported in Texas A&M AgriLife Extension Economics Basis Data and by Barchart.com.  

    Figure 2 illustrates the total bushels of corn required to purchase one ton of urea in each month of the series. Figure 3 shows the total pounds of cotton lint required to purchase one ton of urea each month. From January 2020 until August 2021, producers needed an average of 98.02 bushels of corn or 577.80 pounds of cotton lint to purchase 1 ton of urea. From September 2021 through December 2022, when fertilizer prices reached their highest levels, one ton of urea cost an average of 135.72 bushels of corn or 836.61 pounds of cotton lint. From January 2023 through December 2024, as fertilizer prices fell, one ton of urea was worth 117.40 bushels of corn or 719.26 pounds of cotton lint on average.  

    Now, what about relative fertilizer prices in 2025? For the week of January 13-17, DTN Progressive Farmer reported an average price of $492/ton of urea. During that same week, the average price for the Dec ’25 corn contract was $4.56/bushel, and the average price for the Dec ’25 cotton contract was $0.69/pound, according to Barchart.com. This gives us a urea-corn price ratio of 107.92 bushels/ton and a urea-cotton ratio of 711.25 pounds/ton. To put these values into perspective, this urea-corn ratio is similar to the June 2020 ratio and about 0.83 bushels/ton less than in January 2024.  The urea-cotton ratio, on the other hand, is about 52.32 pounds/ton higher than in January 2024, and similar to June and July of last year.  

    Currently, fertilizer is slightly cheaper relative to corn prices and slightly more expensive relative to cotton prices when compared to a year ago.  Looking forward, nominal fertilizer prices have been mostly stable since July of last year.  Should this trend continue, changes in relative fertilizer prices this year will depend on how farm commodity prices change. 

    Figure 1.  Weekly Retail Prices for Selected Fertilizer Products, 2020-2024

    Figure 2. Monthly Urea-Corn Price Ratio, 2020-2024

    Figure 3. Monthly Urea-Cotton Price Ratio, 2020-2024

    Sources:

    Corn Historical Prices.  Barchart.com, https://www.barchart.com/futures/quotes/ZCZ25/historical-prices?orderBy=contractExpirationDate&orderDir=asc

    Cotton #2 Historical Prices. Barchart.com, https://www.barchart.com/futures/quotes/CTZ25/historical-prices?orderBy=contractExpirationDate&orderDir=asc

    DTN Retail Fertilizer Trends.  DTN Progressive Farmer, https://www.dtnpf.com/agriculture/web/ag/crops

    Texas A&M AgriLife Extension Agricultural Economics Basis Data, https://agecoext.tamu.edu/resources/basis-project/basis-data


    Wright, Andrew. “Fertilizer Prices: What Can We Expect in 2025?Southern Ag Today 5(6.1). February 3, 2025. Permalink

  • Lower Interest Rates Create Opportunities for Managing Debt on the Farm

    Lower Interest Rates Create Opportunities for Managing Debt on the Farm

    A “triple threat” of low commodity prices, high input costs, and high interest rates creates a challenging financial environment for many producers.  This is especially true for producers with little working capital and who rely on operating loans to finance their business activities.  The good news is that one part of this “triple threat” may soon begin to ease.  

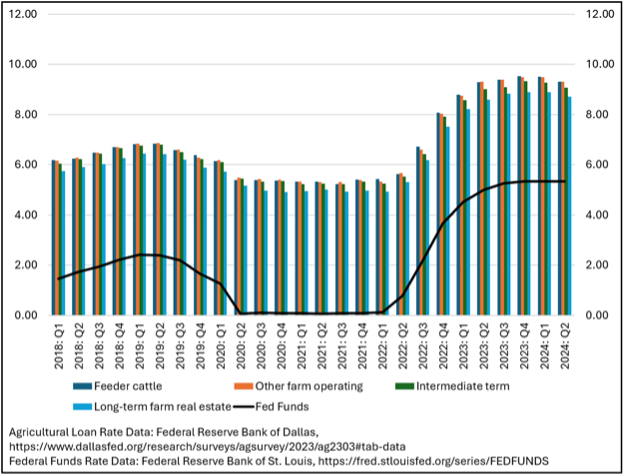
    The Federal Reserve began raising the federal funds rate in the first quarter of 2022 in response to rising inflation (see Figure 1).  This started a series of rate increases that ended in August 2023.  Since, then, the federal funds rate has held steady at 5.33%.  As the federal funds rate increased, interest rates charged on agricultural loans went up from about 5% to around 9% (Figure 1). 

    However, in a speech on August 23, 2024, Federal Reserve Chair Jerome Powell indicated that the Federal Open Market Committee (FOMC) would begin to lower the federal funds rate, perhaps as early as their September meeting.  As the FOMC lowers the federal funds rate, other interest rates will begin to fall as well.  This will be a welcome reprieve for producers as the cost of borrowing to finance operations decreases.  It also provides producers with opportunities to manage the debt they have incurred over the last few years at high interest rates.  Two strategies that producers might use as interest rates fall are debt refinancing and debt consolidation.

    When debt is refinanced, an existing loan is replaced by a new loan with different terms and conditions for repayment.  The new loan pays off the remaining principal plus any accrued interest that is still owed on the old loan.  The amount that is paid off becomes the principal owed on the new loan.  Payments are then made on this new loan, ideally with lower periodic payments.  Debt consolidation is a form of refinancing in which multiple debts are combined into a single loan.  The new loan pays off the remaining principal and any accrued interest on all the old loans, and the amount that is paid off becomes the principal owed on the new loan.

    The primary benefit of refinancing or consolidating debt is smaller monthly or periodic payments, which occurs for two reasons.  First, refinancing or consolidating debt often involves extending the debt’s repayment period.  The amount owed is paid back over a longer period than the original loan(s) terms allowed for, so payments in each month are less.  Second, refinancing or consolidating debt as interest rates decrease means the new loan should charge less in interest monthly than was charged on the old loan(s).  The potential results of this benefit include improved monthly cash flow and an easier time making regular payments on debt.

    Before a producer considers either of these strategies to help manage their debt, it is important to consider the potential pitfalls of refinancing or consolidation.  First, extending the loan payment period may incur higher total interest costs.  Although the amount owed in any single period is less, the fact that the loan principal is paid back over a longer time means interest accrues for longer as well.  Therefore, there may be a tradeoff between lower periodic payments and higher overall costs for the loan.  A second pitfall to consider is the closing costs and fees the producer must pay to initiate the new loan.  Producers should consider whether they can pay these costs, and whether incurring these costs are worth any benefits of refinancing or consolidation, before initiating either process with their lender.  Ultimately, producers will need to consult with their lenders to determine what refinancing or consolidations options are available to them and whether these options will be beneficial in the long run.

    Figure 1.  Changes in the Inflation rate, the Federal Funds Rate, and the Unemployment Rate, January 2018-February 2024 


    References

    Board of Governors of the Federal Reserve System (US), Federal Funds Effective Rate [FEDFUNDS], retrieved from FRED, Federal Reserve Bank of St. Louis; https://fred.stlouisfed.org/series/FEDFUNDS, April 1, 2024.

    Board of Governors of the Federal Reserve System (US), Agricultural Survey, retrieved from the Federal Reserve Bank of Dallas; https://www.dallasfed.org/research/surveys/agsurvey/2024/ag2401#tab-report.


    Wright, Andrew. “Lower Interest Rates Create Opportunities for Managing Debt on the Farm.Southern Ag Today 4(37.3). September 11, 2024. Permalink