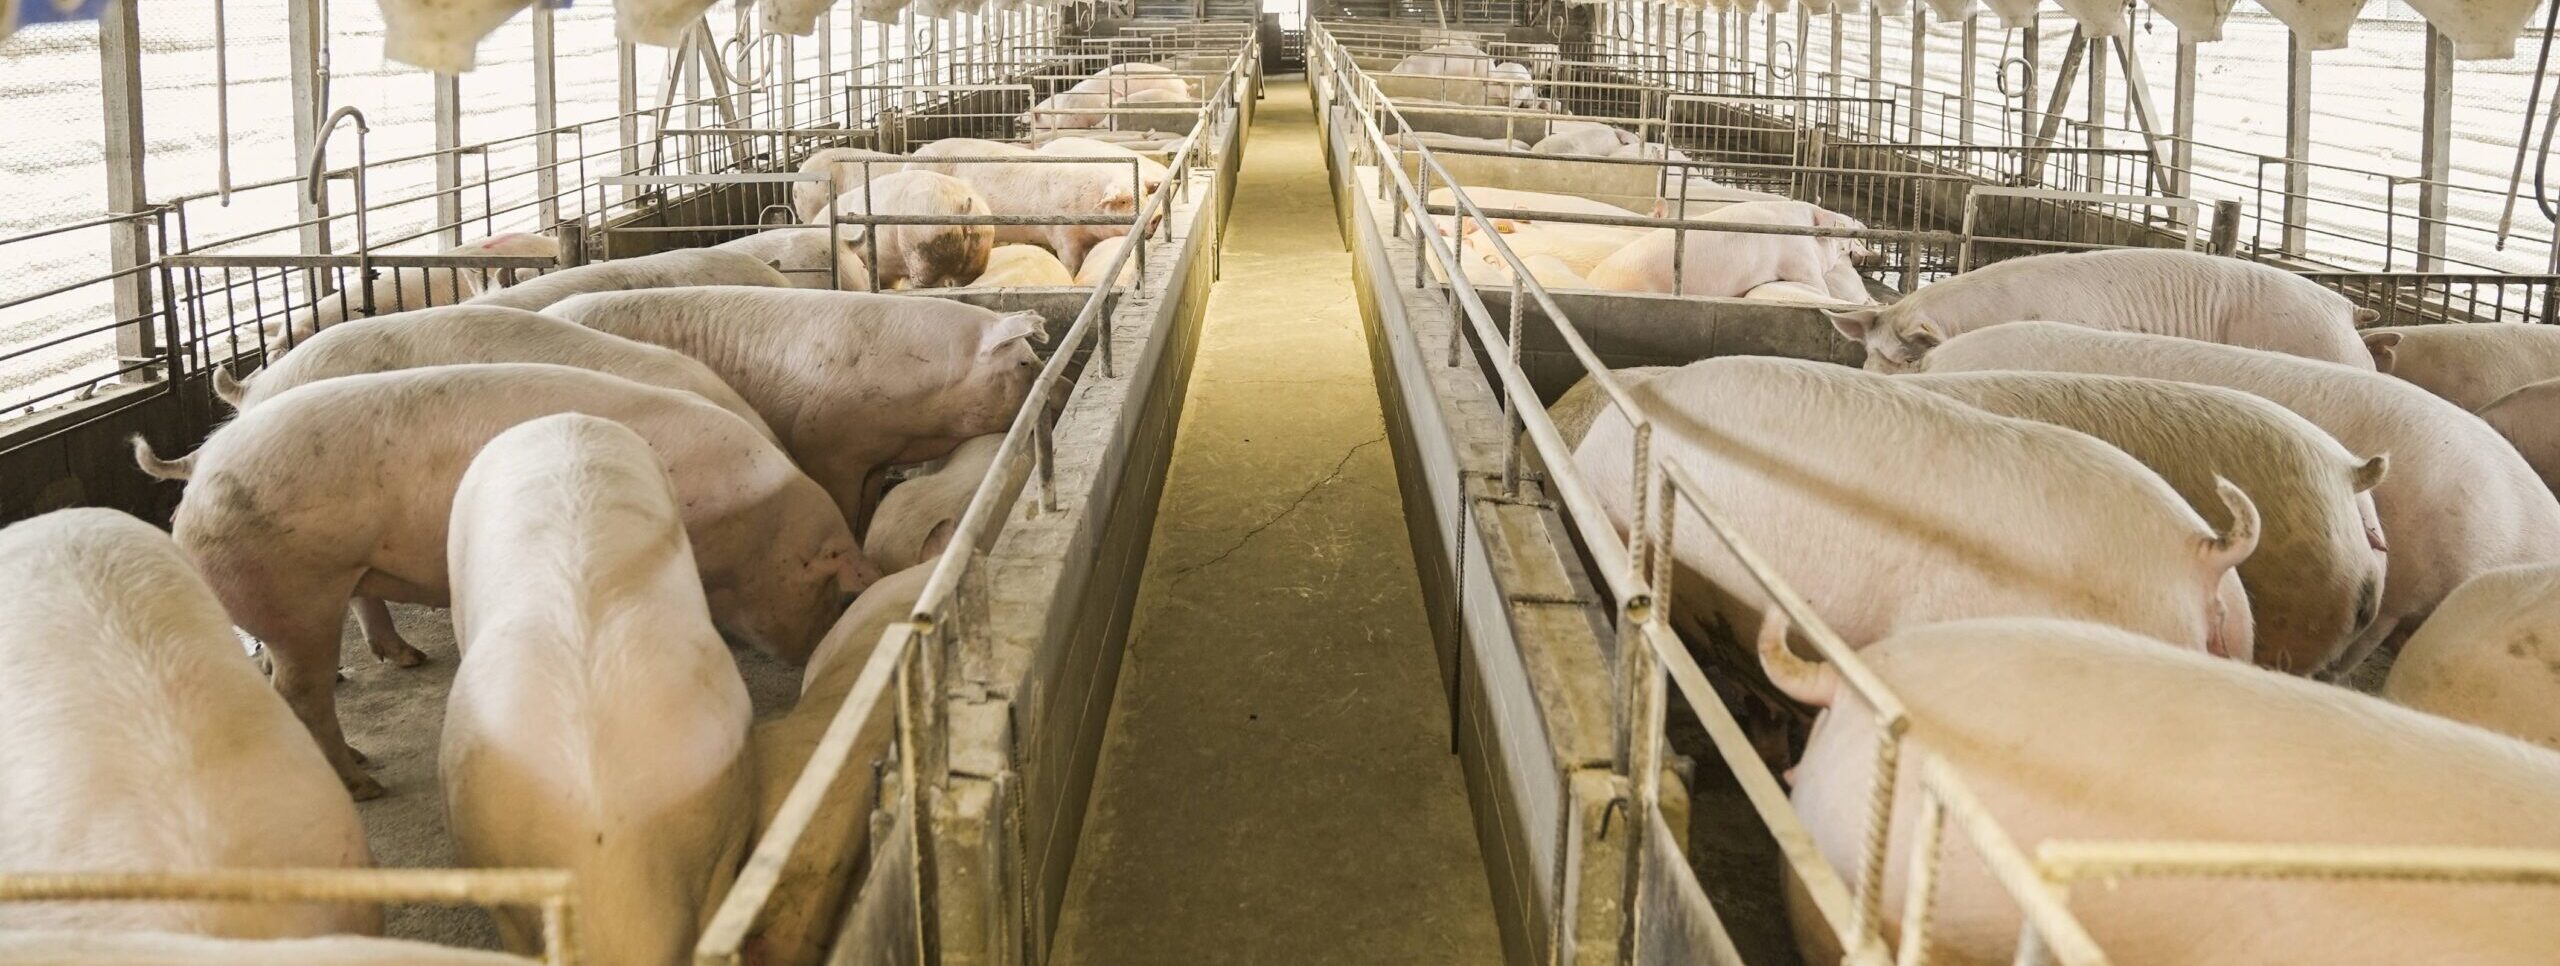
Author: Bart Fischer

  • Where are Commodity Prices Headed in the Next CBO Baseline?

    Where are Commodity Prices Headed in the Next CBO Baseline?

    recent article in Southern Ag Today highlighted that increasing marketing year average prices over the past few years likely will lead to increasing “Effective Reference Prices” for many crops.  The article further noted that if those increased Effective Reference Prices were realized, “then the cost of increasing reference prices for all commodities should be significantly lower when cost estimates are developed during farm bill discussions.”

    The analysis in the earlier article was based on the Congressional Budget Office’s (CBO) May 2022 baseline projections.[1]  The biggest question at this point: where are commodity prices headed in the next CBO baseline?  To help answer this question, we look to the U.S. Department of Agriculture’s (USDA) most recent long-term outlook released on November 7, 2022.[2]

    As noted in Table 1, commodity prices in USDA’s latest long-term price outlook have increased significantly relative to CBO’s May 2022 projections.  Significant increases in the near term will bolster Effective Reference Prices, and generally speaking, those increases persist throughout the entire baseline period.  For example, USDA is projecting corn prices to average $4.30/bu in 2032, a $0.50/bu increase over CBO’s $3.80/bu estimate for 2032 in May 2022.  Figure 1 explores the same data as percentage increases.  For example, the marketing year average prices for corn, cotton, and wheat are all expected to be at least 10 percent higher in 2032 than projected by CBO in May 2022.

    Bottom line: the upcoming baseline projections will likely reinforce the point made in the earlier Southern Ag Today article, with higher prices continuing to reduce the cost estimates for raising reference prices in the next farm bill.

    Table 1.  Dollar Change in Marketing Year Average Price Projections, USDA November 2022 versus CBO May 2022.

    Units2023202420252026202720282029203020312032
    Corn$/bu1.250.800.550.450.450.350.300.350.400.50
    Cotton$/lb0.060.050.040.050.060.070.090.100.120.11
    Soybeans$/bu2.501.200.750.450.250.300.300.300.300.30
    Wheat$/bu1.651.600.750.450.500.500.500.550.550.60

    Figure 1.  Percent Change in Marketing Year Average Price Projections, USDA November 2022 versus CBO May 2022.


    [1] https://www.cbo.gov/data/baseline-projections-selected-programs

    [2] https://www.usda.gov/oce/commodity-markets/baseline

    Author: Bart Fischer

    Research Assistant Professor

    Co-Director Agricultural & Food Policy Center at Texas A&M University

    Bart.Fischer@ag.tamu.edu


    Fischer, Bart. “Where are Commodity Prices Headed in the next CBO Baseline?Southern Ag Today 2(52.4). December 22, 2022. Permalink

  • An Early Look at the Farm Safety Net for Cotton in 2023

    An Early Look at the Farm Safety Net for Cotton in 2023

    [et_pb_section fb_built=”1″ admin_label=”section” _builder_version=”4.16″ global_colors_info=”{}” theme_builder_area=”post_content”][et_pb_row admin_label=”row” _builder_version=”4.16″ background_size=”initial” background_position=”top_left” background_repeat=”repeat” global_colors_info=”{}” theme_builder_area=”post_content”][et_pb_column type=”4_4″ _builder_version=”4.16″ custom_padding=”|||” global_colors_info=”{}” custom_padding__hover=”|||” theme_builder_area=”post_content”][et_pb_text admin_label=”Text” _builder_version=”4.16″ background_size=”initial” background_position=”top_left” background_repeat=”repeat” global_colors_info=”{}” theme_builder_area=”post_content”]

    From wild swings in commodity prices to an explosion in input costs that would make the Consumer Price Index (CPI) blush, agricultural producers have been riding a rollercoaster over the past year.  The purpose of the farm safety net – the combination of Federal crop insurance and the traditional farm bill programs like Agriculture Risk Coverage (ARC) and Price Loss Coverage (PLC) – is to help producers manage these risks. However, unprecedented pressure from the COVID-19 pandemic and natural disasters, along with the inflated input costs, have exposed gaps in the current farm safety net.  One of the concerns on the minds of most producers at this point is how the farm safety net will perform in 2023 if commodity prices fall and input costs remain at elevated levels.  In this article, we look at this question in the context of cotton.

    This summer, USDA’s Economic Research Service (ERS) forecasted a U.S. average total cost of production for cotton in 2023 of $794/ac.[1]  Assuming an average yield of 847 lbs/ac (based on the 5-year harvested-acre average for upland cotton from 2017-21), the total average cost of production for cotton in 2023 would be an estimated $0.9374/lb.  The question:  how much of the cost incurred by producers will be protected by the farm safety net?

    Federal crop insurance is the cornerstone of the farm safety net.  The insured price for cotton in the spring will be based on the Cotton #2 Dec ’23 futures contract (CTZ23).  While the price is based on a month-long average (with the discovery period depending on your location), this example simply uses yesterday’s closing price ($0.731/lb) as a proxy for how the safety would perform if the insured price were established at yesterday’s levels (Figure 1).  For a grower with Revenue Protection (RP) at a 75% coverage level, they are effectively protecting $0.5483/lb (= $0.731/lb x 75%).  Even in the case where a grower purchases STAX at a 90% coverage level (in addition to RP), they still are only able to protect $0.6579/lb (= $0.731/lb x 90%).  In other words, a producer would only be able to insure, on average, 70% of their total cost of production (= $0.6579/$0.9374).  

    But, won’t PLC help fill in the gap given it is designed to help in low-price scenarios?  With cottonseed prices at $343/ton (NASS August 2022[2]), a lint value of roughly $0.637/lb equates with a seed cotton equivalent of $0.367/lb (the PLC seed cotton reference price).  In other words, if cottonseed prices for the marketing year averaged $343/ton, lint prices would have to fall below $0.637/lb before PLC would trigger support.  If the marketing year average price were to hover around the insurance price in our example ($0.731/lb), PLC would end up paying nothing.

    Naturally, any number of different scenarios could transpire.  For example, prices could rebound before planting.  Input costs could fall between now and the spring.  And, above-average yields could blunt the impact of lower prices.  In the case of yields and given the example above, if prices averaged $0.731/lb, yields would need to be more than 28% above average to break even.  While that is possible (especially in isolated areas), neither producers (nor their lenders) can bank on yields that are 28% above average.

    This scenario clearly highlights just one example of the gaps that exist in the current farm safety net.  It also highlights the importance of the upcoming debate on the 2023 Farm Bill.  While pundits are prognosticating over whether there will be a simple extension of the current farm bill next year, agricultural producers may not be able to wait.  Even if the markets end up breaking their way, they currently are exposed to a considerable amount of risk and the prospect of significant losses.

    Figure 1.  Cotton #2 December 2023 ICE Futures Contract (CTZ23)


    [1] https://www.ers.usda.gov/webdocs/DataFiles/47913/cop_forecast.xlsx?v=4738.9

    [2] https://downloads.usda.library.cornell.edu/usda-esmis/files/c821gj76b/69700872f/k643c9334/agpr0922.pdf

    Fischer, Bart L., and Joe Outlaw. “An Early Look at the Farm Safety Net for Cotton in 2023.” Southern Ag Today 2(44.4). October 27, 2022. Permalink

  • Agricultural Provisions in the Reduction Act of 2022

    Agricultural Provisions in the Reduction Act of 2022

    In a recent report by the Agricultural & Food Policy Center (AFPC), we provided an overview of the agricultural provisions included in the recently-passed Inflation Reduction Act (IRA) of 2022.  The IRA was a Senate-led compromise that broke the months-long logjam over the Build Back Better (BBB) Act that had been stalled in the Senate.  As noted in Figure 1, the funding for agriculture in the IRA was less than half of what had been proposed in the BBB.

    As noted in Figure 1, roughly half of the funding for agriculture goes to conservation.  Specifically, the IRA provides an additional $8.45 billion for the Environmental Quality Incentives Program (EQIP), $3.25 billion for the Conservation Stewardship Program (CSP), $1.4 billion for the Agricultural Conservation Easement Program (ACEP), $4.95 billion for the Regional Conservation Partnership Program (RCPP), $1 billion for Conservation Technical Assistance, and $300 million for USDA to collect “field-based data” to quantify carbon sequestration and greenhouse gas emissions.  Importantly, beyond the temporary funding increases, the authorizations for all of these programs – including the Conservation Reserve Program (CRP) – were extended through fiscal year 2031.

    The IRA also provided $3.1 billion for loan relief to borrowers with “at-risk agricultural operations” and almost $3 billion in assistance and support for “underserved farmers, ranchers, and foresters,” of which $2.2 billion is for financial assistance – including the cost of any financial assistance – to producers determined to have experienced discrimination prior to January 1, 2021, in any USDA farm lending programs.  As noted in a recent Southern Ag Today article, initial versions of the IRA had left out debt relief, but the version that was signed into law ultimately addressed the issue.  

    Finally, the IRA provided over $13 billion for rural development programs – most of which is for rural electric cooperative loans – and almost $5 billion for forestry-related provisions.

    We are frequently asked about the impact that this will have on the next farm bill.  While one can argue that an additional infusion for farm bill conservation programs is helpful, it is important to note that the additional funding dries up in fiscal year 2026, which will likely coincide with the mid-point of the next farm bill.  This undoubtedly will complicate what are already guaranteed to be complicated farm bill deliberations next year.

    Figure 1. Comparing Estimated Outlays for Agriculture under the Build Back Better (BBB) Act and the Inflation Reduction Act (IRA), FY2022-31.

    Source:  https://afpc.tamu.edu/research/publications/files/719/BP-22-06-inflation-reduction-act.pdf

    Fischer, Bart L., and Joe Outlaw. “Agricultural Provisions in the Inflation Reduction Act of 2022.” Southern Ag Today 2(36.4). September 1, 2022. Permalink

  • Debt Relief for Certain Farmers & Ranchers

    Debt Relief for Certain Farmers & Ranchers

    On March 11, 2021, President Biden signed the American Rescue Plan (ARP) Act of 2021 into law.  Section 1005 of the act required the Secretary to make payments to socially disadvantaged farmers or ranchers “in an amount up to 120 percent of the outstanding indebtedness” of eligible producers for both direct and guaranteed loans administered by various USDA agencies.[1]  While USDA immediately went to work implementing the provisions, multiple lawsuits were filed – alleging that the provision was unconstitutional because it violates the Due Process Clause of the Fifth Amendment – and 3 courts have issued injunctions prohibiting USDA from issuing any payments, loan assistance, or debt relief pursuant to Section 1005.[2]  According to USDA, the injunctions “do not prohibit FSA from completing administrative actions leading up to payments, including providing payment notifications to potentially eligible borrowers.”[3]  At the time of passage, the Congressional Budget Office (CBO) estimated the provision would cost $3.98 billion over the next 10 years.[4]

                In the meantime, the Build Back Better Act (BBB) of 2021 – which passed the House on November 19, 2021 – sought to remedy the concerns raised about Section 1005 in the American Rescue Plan.  Specifically, Section 12101 of the BBB amends Section 1005 of ARP, in part, by changing the focus of the debt relief to “economically distressed borrowers” with eligibility tied to eight (8) broad criteria ranging from debt delinquency metrics to whether the farm or ranch was headquartered in a county with a poverty rate of 20 percent or greater.[5]  With the presumably expanded list of eligible borrowers, CBO estimated that the provision would cost $6.647 billion over the next 10 years.[6]  Due, in part, to the price tag of the overall bill, the BBB has languished in the Senate for the last several months.

                Last week, Senators Schumer and Manchin announced a joint agreement to add various provisions from the BBB – via the Inflation Reduction Act of 2022 – to the FY2022 Budget Reconciliation Bill.[7]  In our review of the draft legislation posted last week, it does not appear that debt relief for farmers and ranchers was included.  While Congressional leaders may have plans for including debt relief in another legislative vehicle, unless and until they do – or unless and until the courts rule on the pending cases or lift the existing injunctions – potentially eligible farmers and ranchers will have to keep waiting.  


    [1] https://www.congress.gov/117/plaws/publ2/PLAW-117publ2.pdf

    [2] See Holman v. Vilsack, 21-1085-STA-jay, Order Granting Motion for Preliminary Injunction (July 8, 2021); Miller v. Vilsack, 4:21-cv-00595-O, Order (July 1, 2021); Wynn v. Vilsack, 3:21-cv-00514-MMH-JRK, Order (June 23, 2021). 

    [3] https://www.farmers.gov/loans/american-rescue-plan

    [4] https://www.cbo.gov/system/files/2021-03/Estimated_Budgetary_Effects_of_hr1319_detailed_tables.xlsx

    [5] https://www.congress.gov/congressional-record/volume-167/issue-201/house-section/article/H6375-4

    [6] https://www.cbo.gov/system/files/2021-11/hr5376_title_I_Agriculture.xlsx

    [7] https://www.democrats.senate.gov/inflation-reduction-act-of-2022


    Fischer, Bart, and Tiffany Dowell-Lashmet. “Debt Relief for Certain Farmers & Ranchers.” Southern Ag Today 2(32.4). August 4, 2022. Permalink

  • The Trillion Dollar “Farm” Bill

    The Trillion Dollar “Farm” Bill

    In May 2022, the Congressional Budget Office (CBO) released its latest 10-year budget projections for a number of Federal programs, including farm-related programs and the Supplemental Nutrition Assistance Program (SNAP).  While CBO typically updates its budget projections up to three times per year, the spring update following the release of the President’s budget is most closely watched as it typically is the baseline against which the cost of legislative proposals is “scored” throughout the year.

    During farm bill reauthorization years, CBO typically also releases their baseline projections by farm bill title.  That summary gives policymakers a clear picture of the budget for mandatory spending they have to work with in each title of the farm bill.  That estimate also gives a clear picture of what CBO expects the entire farm bill to spend if existing policies were simply maintained going forward.

    While we are still a year out from CBO releasing baseline projections by title, there is still plenty to be gleaned from the May 2022 baseline update.  For example, if we look back to the April 2018 baseline (the scoring baseline for the 2018 Farm Bill), the spending projections for CCC Price Support and Related Activities, Conservation, SNAP, and Crop Insurance accounted for $865.9 billion (Table 1), or 99.85% of the $867.2 billion in projected total baseline outlays for the farm bill.  

     Applying the same methodology to the most recent May 2022 baseline update, those four categories are projected to spend approximately $1.3 trillion over the next 10 years (Table 1).  The significant increase is due to a 66.4% increase in projected spending on SNAP, with SNAP now projected to account for $1.1 trillion, or 84% of the total farm bill baseline.  By contrast, the income support provisions for agricultural producers that make up the largest component of Title 1 – the Agriculture Risk Coverage (ARC) and Price Loss Coverage (PLC) programs – are projected to spend $43.3 billion over the next 10 years, or just 3.3% of the total farm bill baseline.

    Table 1.  Congressional Budget Office (CBO) 10-Year Outlays in Million$

     April 2018May 2022Change($)Change (%)
    CCC Price Support & Related 1/64,30571,092+6,787+10.6%
    Conservation59,68959,216-473-0.8%
    SNAP 2/663,8281,104,384+440,556+66.4%
    Crop Insurance78,03779,761+1,724+2.2%
    Total865,8591,314,453+448,594+51.8%

    1/ CBO included $10 billion in “Other Administrative CCC Spending” in the May 2022 baseline update.
    2/ Revised economic assumptions and administrative changes to the Thrifty Food Plan (TFP) resulted in the Office of Management and Budget (OMB) projecting an additional $254 billion in SNAP outlays from FY2022-31 (https://www.whitehouse.gov/wp-content/uploads/2021/08/msr_fy22.pdf).

    Fischer, Bart. “The Trillion Dollar “Farm” Bill“. Southern Ag Today 2(28.4). July 7, 2022. Permalink