Author: Brad Watkins

  • Potential Impact of the Farmer Bridge Assistance Program on Southern U.S. Rice

    Potential Impact of the Farmer Bridge Assistance Program on Southern U.S. Rice

    Low commodity prices, high input costs, and trade market uncertainty have placed significant financial strain on many row crop producers throughout the U.S. In response, the U.S. Department of Agriculture developed the Farmer Bridge Assistance (FBA) program (USDA-FSA, 2025a). The FBA program aims to deliver one-time commodity-specific payments ($/acre) to row crop producers to serve as a financial bridge until the benefits of the One Big Beautiful Bill Act (OBBBA) become available in October 2026 (USDA-FSA, 2025b). Payments will be made to eligible producers based on 2025 planted acres reported to the FSA. Farmers who qualify for the FBA program can expect payments to be released by February 28, 2026 (USDA-FSA, 2025a). On December 31, 2025, the USDA released details on the per-acre payment rates for all eligible row crop commodities (USDA-FSA, 2025b). Rice farmers who qualify for the FBA program will receive a payment rate of $132.89/acre. 

    This article evaluates the impact of the FBA Program on rice returns to operating and total (operating plus fixed) costs in the southern U.S. The analysis is based on average rice production costs and average expected rice yields obtained from 2025 Cooperative Extension rice enterprise budgets from Arkansas, Louisiana, Mississippi, Missouri, and Texas. Seven southern U.S. rice regions are evaluated (Eastern Arkansas, Mississippi Delta, Southeast Missouri, Northeast Louisiana, Southwest Louisiana, Texas Gulf East, and Texas Gulf West). Results for Southwest Louisiana and Texas Gulf West are evaluated for the first crop and for the first crop plus a ratoon crop. Average rice yields, costs, and returns per acre for the analysis are presented below in the accompanying table.

    Figure 1 presents budgeted rice returns to both operating costs and total costs by southern U.S. rice region without assistance from the FBA program. Budgeted returns to both operating costs and total costs are negative for all regions except those located in Louisiana. Operating costs in the Louisiana rice regions are lower due to lower herbicide, fertilizer, and seed costs. 

    Figure 2 presents rice returns to both operating costs and total costs by southern U.S. rice region when assistance from the FBA program is included. Returns to total costs by region are still largely negative except for the Louisiana regions. However, returns to operating costs are either positive or close to breakeven for many of the remaining southern rice regions. 

    It is important to note that these results are from pre-season budget estimates not actual 2025 observations, but they do provide an estimated scope of the FBA program impact in rice.  Results indicate the FBA program may not help with covering total costs in most instances, but would aid in covering most or all of rice operating costs. Thus, the FBA program could help many rice producers obtain operating loans for production inputs, thus allowing them to get a rice crop planted for the 2026 crop year.

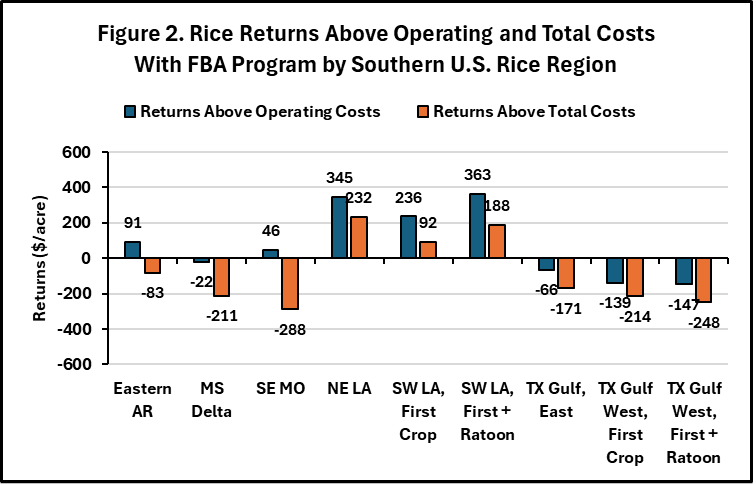
    Table 1. Average Rice Yields, Costs, and Returns by Southern U.S. Rice Region based on State Cooperative Extension Rice Enterprise Budgets, 2025

    RegionYield (cwt/acre)Operating Costs ($/acre)Total Costs ($/acre)Gross Returns ($/acre) Returns Above Operating Costs ($/acre)Returns Above Total Costs ($/acre)
    Eastern AR819471121905-42-216
    MS Delta7610061195851-155-344
    SE MO789531286865-87-420
    NE LA73597710810213100
    SW LA, First Crop72701845804103-41
    SW LA, First + Ratoon988591034108923055
    TX Gulf, East55813918614-199-304
    TX Gulf West, First Crop7010541129782-272-347
    TX Gulf West, First + Ratoon8612411341960-280-381
    Note: Gross returns calculated assuming an average long grain rice price of $11.17/cwt for the months of August – October 2025 (USDA, NASS, 2026). Total costs are calculated as operating plus fixed costs and exclude charges for land and management.  

    References and Resources

    Louisiana State University AgCenter. LSU College of Agriculture. Enterprise Budgets. https://www.lsuagcenter.com/portals/our_offices/research_stations/deanlee/features/enterprise-budgets

    Mississippi State University, Department of Agricultural Economics. Budgets. https://www.agecon.msstate.edu/whatwedo/budgets.php

    Texas A&M Agrilife Extension, Extension Agricultural Economics. Texas Crop and Livestock Budgets. https://agecoext.tamu.edu/resources/crop-livestock-budgets/

    University of Arkansas System Division of Agriculture, Cooperative Extension Service. Crop Enterprise Budgets for Arkansas. https://uaex.uada.edu/farm-ranch/economics-marketing/farm-planning/budgets/crop-budgets.aspx

    University of Missouri Extension. Missouri Crop and Livestock Enterprise Budgets. https://extension.missouri.edu/programs/agricultural-business-and-policy-extension/missouri-crop-and-livestock-enterprise-budgets

    USDA-FSA, 2025a. Farmer Bridge Assistance (FBA) Program. https://www.fsa.usda.gov/tools/informational/fact-sheets/farmer-bridge-assistance-program

    USDA-FSA, 2025b. USDA Announces Commodity Payment Rates for Farmer Bridge Assistance Program. December 31, 2025.  https://www.fsa.usda.gov/news-events/news/12-31-2025/usda-announces-commodity-payment-rates-farmer-bridge-assistance-program

    USDA-NASS (2026). United States Department of Agriculture, Quick-Stats. https://quickstats.nass.usda.gov/


    Watkins, Brad. “Potential Impact of the Farmer Bridge Assistance Program on Southern U.S. Rice. Southern Ag Today 6(4.1). January 19, 2026. Permalink

  • Cash Rents for Irrigated Cropland Across the Mid-South

    Cash Rents for Irrigated Cropland Across the Mid-South

    Cash leases have grown in favor relative to crop share leases in the Mid-South. Eastern Arkansas still has a high proportion of cropland rented under crop share leases (ASFMRA, 2024). In contrast, other regions in the Mid-South have a higher proportion of cropland rented under cash leases (Paulson and Schnitkey, 2016). Much of the impetus for choosing cash leases stems from their simplicity. Crop share arrangements are perceived by some landowners, particularly absentee landlords or non-farm operators, as more difficult to monitor or manage, while tenants may find it easier to bid for additional tracts of land using cash bids. (Bigelow et al., 2016). 

    The amount of cash rent paid for cropland is affected by many factors, including: land productivity, the presence of land improvements (in particular, precision leveling and field typography that allow for greater ease of water flow and drainage for Mid-South crop production), access to groundwater for irrigation, and the ability to grow several different cash crops (or crop diversification). Higher commodity prices and inflation also tend to push cash rents upward, as these have an upward impact on cropland value. 

    This article compares cash rents for irrigated cropland across the Mid-South region, as most Mid-South crops (rice, soybeans, corn, and cotton) are grown with irrigation. County-level irrigated cropland cash rents are obtained for seven Mid-South subregions for the period 2019 – 2025 from the USDA, National Agricultural Statistics Service (USDA, NASS, 2025). Cash rents are averaged across counties within each subregion by year. Figure 1 illustrates the average 2025 irrigated cropland cash rent by subregion.

    Cash rents vary greatly by subregion, largely due to differences in land productivity, irrigation infrastructure, and groundwater availability observed throughout the Mid-South. Average irrigated cropland cash rents in 2025 ranged from $146/acre in East Central Arkansas to $228/acre in Southeast Missouri. The lower average irrigated cropland cash rent in East Central Arkansas reflects a greater proportion of unimproved irrigated cropland in this region relative to Southeast Missouri. Unimproved irrigated cropland is land not conducive to precision leveling because of undulating or rolling terrain with varying slopes (ASFMRA, 2024).

    Nominal annual average irrigated cropland cash rents are presented by Mid-South subregion from 2019 through 2025 in Figure 2. Nominal cash rents significantly increased for all seven subregions during this period (+9% for Southeast Arkansas, +17% for the Mississippi Lower Delta, + 20% for East Central Arkansas, +21% for Northeast Arkansas, +24% for the Mississippi Upper Delta, +25% for Southeast Missouri, and +27% for Northeast Louisiana). Sorting out the cause of rising rental rates is challenging with the combination of increasing crop prices and increasing input costs resulting from market disruptions (the COVID-19 pandemic and the Russian invasion of Ukraine during 2021 and 2022) followed by general inflation across the economy after 2022. 

    Real annual average irrigated cropland cash rents are presented by Mid-South subregion from 2019 through 2025 in Figure 3. Cash rents are adjusted to 2025 dollars using the Gross Domestic Product Price Index (U.S. Bureau of Economic Analysis, 2025). Figure 3 reveals that when adjusting for inflation, cash rents have remained relatively steady since 2019. Thus, the escalation in nominal cash rents observed since 2019 is mostly explained by inflation.


    References and Resources

    ASFMRA (2024). 2024 Mid-South Land Values and Lease Trends Report. American Society of Farm Managers and Rural Appraisers, Mid-South Chapter. https://nationalaglawcenter.org/wp-content/uploads//assets/Conferences/2024-Mid-South-ASFMRA-Land-Values-and-Lease-Trends-Report.pdf

    Bigelow, D., A. Borchers, and T. Hubbs. U.S. Farmland Ownership, Tenure, and Transfer (2016). U.S. Department of Agriculture, Economic Research Service, Economic Information Bulletin No. 161. https://ers.usda.gov/sites/default/files/_laserfiche/publications/74672/EIB-161.pdf?v=75942

    Paulson, N., G. Schnitkey (2016). Farmland Leasing: Where are We Going? Farmland in Perspective. Volume 34, No. 3 https://www.glaubfm.com/sites/default/files/u5/Farmland%20in%20Perspective%20Vol.37%2C%20No.3.pdf

    USDA-NASS (2025). United States Department of Agriculture, Quick-Stats. https://quickstats.nass.usda.gov/

    U.S. Bureau of Economic Analysis (2025). Gross Domestic Product: Chain-type Price Index [GDPCTPI], retrieved from FRED, Federal Reserve Bank of St. Louis. https://fred.stlouisfed.org/series/GDPCTPI


    Watkins, Brad. “Cash Rents for Irrigated Cropland Across the Mid-South.Southern Ag Today 5(48.1). November 24, 2025. Permalink

  • Historic and Current Rice Planting Progress in the Southern United States

    Historic and Current Rice Planting Progress in the Southern United States

    Planting rice in a suitable timeframe is critical for profitable rice production. Planting rice too early or too late can result in significant losses in grain yield and milling quality. The timing of rice planting is strongly impacted by weather, particularly excessive precipitation. Too much precipitation can delay rice planting and can also trigger rice replanting and levee repairs in rice fields. In extreme instances, excessive and persistent precipitation can lead to prevented planted rice acres. For example, prevented planted rice acres in Arkansas reached a record high of 512 thousand acres in 2019 due to flooding and excessive precipitation occurring throughout the growing season (Watkins and Gautam, 2021). The initiation and completion of rice planting in a growing season also varies by geographic location. 

    This article evaluates historic and current rice planting progress for the southern United States (Arkansas, Louisiana, Mississippi, Missouri, and Texas) using weekly crop progress data from the USDA National Agricultural Statistics Service (USDA, NASS 2025). Historical and current weekly rice planting progress curves are presented for each southern rice-producing state in the accompanying figures. Historic rice planting progress is defined as the 10-year average percent of rice area planted by week for the period 2015 – 2024, while current rice planting progress is defined as the percent rice area planted by week for the 2025 growing season. The early and late planting timelines are based on how much land is usually planted each week, adjusted to show either earlier-than-normal or later-than-normal planting by using a typical range of variation. Dates in the figures represent the ending dates for each week evaluated. For example, 20-Apr represents the week of 14-Apr through 20-Apr.

    A few things stand out when looking at the charts of the five states. First, rice plantings begin and end earlier for the more southerly states (Louisiana, Texas) relative to the more northerly states (Arkansas, Mississippi, Missouri), as would be expected. Second, rice planting progress becomes more variable moving south to north. The gaps between early and delayed rice planting curves are wider for Arkansas, Mississippi, and Missouri than for Louisiana and Texas, implying weather variability has a stronger impact on rice plantings in the more northerly states. Third, the timing of variability in rice planting progress is different when moving south to north. The gaps between early and delayed planting curves for Louisiana and Texas are widest during the beginning of rice planting and become narrower thereafter, implying weather variability is more of a factor for both states when rice planting begins. In contrast, gaps between early and late planting curves in Arkansas, Mississippi, and Missouri expand after rice planting starts and are widest during the second week of April through the second to third week of May. Thus, mid-spring weather can greatly accelerate or greatly delay rice plantings in the northern states.Rice plantings in 2025 have concluded or are very close to completion for all five southern rice states as of this writing. How did rice plantings in 2025 compare with historic 10-year averages? The answer of course varies by state. Arkansas and Mississippi experienced intermittent precipitation throughout the 2025 planting season, leading to rice plantings tracking early and behind the 10-year average for both states at different times in the season. Heavy rain events occurred in both states, resulting in planting delays, flooded fields, washed-out levees, and the need for replanting. In Missouri, rain events slowed rice planting during the first three weeks of April, but planting eventually accelerated thereafter to track closely with the 10-year average. Louisiana and Texas rice plantings were at or ahead of the 10-year average during much of the 2025 planting season. 

    References and Resources

    USDA-NASS (2025). United States Department of Agriculture, National Agricultural Statistics Service. Crop Progress. https://usda.library.cornell.edu/concern/publications/8336h188j

    Watkins, K.B., and T.K. Gautam (2021). An Overview of Rice Prevented Planting Acres in Arkansas, 2011 to 2020. In: J. Hardke, X. Sha, and N. Bateman (eds.) B.R. Wells Arkansas Rice Research Studies 2020. Arkansas Agricultural Experiment Station Research Series 676:317-321. Fayetteville. https://scholarworks.uark.edu/aaesser/200/


    Watkins, Brad. “Historic and Current Rice Planting Progress in the Southern United States.” Southern Ag Today 5(26.1). June 23, 2025. Permalink

  • Calculating Equitable Crop Share Leases for Rice in the Mid-South

    Calculating Equitable Crop Share Leases for Rice in the Mid-South

    High input prices in recent years have significantly reduced profit margins for rice producers in the Mid-South. The negative impact of tightening profit margins is felt most acutely by rice producers renting cropland. A significant portion of rice ground in the region is rented using crop share arrangements, and the most common lease used is a net crop share lease. The terms of crop share leases differ by crop and region.  Typically for rice in the Mid-South, the landlord supplies the land and pays all below-ground irrigation expenses (well, pump, gearhead fixed expenses) in exchange for a share of the crop. The tenant pays all above-ground irrigation expenses (irrigation power unit fixed expenses, irrigation energy), supplies all machinery, and pays virtually all variable costs. The rice drying cost is the only variable cost shared between the two parties. Other crop share leases exist where specific costs like fertilizer are shared, but these lease types are less common than the net crop share lease. 

    Net crop shares are very similar throughout the Mid-South. In Eastern Arkansas, the landlord’s share of the rice crop is typically 25%, but 20% crop shares are also common (ASFMRA, 2024). In Northeastern Louisiana, the landlord’s share of the rice crop is typically 20%. Crop share leases are used less frequently in Northwestern Mississippi relative to cash leases, but when a crop share lease is used, the landlord’s share of the rice crop is also typically 20%. 

    Crop share arrangements tend to change little over time, but increasing crop prices, rising input costs, or new technologies make it occasionally necessary to reevaluate the equitability of crop share arrangements for both parties (NCFMEC, 2011). This article demonstrates the contributions approach as a method to calculate equitable crop and cost shares for rice rental leases. The first step is to calculate the percentage contribution provided by each party in value of non-shared expenses.  Remaining shared inputs and income are then shared in the same percentages as the collective non-shared contributions made by both parties. 

    Table 1 demonstrates how the contributions approach reflects the typical net crop share lease used in the Mid-South. In this example, the only cost item shared is drying costs. All other cost items are contributed solely by the landlord or the tenant. Total non-shared contributions equal $1,311, of which the landlord provides $250 (19.1%) and the tenant provides $1,061 (80.9%).  The assumption then would be that drying costs and crop income would appropriately be shared at the same 19.1 / 80.9 percentages, which approaches the 20% landlord, 80% tenant split seen in many net crop share leases in the Mid-South.

    Table 2 shows how the contributions approach may be applied to a crop share arrangement where several cost items are shared between the landlord and the tenant. In this table, the two parties share fertilizer, herbicide, and drying costs. The sharing of fertilizer and herbicide costs between the two parties is in accordance with the concept that yield-increasing inputs should be shared in the same percentage as the crop is shared (NCFMEC, 2011). An argument can be made that irrigation energy costs also fall into this yield-increasing input category. However, the cost of items to be shared or not shared in a crop share lease are based on negotiation between the tenant and the landlord. 

    Note in this example that the landlord’s share of the crop becomes larger when more cost items are shared between the two parties. This result occurs because the total proportion of contributions made by the landlord (particularly the land contribution but also irrigation wells) becomes larger when more costs are shared between the two parties. The equitable crop shares for each party, based on Table 2, are 24.5% of the gross returns for the landlord and 75.5% of the gross returns for the tenant.

    Table 1. Rice Net Crop Share Lease (Only Drying Expenses Shared)
     Cost Items  Annual Cost aLandlord ContributionTenant Contribution
    Non-Shared Items: $/acre 
    Land ($5,963/acre * 3.619%) b216216
    Machinery Fixed Expenses7979
    Machinery Repairs and Maintenance1818
    Irrigation Fixed Expenses (Well, Pump, Gearhead)3434
    Irrigation Fixed Expenses (Power Unit)2222
    Irrigation Repairs and Maintenance88
    Survey and Mark Levees55
    Labor5555
    Management (180 bu/ac * $6.75/bu * 7.5%) c9191
    Seed136136
    Fertilizer160160
    Herbicides130130
    Insecticide99
    Fungicide1010
    Fuel2020
    Irrigation Energy Costs129129
    Crop Insurance1010
    Scouting/Consultant Fee88
    Operating Interest3535
    Custom Machinery Hire8787
    Hauling4949
    Total Non-Shared Costs1,3112501,061
    Percent of Specified Costs100.00%19.1%80.9%
    Shared Items:$/acre
    Drying721458
    Total Shared Costs721458
    Total Shared and Non-Shared Costs1,3832641,120
    Percent of Specified Costs100.00%19.1%80.9%
    Gross Return (180 bu/ac * $6.75/bu)1,215232983
    Annual cost items except Land and Management are rice production costs averaged across 2024 University of Arkansas rice crop enterprise budgets.
    b The land charge is calculated as the average value for irrigated cropland in Eastern Arkansas reported in ASFMRA (2024) ($5,963/acre) multiplied by the rent-to-value ratio for irrigated cropland obtained from USDA NASS Arkansas (2024) ($152/acre cash rent divided by $4,200/acre for irrigated cropland).
    c The management charge is calculated as rice gross return multiplied by the mid-range of charges for professional farm managers (5 to 10%) reported in NCFMEC (2011).
    Table 2. Rice Cost Share Lease (Fertilizer, Herbicide, and Drying Costs Shared)
     Cost Items  Annual Cost aLandlord ContributionTenant Contribution
    Non-Shared Items: $/acre 
    Land ($5,963/acre * 3.619%) b216216
    Machinery Fixed Expenses7979
    Machinery Repairs and Maintenance1818
    Irrigation Fixed Expenses (Well, Pump, Gearhead)3434
    Irrigation Fixed Expenses (Power Unit)2222
    Irrigation Repairs and Maintenance88
    Survey and Mark Levees55
    Labor5555
    Management (180 bu/ac * $6.75/bu * 7.5%)9191
    Seed136136
    Insecticide99
    Fungicide1010
    Fuel2020
    Irrigation Energy Costs129129
    Crop Insurance1010
    Scouting/Consultant Fee88
    Operating Interest3535
    Custom Machinery Hire8787
    Hauling4949
    Total Non-Shared Costs1,021250771
    Percent of Specified Costs100.00%24.5%75.5%
    Shared Items:$/acre
    Fertilizer16039121
    Herbicides1303299
    Drying721854
    Total Shared Costs36289274
    Total Shared and Non-Shared Costs1,3833391,044
    Percent of Specified Costs100.00%24.5%75.5%
    Gross Return (180 bu/ac * $6.75/bu)1,215298917
    a Annual cost items except Land and Management are rice production costs averaged across 2024 University of Arkansas rice crop enterprise budgets.
    b The land charge is calculated as the average value for irrigated cropland in Eastern Arkansas reported in ASFMRA (2024) ($5,963/acre) multiplied by the rent-to-value ratio for irrigated cropland obtained from USDA NASS Arkansas (2024) ($152/acre cash rent divided by $4,200/acre for irrigated cropland).
    c The management charge is calculated as rice gross return multiplied by the mid-range of charges for professional farm managers (5 to 10%) reported in NCFMEC (2011).

    References and Resources

    ASFMRA (2024). 2024 Mid-South Land Values and Lease Trends Report. American Society of Farm Managers and Rural Appraisers, Mid-South Chapter. https://nationalaglawcenter.org/wp-content/uploads//assets/Conferences/2024-Mid-South-ASFMRA-Land-Values-and-Lease-Trends-Report.pdf

    NCFMEC (2011). Crop Share Rental Agreements for Your Farm. North Central Farm Management Extension Committee. NCFMEC-02. https://aglease101.org/wp-content/uploads/2020/10/NCFMEC-01.pdf

    USDA-NASS Arkansas (2024). United States Department of Agriculture, National Agricultural Statistics Service, Arkansas Field Office. https://www.nass.usda.gov/Statistics_by_State/Arkansas/index.php

    UTIA (2013). Crop-Share Leases. The University of Tennessee Institute of Agriculture. UT Extension PB 1816-E. https://utia.tennessee.edu/publications/wp-content/uploads/sites/269/2023/10/PB1816-C.pdf


    Watkins, Brad. “Calculating Equitable Crop Share Leases for Rice in the Mid-South.Southern Ag Today 5(7.1). February 10, 2025. Permalink

  • Irrigation Water Pumping Costs in the Mid-South

    Irrigation Water Pumping Costs in the Mid-South

    Irrigation water is a significant resource for row crop agriculture in the Mid-South (Eastern Arkansas, Northeastern Louisiana, Northwestern Mississippi, and Southeastern Missouri). The primary crops grown in the region are rice, soybeans, cotton, and corn. All rice acres and most soybean, corn, and cotton acres in the region are irrigated. The region’s primary irrigation source is groundwater pumped from the Mississippi River Valley alluvial aquifer (MRVAA) (Massey et al., 2017). Pumping costs vary greatly throughout the region depending on the crop grown, the mode of power used to pump the water, and the pumping depth of water. This article looks more closely at the range of pumping costs for the Mid-South.

    Table 1 presents the estimated costs per acre of pumping irrigation water for the four major crops grown in the Mid-South by energy source (diesel, electric) and by total dynamic head (TDH) (depth to water plus drawdown and discharge pressure). Crop irrigation amounts (acre-inches) represent average amounts reported for each crop in enterprise budgets from both the University of Arkansas and Mississippi State University. A diesel price of $3.54/gallon is used to calculate diesel pumping costs, while an electric price of $0.138/kWh is used to calculate electric pumping costs. The amount of diesel and electric energy used to pump irrigation water for a given TDH is based on irrigation energy consumption data for alluvial wells from McDougal (2015). 

    Diesel power is currently more expensive than electric power. Farmers in the region have switched many of their diesel irrigation motors to electric motors because of the lower cost of electricity, but diesel is still prevalent due to the expense of running electricity to fields located far from electric utility lines. The proportion of diesel to electric pumps can vary greatly by farm in the region.

    Pumping costs can vary greatly depending on geographic location and groundwater availability. To demonstrate this, Figures 1 and 2 present estimated average pumping costs per acre for rice and soybeans by county in Eastern Arkansas. Estimated average pumping costs in these figures assume half diesel and half electric power and are calculated using depth-to-water data from the Arkansas Groundwater Protection and Management Report for 2023 (Arkansas Department of Agriculture, NRD, 2024). Average depth-to-water values for each county are adjusted upward to TDH by adding 28 feet to account for drawdown and discharge pressure (Chris Henry, University of Arkansas Water Management Engineer, personal communication). Counties with a darker shade of red in both figures have the highest average pumping costs. Groundwater is more limiting for these counties relative to counties where water is more plentiful (counties with a lighter shade of red). Less groundwater translates into deeper pumping depths, making irrigation water more expensive in locations where water is more limiting.

    References and Resources

    Arkansas Department of Agriculture, Natural Resources Division (2024). Arkansas Groundwater Protection and Management Report 2023. https://www.agriculture.arkansas.gov/wp-content/uploads/2023-Groundwater-Report-Final.pdf

    McDougall, W. M. (2015). A Pump Monitoring Approach to Irrigation Pumping Plant Performance Testing. Graduate Theses and Dissertations Retrieved from https://scholarworks.uark.edu/etd/1146

    Massey, J.H., C.M. Stiles, J.W. Epting, R.S. Powers, D.B. Kelley, T.H. Bowling, C.L. Janes, and D.A. Pennington (2017). Long-Term Measurements of Agronomic Crop Irrigation Made in the Mississippi Delta Portion of the Lower Mississippi River Valley. Irrigation Science. 35:297-313. 


    Watkins, Brad. “Irrigation Water Pumping Costs in the Mid-South.Southern Ag Today 4(36.3). September 4, 2024. Permalink