Author: Cesar Escalante

  • Understanding the H-2A Labor Affordability Issue

    Understanding the H-2A Labor Affordability Issue

    Foreign workers hired under the H-2A Guest Farm Worker program are assured of being paid at least the Adverse Effect Wage Rates (AEWRs) determined through a federally designed mechanism.  The AEWR determination process serves a two-fold objective: (1) to look after foreign workers’ welfare by assuring they are paid at just, fair wage levels and (2) to ensure that H-2A wages would not “adversely” affect U.S. farm labor market conditions, which could happen if such workers are paid at very low wages that could depress the domestic workers’ market wage rates.

    Except for AEWRs set monthly for range occupations (i.e. farms engaged in herding or livestock production operations performed on a range), the wages of the majority of H-2A hires are guided by a single annual rateprescribed for 18 farming territories – consisting of 3 states (California, Florida, and Hawaii) and 15 regions (Figure 1).  Under existing H-2A program guidelines, the AEWR for the current year is derived from the average wage data collected by the National Agricultural Statistics Service (NASS) in the preceding year’s Farm Labor Survey (FLS). A singular state/regional AEWR for non-range field and livestock workers (for such farm work positions as graders, sorters, equipment operators, crop/nursery/greenhouse workers, ranch/aquaculture farm workers, packers, and packagers) is derived as the average of the FLS wage data for six Standard Occupational Classification (SOC) codes and titles.

    Despite its economic and market arguments, the AEWR-setting mechanism often drew criticisms. Some contend that state/regional-level AEWRs could be too high.  This especially applies to the last two years, when some farming territories experienced abrupt, radical spikes in their AEWRs.  This year, the prevailing national AEWR is $17.74 per hour, which is 18.01% over the 2022 rate and translates to an annual average nominal growth of 5.68% over the last three years.  This rate exceeds historical nominal AEWR growth trends estimated at only 3.52% between 1991 and 2022.  

    In understanding the H-2A affordability issue, the following issues need to be clarified.  

    • First, AEWR hikes are market-determined and reflect the previous year’s elevated market equilibrium rates.  It follows that higher AEWRs indicate an aggressive farm labor market, where domestic workers are paid higher wages for farm jobs.
    • Second, the H-2A affordability issue under rising AEWRs becomes more concerning when the program’s mandated comprehensive compensation package is accounted for in the compensation equation.  Calvin, Martin, and Simnitt (2022) estimate a 5% wage premium added to the AEWR when calculating total H-2A compensation.  The suggested premium accounts for the mandated additional H2A fringe benefits (including housing, meals, transportation, and insurance) that could add $2.55 per hour in hourly wages but also considers offsetting employers’ benefits realized from non-payment of SS & unemployment taxes.
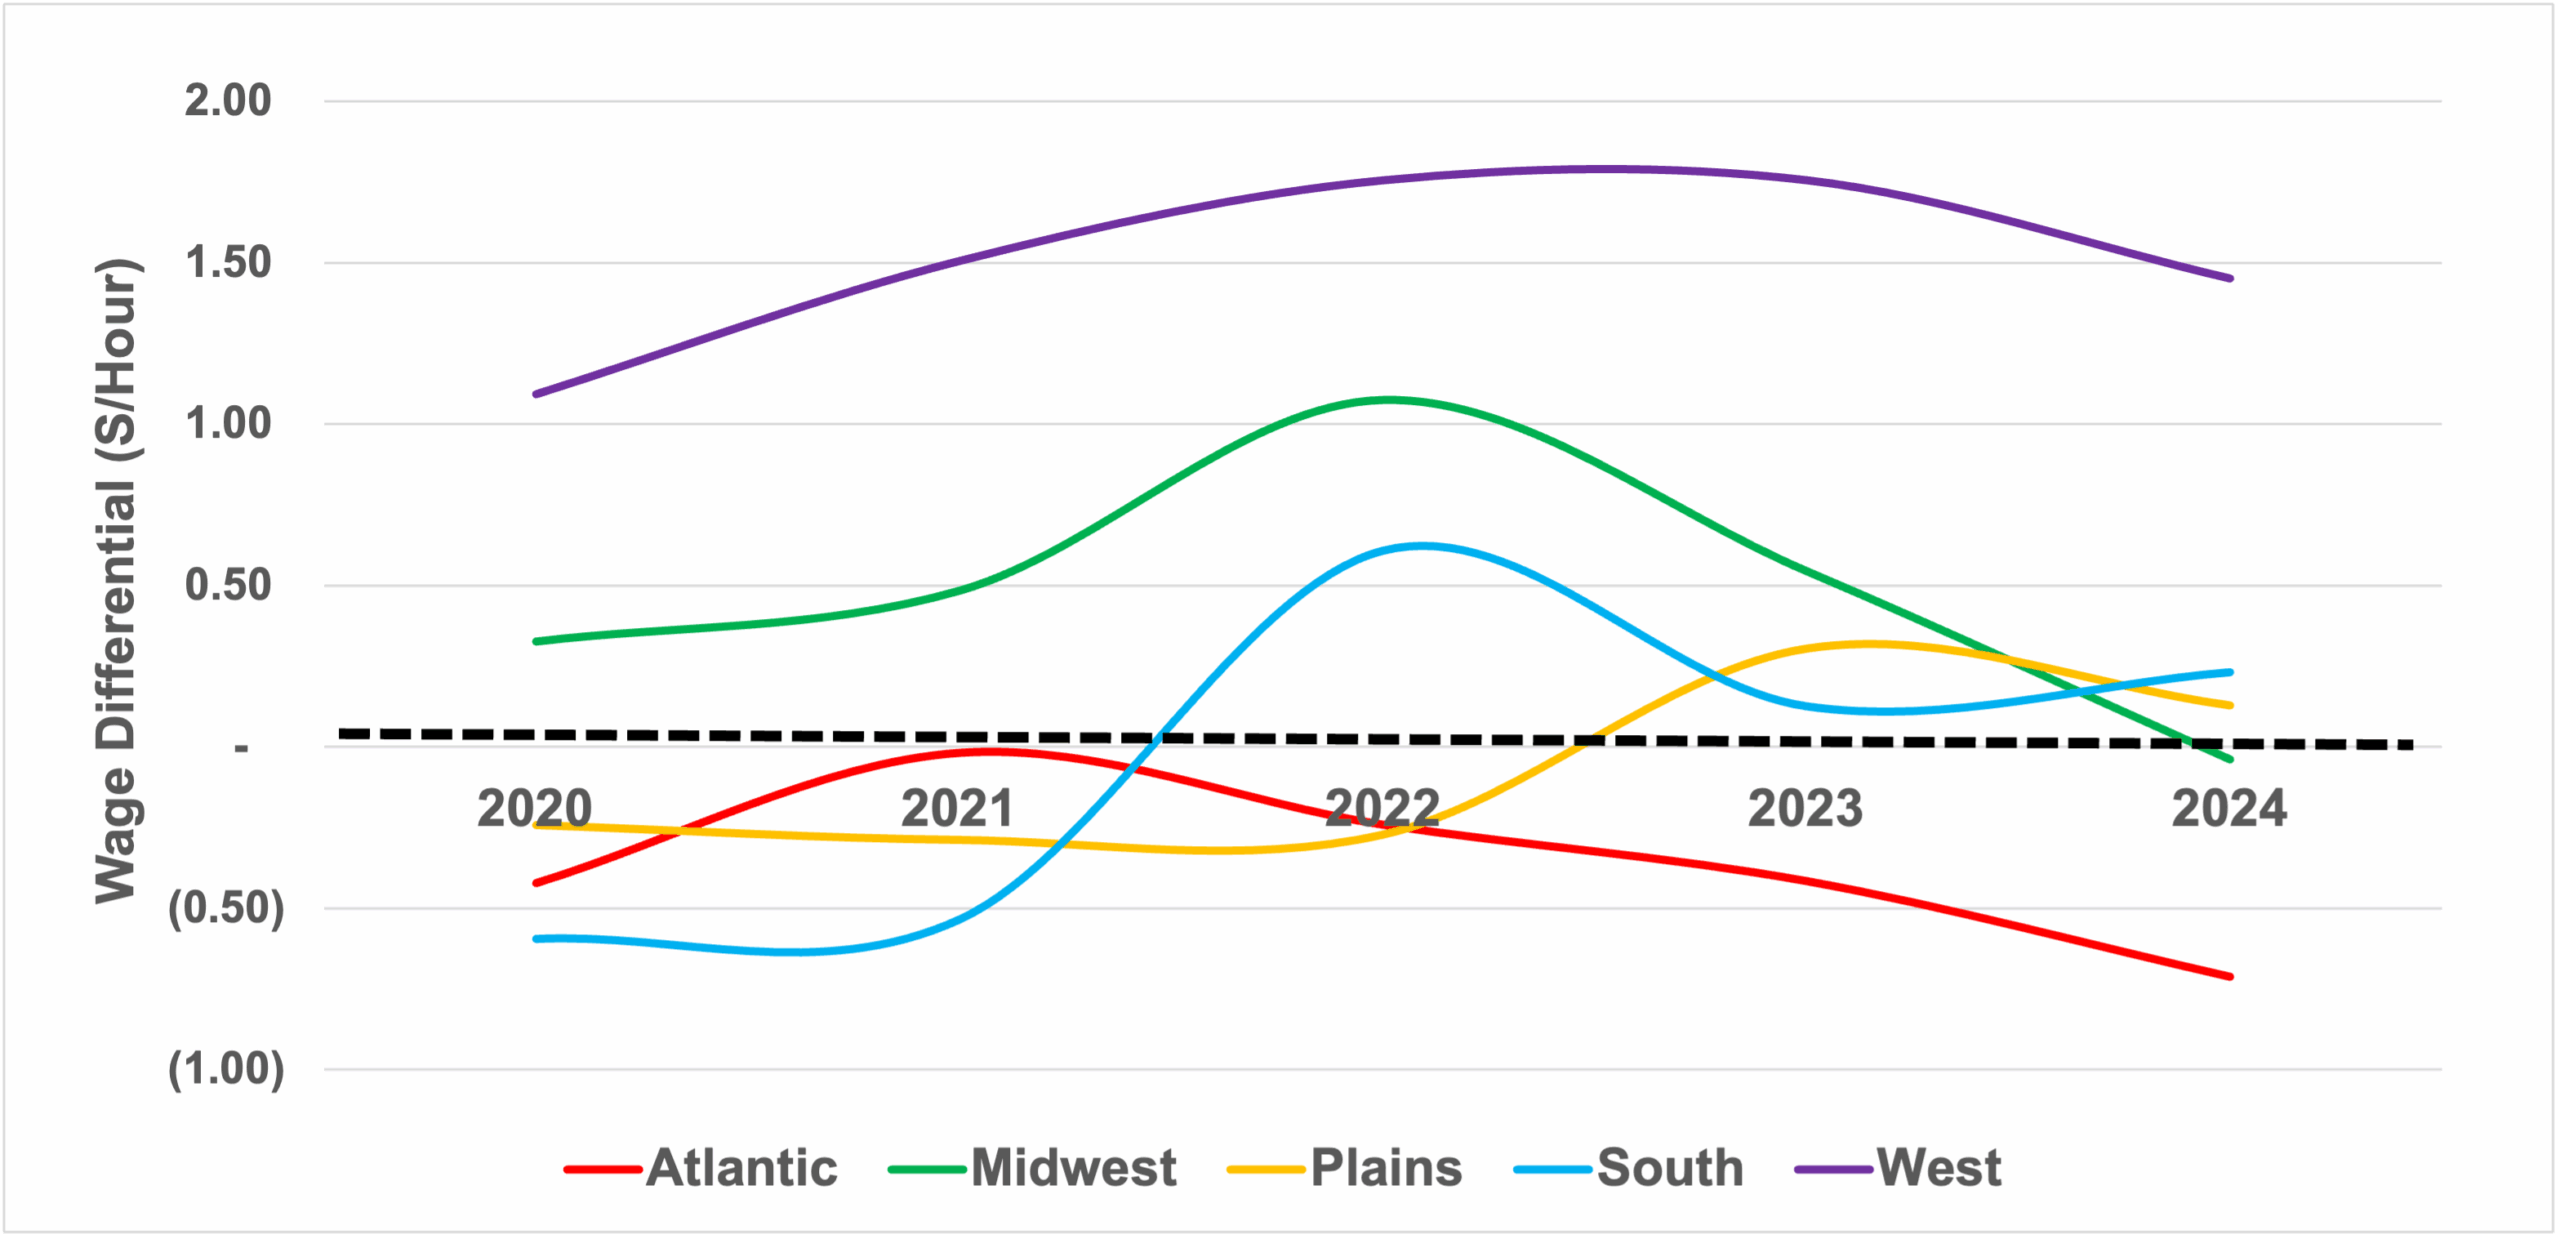
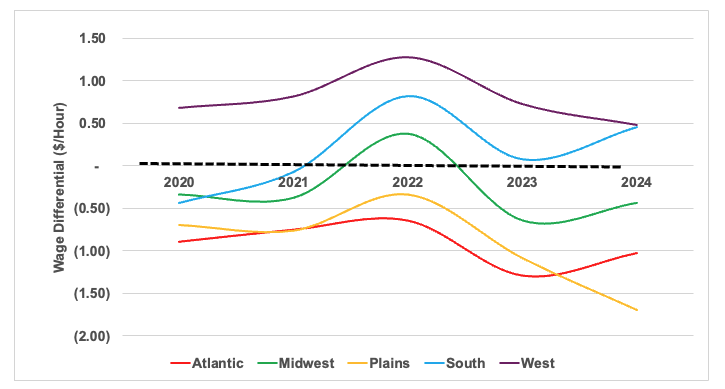
    • Finally, there is the aggregation issue employed in the existing AEWR determination process.  Geographic aggregation (AEWRs for 18 geographic entities) raises questions on whether an AEWR set for several states in a region accurately captures local labor market conditions at the state level. 

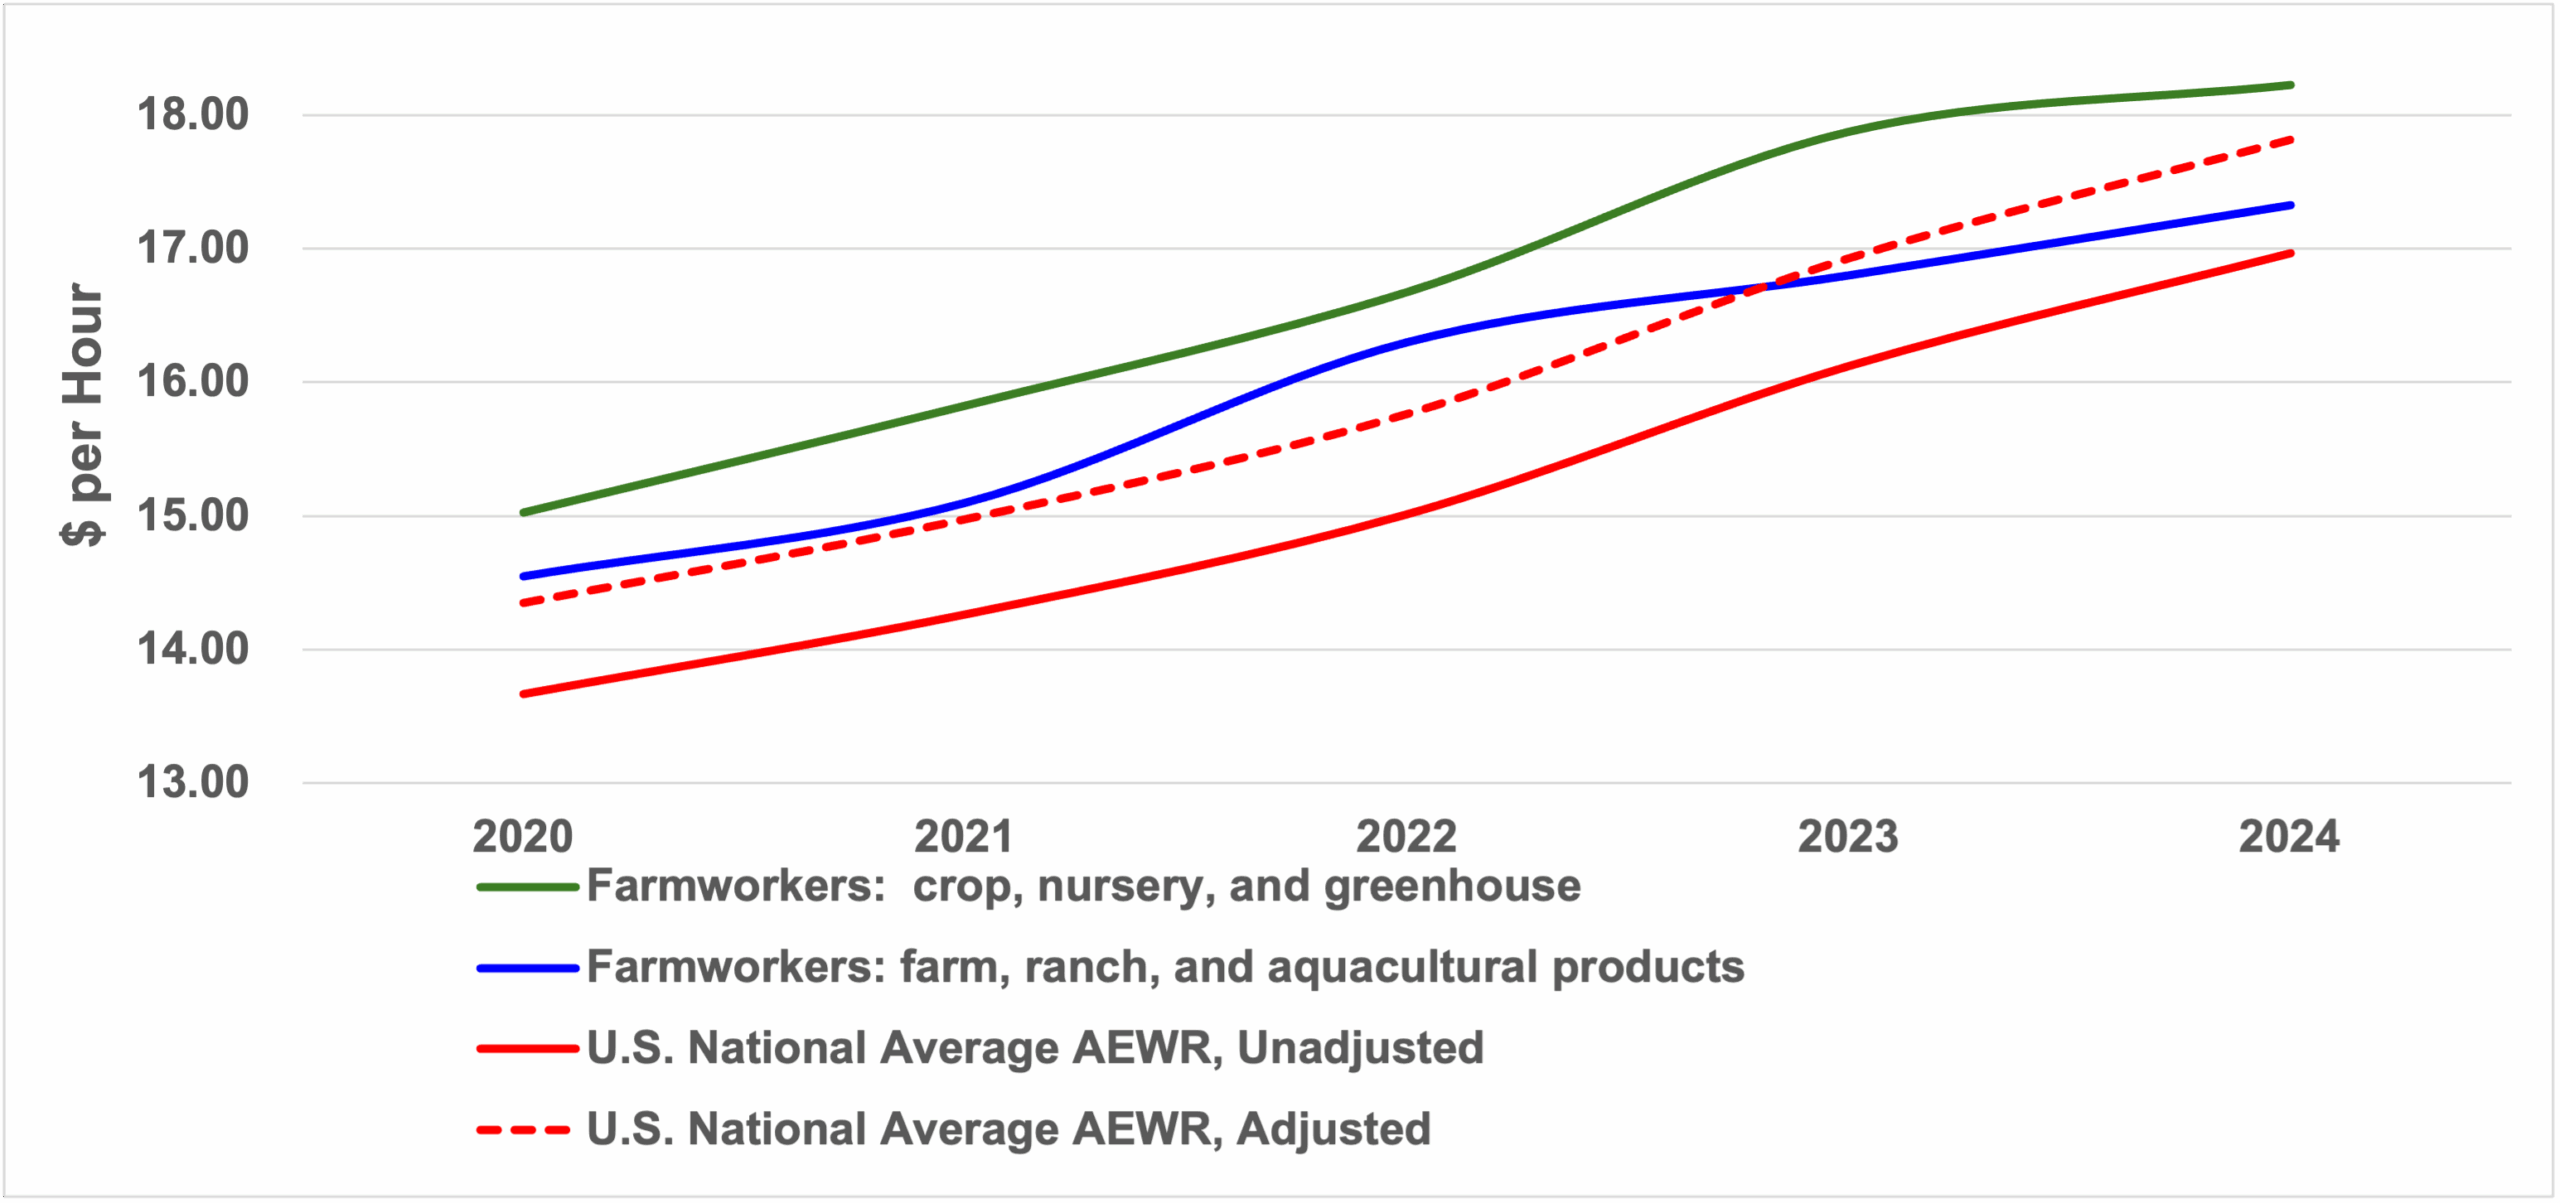
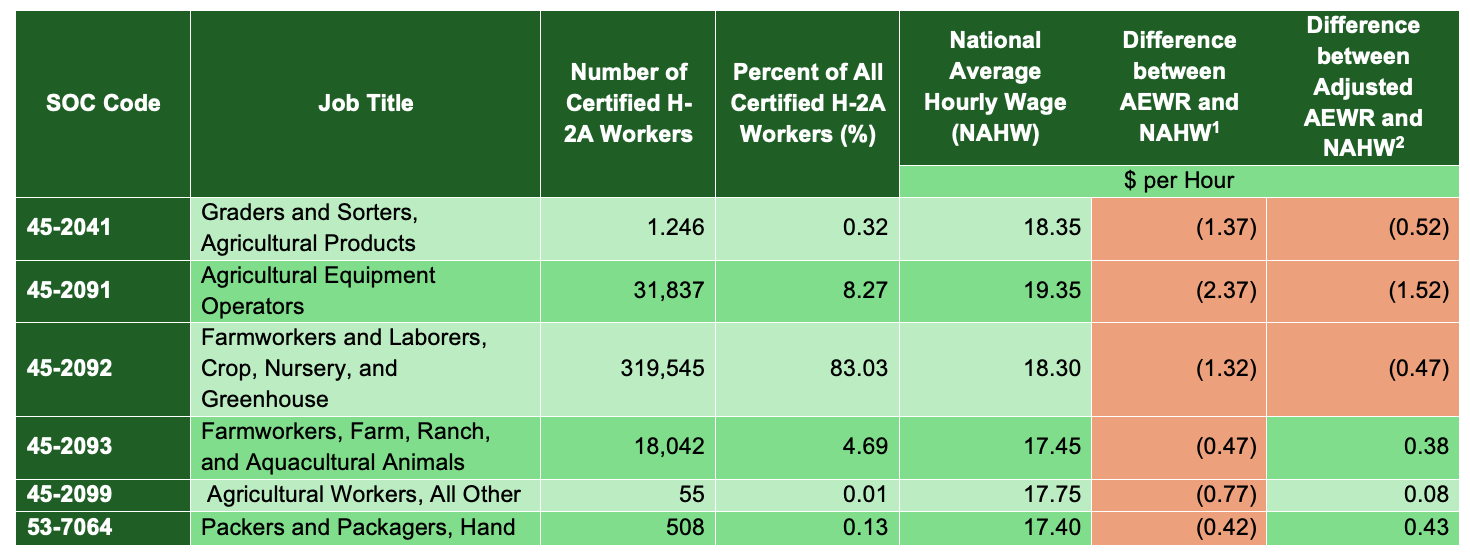
    In this article, we investigate another form of aggregation that sets one AEWR for all types of jobs and industry employers based on wage data collected from a selected core of 6 SOC-classified jobs.  Table 1 shows that the selected six SOC job titles comprise the bulk (96.46%) of all H-2A workers hired in 2024.  The resulting differentials between the national average AEWR for 2024 ($16.98 per hour) and the average hourly wage for each SOC job category are all negative, thus establishing a cheaper H-2A hiring option since AEWR is consistently lower than all six domestic farm wage rates.  When the H-2A mandated comprehensive remuneration package with fringe benefits is included in the equation (“adjusted AEWR” in Table 1), three negative wage differential results are registered (meaning H-2A labor is cheaper than domestic labor).  Notably these negative results apply to three SOC job positions that comprise 91.62% of all H-2A hires in 2024.  

    All told, our analysis makes an important clarification on the affordability of H-2A workers.  Our results indicate that at the national level, most U.S. farm employers of H-2A workers in 2024 find that such employment decisions have not been generally more costly than the domestic farm employment option. However, we qualify our deduction by clarifying that our analysis here is confined only to the aggregation of job categories and farm industries.  Our further research in this area will attempt to validate if such trends in wage differentials and their implications on H-2A labor affordability persist at the state-level under more differentiated, localized farm labor market dynamics and conditions.

    Figure 1.  State and Regional Adverse Effect Wage Rates, 2025

    Sources:  American Farm Bureau Federation and USDA-National Agricultural Statistics Service

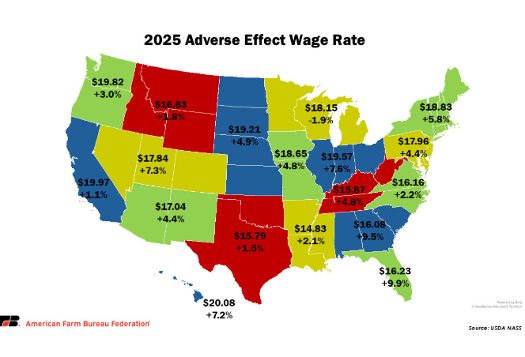
    Table 1.  H-2A Employment, National Average Wages, and Wage Differentials Relative to AEWR under the Standard Occupational Classification (SOC) Codes Used in the AEWR Formula, 2024

    SOC CodeJob TitleNumber of Certified H-2A WorkersPercent of All Certified H-2A Workers (%)National Average Hourly Wage (NAHW)Difference between AEWR and NAHW1Difference between Adjusted AEWR and NAHW2
    $ per Hour
    45-2041Graders and Sorters, Agricultural Products1.2460.3218.35(1.37)(0.52)
    45-2091Agricultural Equipment Operators31,8378.2719.35(2.37)(1.52)
    45-2092Farmworkers and Laborers, Crop, Nursery, and Greenhouse319,54583.0318.30(1.32)(0.47)
    45-2093Farmworkers, Farm, Ranch, and Aquacultural Animals18,0424.6917.45(0.47)0.38
    45-2099 Agricultural Workers, All Other550.0117.75(0.77)0.08
    53-7064Packers and Packagers, Hand5080.1317.40(0.42)0.43
    Notes:  1 The 2024 national AEWR is $16.98/hour.
    2  The 2024 AEWR is adjusted by a 5% incremental factor to account for H-2A’s mandated fringe benefits (housing, meals, transportation, and health insurance, among others)
    Sources:  USDA National Agricultural Statistics Service and Department of Labor

    Table 1.(Image Format) H-2A Employment, National Average Wages, and Wage Differentials Relative to AEWR under the Standard Occupational Classification (SOC) Codes Used in the AEWR Formula, 2024

    References:

    Calvin, L., P. Martin, and S. Simnitt. (2022). Adjusting to Higher Labor Costs in Selected U.S. Fresh Fruit and Vegetable Industries. EIB-235, Economic Research Service, U.S. Department of Agriculture, Washington, DC.


    Escalnate, Cesar L., Naimul Bhuiyan, and Joshua Emmanuel. “Understanding the H-2A Labor Affordability Issue.Southern Ag Today 5(39.1). September 22, 2025. Permalink

  • Relating Crop and Livestock H-2A Labor Decisions to AEWR and Sectoral Wage Gaps

    Relating Crop and Livestock H-2A Labor Decisions to AEWR and Sectoral Wage Gaps

    This article extends the regional and industry concentration analysis of H-2A patronage trends laid out in a previous Southern Ag Today article. Given the larger shares of the Southern region and crop industries in total H-2A employment figures, we offer some wage-based explanations for these patronage trends.  

    H-2A employment decisions are anchored on the adverse effect wage rate (AEWR) principle, which was conceived to specifically revert any possible market anomaly when foreign workers are hired under the H-2A program. The Department of Labor (DOL) was tasked to issue a fixed wage rate (AEWR) to mitigate adverse effects on local labor market conditions that may be caused by the employment of underpaid alien workers. A current year’s AEWR is determined based on the results of the previous year’s Farm Labor Survey conducted by the U.S. Department of Agriculture (USDA) among farms with annual sales of $1,000 or more (USDA, 2023). For farm work not devoted to herding or production of livestock on the range (non-range occupations that comprise the bulk of H-2A employers),[1] AEWRs are set at the state level and enforced to apply to all workers regardless of nationality. 

    Figure 1 plots national average wages over a five-year period (2020-2024) for two farm work positions: farmworkers in crop, nursery, and greenhouse operations (usually accounting for more than 80% of all H-2A workers hired) and farmworkers in farms producing ranch and aquacultural products (which are positions held by about 4% of all H-2A workers). These wages are compared to the national average of state-level AEWRs.  An adjusted AEWR level is added to the analysis to account for discrepancies between labor remuneration packages offered to domestic and H-2A workers.  The latter not only receive wages conforming to the AEWR benchmark but are also provided with housing, transportation, meal allowances, and fringe benefits as mandated by the program.  The plots in Figure 1 indicate that crop, nursery, and greenhouse workers were consistently paid higher than H-2A workers in all years, while the adjusted H-2A wages only exceeded average livestock wages in 2023 and 2024.

    The regional wage analyses provide some deviations from the earlier trends (Figure 1), which could be influenced by regional variations in demographic, structural, and economic conditions affecting H-2A employment decisions. Figures 2 and 3 present plots of the domestic wage-AEWR differentials using regional average field and livestock wages, respectively, over the same five-year period.  In these plots, a positive gap indicates a higher regional field/livestock wage than its average AEWR.  

    In Figure 2 (field workers’ wages), the South region’s wage differential is positive only in 2022, while remaining negative in other years. The West, which is the second most popular regional H-2A employer, has consistently maintained a positive field wage-AEWR gap in all years. These trends indicate that while the West farms’ decisions to hire H-2A workers for field work may be motivated by wage considerations (where H-2A labor is cheaper than domestic labor), the South’s decision to hire more expensive H-2A field workers in certain years could have been driven by non-wage factors. Some analysts argue that the higher labor productivity of more expensive H-2A workers rationalizes some farms’ preference for these workers.

    In Figure 3, the South posted slightly negative domestic livestock wage-AEWR differentials in 2020 and 2021; it maintained a positive gap for the rest of the period.  The West again maintained a positive gap during the entire period. These trends reveal some unique employment predicaments in livestock industries. Given that livestock farms in the country usually rely less on H-2A labor and would rather employ domestic residents, these decisions persist even when domestic livestock wages are higher than the adjusted AEWR.  Compared to crop farms, livestock farms are more inclined to seek workers and employ them for a longer tenure as their operations have longer business and production cycles.  These farms usually lure prospective workers with training offers that could upgrade their skills and job classification (from unskilled to better paying skilled positions).  A follow-up article will present more detailed evidence on livestock farms’ domestic and foreign labor hiring practices.


    Figure 1.  Adverse Effect Wage Rates (AEWRs) and Farmworkers’ Wages in Crop and Livestock Farms, U.S. Average, 2020-2024

    Sources:  National Agricultural Statistics Service, U.S. Department of Agriculture and Department of Labor
     
    Note: Adjusted AEWRs include a 5% wage premium of AEWR over domestic wages as determined by Calvin, Martin, and Simnitt (2022).   These authors estimate that when all H-2A fringe benefits are factored into the equation, these foreign workers receive a wage premium of $2.55 per hour over their domestic counterparts.  However, H-2A employers are not liable to pay Social Security or Federal Unemployment Insurance taxes, thus realizing an 8% saving on payroll taxes.  Such tax benefit minimizes the H-2A-domestic wage differential to just about 5 percent. 

    Figure 2.  Gaps Between Adverse Effect Wage Rates (AEWRs) and Field Workers’ Wages, By Production Region, 2020-2024

    Sources:  National Agricultural Statistics Service, U.S. Department of Agriculture and Department of Labor
     
    Notes:  (1)  The regional classification of U.S. states are as follows:  ATLANTIC states include North Carolina, Virginia, West Virginia, Maryland, Connecticut, Massachusetts, New York, Vermont, New Hampshire, Maine, New Jersey, Rhode Island, and Delaware; MIDWEST states are Minnesota, Iowa, Wisconsin, Illinois, Missouri, Indiana, Ohio, Pennsylvania, and Michigan; PLAINS states are Nebraska, Kansas, Texas, North Dakota, South Dakota, and Oklahoma; WEST states include California, Washington, Oregon, Idaho, Montana, Wyoming, Colorado, New Mexico, Arizona, Utah, Nevada, Alaska, and Hawaii; and the SOUTH states are Arkansas, Florida, Georgia, Louisiana, Mississippi, Alabama, Tennessee, South Carolina, and Kentucky.
     
                (2) The Wage Gaps are calculated as the difference between Field Workers’ Wages and AEWR.  A positive gap indicates that field workers’ wages are higher than AEWR.

    Figure 3.  Gaps Between Adverse Effect Wage Rates (AEWRs) and Livestock Workers’ Wages, By Production Region, 2020-2024

    Sources:  National Agricultural Statistics Service, U.S. Department of Agriculture and Department of Labor
     
    Notes:  (1)  The regional classification of U.S. states are as follows:  ATLANTIC states include North Carolina, Virginia, West Virginia, Maryland, Connecticut, Massachusetts, New York, Vermont, New Hampshire, Maine, New Jersey, Rhode Island, and Delaware; MIDWEST states are Minnesota, Iowa, Wisconsin, Illinois, Missouri, Indiana, Ohio, Pennsylvania, and Michigan; PLAINS states are Nebraska, Kansas, Texas, North Dakota, South Dakota, and Oklahoma; WEST states include California, Washington, Oregon, Idaho, Montana, Wyoming, Colorado, New Mexico, Arizona, Utah, Nevada, Alaska, and Hawaii; and the SOUTH states are Arkansas, Florida, Georgia, Louisiana, Mississippi, Alabama, Tennessee, South Carolina, and Kentucky.
     
                (2) The Wage Gaps are calculated as the difference between Livestock Workers’ Wages and AEWR.  A positive gap indicates that livestock workers’ wages are higher than AEWR.’

    [1] Distinctions in AEWR-setting are made between range and non-range occupations. Non-range workers are employed under jobs with the following Standard Occupational Classification (SOC) titles:  graders and sorters of agricultural products; agricultural equipment operators; farmworkers and laborers in crop, nursery, and greenhouse; farmworkers in the farm, ranch, and aquacultural animals; packers and packagers (hand); and all other agricultural workers (Congressional Research Service, 2023).

    References:

    Calvin, L., P. Martin, and S. Simnitt. (2022). Adjusting to Higher Labor Costs in Selected U.S. Fresh Fruit and Vegetable Industries. EIB-235, Economic Research Service, U.S. Department of Agriculture, Washington, DC.

    Congressional Research Service. (2023) Adverse Effect Wage Rate (AEWR) Methodology for Temporary Employment of H-2A Nonimmigrants in the United States. Washington DC.  Available online at https://crsreports.congress.gov | IF12408. Accessed on August 3, 2023.


    Escalante, Cesar L., and Alejandro Guitierrez-Li. “Relating Crop and Livestock H-2A Labor Decisions to AEWR and Sectoral Wage Gaps.Southern Ag Today 5(18.1). April 28, 2025. Permalink

  • H-2A Wage Violations Against Workers Hired by Farm Labor Contractors

    H-2A Wage Violations Against Workers Hired by Farm Labor Contractors

    This article is a companion to the article titled: Hiring H-2A Workers through
    Farm Labor Contracts
     published in Southern Ag Today on July 24, 2024.

    The role of Farm Labor Contractors (FLCs) in hiring foreign workers under the H-2A Temporary Guest Foreign Farm Worker Visa Program has grown considerably in recent years.  FLCs’ share in the annual total employment of H-2A workers has grown from 17% in 2007 to 44 % in 2022 (Castillo, Martin, and Rutledge, 2022).  FLCs’ increasing involvement in H-2A hiring coincides with the program’s rapid growth in patronage in recent years.  Between 2017 and 2022, H-2A labor certifications grew by 64.7% (American Immigration Council, 2024).

    There are logical grounds for the relevance of the FLC alternative under the H-2A program.  Compared to potential individual farmer employers of H-2A workers, FLCs have extensive social and business networks in foreign labor markets. FLCs’ greater familiarity and good connections with foreign workers enable them to lure and recruit residents, especially those in rural communities overseas, to consider H-2A employment in the U.S. that offers potential significant economic relief to their families. 

    A cursory review of wage violation data compiled by the Department of Labor’s Wage and Hour Division (WHD),[1] however, indicates the consistent recurrence of FLC-hired H-2A workers in the wage violation cases apprehended by the agency.  According to the wage violation data summary in Table 1, H-2A-related wage violations account for 33.86% (2016) to 73.44% (2022) in terms of number of affected workers in the agricultural sector during the period 2016 to 2023.  In terms of nominal back wages, the program’s share ranges from 29.96% (2016) to 69.70% (2021).  Within the H-2A program, FLC employment’s share in the number of workers with back wages ranges from 27.30% (2022) to 35.03% (2020), while its back wages account for about 14.63% (2022) to 36.42% (2018) of all H-2A back wages.  

    Figure 1 presents a comparison of the extent of FLC and non-FLC wage violation cases.  The trend lines indicate that more workers are usually affected in FLC cases (annual counts of 34 to 56 per case) than in non-FLC cases (11 to 36 workers per case).  Based on the bar plots, FLC cases involve larger nominal wage violations than non-FLC cases in most years analyzed.  

    Figure 1.  H-2A Wage Violations Associated with Farm Labor Contracting, 2016-2023

    Source:  Department of Labor, Wage and Hour Division

    Anecdotal evidence collected from various workers’ accounts and popular media coverage expose at least two types of H-2A wage violations associated with the FLC hiring scheme: petition padding (requesting more workers than needed) and collection of illegal recruitment fees (usually at exorbitant rates) (Grinspan, 2023; Vasquez, 2023; CDM, 2020).  Consequently, some foreign workers begin their work contracts already heavy in debt (because of illegal recruitment fees); some end up receiving less than the “promised” wages; while others find themselves either underemployed or unemployed (when FLCs could not place them in their original work destinations because labor petition padding practices).

    Policymakers must revisit and consider modifying existing regulations on FLCs’ involvement in the H-2A program. In addition to imposing stiffer sanctions and penalties on violations, policies must also launch more effective employer compliance audits. To accomplish this, the government would have to seriously consider expanding its current funding and resource allocation to WHD.  Currently, WHD’s case investigations capture only about 1% of all agricultural employers in the country, as its 2022 budget has not grown since 2006, while its 810 employees are overburdened in handling more than 200,000 cases each (Costa and Martin, 2023).

    [1] WHD is a government agency that oversees the protection of workers’ rights.

    References:

    American Immigration Council (2024). “The Expanding Role of H-2A Workers in U.S. Agriculture.” Available online at https://www.americanimmigrationcouncil.org/research/h-2a-workers-us-agriculture#:~:text=Between %202017%20and%202022%2C%20the,to%20fill %20its%20open%20jobs. Accessed on November 11, 2024.

    Castillo, M., P. Martin, and Z. Rutledge. (2022).  The H-2A Temporary Agricultural Worker Program in 2020.  Economic Information Bulletin #238, Economic Research Service, U.S. Department of Agriculture.  Washington, DC.

    Centro de los Derechos del Migrante, Inc. (CDM) (2020). Ripe for Reform: Abuses of Agricultural Workers in the H-2A Visa Program. Centro de los Derechos del Migrante, Inc., Baltimore, MD; Oaxaca, Mexico; Mexico City, Mexico.

    Costa, D. and P. Martin. (2023). Record-low number of federal wage and hour investigations of farms in 2022.  Economic Policy Institute.  Washington, DC.

    Grinspan, L. (2023). “They all went away:  Why some foreign farmworkers end up leaving the fields.”  Atlanta Journal Constitution.  Available online at https://www.ajc.com/news/georgia-news/they-all-went-away-why-some-foreign-farmworkers-end-up-leaving-the-fields/ZXDQUQHKMNH63ASCASK32BXB3M/. Accessed on October 19, 2023.

    Vasquez, T. (2023). “Human Trafficking or a Guest Worker Program?  H-2A’s Systemic Issues Result in Catastrophic Violations.”  Futuro Unidad Hinojosa. Available online at https://futuroinvestigates.org/investigative-stories/head-down/human-trafficking-or-a-guest-worker-program-h-2as-systemic-issues-result-in-catastrophic-violations/ Accessed on October 19, 2023.


    Escalante, Cesar L., Joshua Emmanuel, and Bishal Gaire. “H-2A Wage Violations Against Workers Hired by Farm Labor Contractors.Southern Ag Today 4(51.1). December 16, 2024. Permalink

  • Hiring H-2A Workers through Farm Labor Contracts

    Hiring H-2A Workers through Farm Labor Contracts

    The H-2A Program allows direct farm employers to hire H-2A workers through Farm Labor Contractors (FLCs) (CFR § 655.132).  Current regulations allow an FLC to file a single foreign labor certification application where they declare the need for a batch of workers intended to service multiple farms at several farm work locations.  These work assignments can even extend beyond the FLC’s home state boundaries (Castillo, Martin, and Rutledge, 2022).  

    In 2021 and 2022, FLCs have hired more than 40 percent of all DOL-certified H-2A workers, with California, Florida, and Georgia as the most popular work destinations in recent years (Table 1).  More than 60 percent of FLCs’ H-2A hires are accounted for by companies based in Florida and California. In recent years, Georgia, Texas, and North Carolina are the other Southern States included in the Top 6 home states of FLCs.

    In 2023, most H-2A workers hired by California FLCs were detailed within the state (88 percent), with about 10 percent outsourced to Arizona farms, while the rest worked in four other states (Colorado, Nevada, Texas, and South Carolina).  In contrast, H-2A hires of Florida-based FLCs are more dispersed, with 52 percent ending up employed within the state, while the rest are deployed in 28 states with North Carolina and Michigan (11 percent each), Indiana (6 percent), Georgia (4 percent), and Illinois (3 percent) as the five most popular work destinations. 

    The value of FLCs in the H-2A hiring scheme lies in their greater familiarity with the farm labor supply conditions in countries where most potential H-2A workers come from.  FLCs maintain extensive social and business networks in those countries that allow them to solicit workers even from remote local communities.  In contrast, individual U.S. farm businesses’ worker solicitation outreach networks are usually not as broad and far-reaching.  Thus, the FLCs capitalize on their good connections and extensive outreach, making them viable suppliers of prospective H-2A workers for U.S. farms.  

    However, a cursory review of wage-related violations in agriculture indicates high incidences of infractions associated with the FLC-H-2A hiring scheme. Based on more recent wage violations data compiled by the Department of Labor’s Wage and Hour Division (DOL-WHD), FLCs’ H-2A hires account for 27 percent (2022) to 31 percent (2023) of all H-2A-related cases.  Back wages owed to FLC’s H-2A workers account for 15 percent (2022) to 26 percent (2021) of all H-2A back wages.  These proportions may be less than the FLCs’ H-2A supply proportions of about 33 to 44 percent during these years, but the nature of these violations provides an interesting discussion of the crucial impact of FLCs on the viability of the H-2A program.  In a later issue, a follow-up article will discuss the nature of these FLC-associated labor violations and back wages, as well as shed light on how federal budgetary decisions could influence the varying efficiency, scope, and depth of the DOL-WHD’s policy compliance auditing process over the years.

    Table 1. H-2A Workers Hired by Farm Labor Contracts, Geographical Dispersion, and Wage

    Note:  a Non-farm labor contractors include direct farm employers consisting of individual/joint farm businesses and commodity groups (associations)
    Source:  Department of Labor (DOL) H-2A Disclosure Datasets; DOL -Wage and Hour Division (WHD)

    References:

    Castillo, M., P. Martin, and Z. Rutledge. (2022).  The H-2A Temporary Agricultural Worker Program in 2020.  Economic Information Bulletin #238, Economic Research Service, U.S. Department of Agriculture.  Washington, DC.

    Code of Federal Regulations (CFR). Labor Certification Process for Temporary Agricultural Employment in the United States, Subpart B. National Archives, Government Policy and OFR Procedures, Washington, DC.


    Escalante, Cesar L. “Hiring H-2A Workers through Farm Labor Contracts.Southern Ag Today 4(30.3). July 24, 2024. Permalink

  • Reforming the H-2A Guest Farmworker Visa Program: Sectoral Coverage Expansion and Workers’ Path to Permanent Residency

    Reforming the H-2A Guest Farmworker Visa Program: Sectoral Coverage Expansion and Workers’ Path to Permanent Residency

    The number of H-2A workers in the country increased by more than four times since 2005 (Figure 1).  In the last two years, over 370,000 H-2A positions were certified each year.  Each worker was employed for an average of six months. Despite such growth, the program supplies only 10 percent of the farm sector’s labor needs.  This is a conservative lower bound compared to earlier estimates since this calculation accounts for H-2A’s restricted employment duration and the farms’ actual year-round labor requirements (Costa, 2023).  

    The current H-2A model is clearly a mechanism for hiring seasonal and temporary workers only. Seasonal labor demand arises during a short time segment(s) of the production cycle. Therefore, farm operations with longer production cycles and requiring help on more complex farm tasks usually face the challenge of recruiting and training, which comes at a significant cost compared to retaining a workforce from year to year. This lack of farm work continuity causes uncertainty and inefficiencies in farm management.

    Based on the distribution of H-2A workers according to job classifications (Figure 2), workers on ranch and livestock (animal-based) operations accounted for only 4 to 5 percent of all H-2A labor in the last four years.  This confirms USDA-ERS estimates of the livestock farms’ share in H-2A employment at around 4-8 percent (Castillo et al., 2021). This low H-2A patronage can be partially attributed to the livestock production cycle.  Although many ranch operations are labor intensive, the industry’s need for year-round labor cannot be filled by seasonal, temporary H-2A work contracts.

    The U.S. House of Representatives has introduced H-2A program reforms under its Farm Workforce Modernization Act (FWMA) bill.  The bill was introduced in both the 116th and 117th Congresses in 2019 and 2021, respectively, but was subsequently rejected by the Senate in both attempts.[1]  Last year, several legislators revived and developed a more recent version of the bill (FWMA 2023), which is currently under review by the House’s Committees of Jurisdiction, to be potentially taken up at the 118th Congress this year.   

    FWMA 2023 contains specific provisions designed to accommodate the needs of year-round farm operations.  The bill proposes to allot a maximum of 20,000 H-2A visas per year (over a 3-year period) for year-round employers like dairy and other livestock farms.  As an incentive for foreign workers to be continually employed, the bill offers them a path to permanent residency after 10 years of accumulated farm working experience.  

    The farm sector will likely benefit from FWMA’s intention to lay out a definite path for workers to acquire permanent residence status.  Foreign workers’ commitment to meet the 10-year employment tenure requirement will assure the farm sector of a more stable supply of reliable workers.  However, such economic benefits may be realized only in the short-term.  Past studies conclude that while the farm sector subsists on foreign labor, gross disparities in the compensation structures of farm and non-farm employers usually lead to substantial migration of workers away from farms into non-farm employers offering higher wages and fringe benefits (Luo and Escalante, 2017).  Meanwhile, after exhausting all available family and local sources of labor, farms are usually left to rely on foreign workers, who are either bound to work under a labor contract (the H-2A case) or are desperate to survive, hence would cling on to and endure farm work (the undocumented workers’ case).  When qualified H-2A workers eventually obtain green card status, the question remains whether their newly acquired employment flexibility will not lure them away from farm employment.

    Figure 1.  H-2A Job Petitions Approved, Certified, and Issued with Visas, 2005-2022

    (Reproduced from Costa, 2023)

    Figure 2.  Certified H-2A Positions by Job Titles, H-2A Selected Statistics, 2020-2023

    Source:  Annual Statistical Summary Reports, Office of Labor Certification, Employment and Training Administration, Department of Labor

    [1] Among the reasons why the FWMA failed to pass in the previous two attempts include a provision that would have allowed farmworkers to file lawsuits against employers. The current version of the FWMA seems to have taken such past issues into consideration in the hopes that it will be passed successfully this time.


    References:

    Castillo, M., P. Martin, and Z. Rutledge. (2022).  The H-2A Temporary Agricultural Worker Program in 2020.  Economic Information Bulletin #238, Economic Research Service, U.S. Department of Agriculture.  Washington, DC.

    Costa, D. (2023). “How many farmworkers are employed in the United States?” Economic Policy Institute Working Economics Blog.  Available online at https://www.epi.org/blog/how-many-farmworkers-are-employed-in-the-united-states/#:~:text=If%20we%20use%20a%20low,crop%20employment%20on%20U.S. %20farms.  Accessed on January 30, 2024.

    Luo, T., and C.L. Escalante. (2017a). “US farm workers: What drives their job retention and work time allocation decisions?” Economic and Labor Relations Review. 28,2: 270-293.


    Escalante, Cesar L., Shree Ram Acharya, and Alejandro Gutierrez-Li. “Reforming the H-2A Guest Farmworker Visa Program: Sectoral Coverage Expansion and Workers’ Path to Permanent Residency.Southern Ag Today 4(10.3). March 6, 2024. Permalink