Super Bowl LX is over, and I hope your team won. One team that certainly won was the U.S. poultry industry. The Super Bowl weekend is one of the highest annual periods of demand for chicken wings in the United States. Approximately 6.2 billion broiler chickens are produced annually in the United States, each yielding two full wings. Once disjointed for commercial purposes, the two wings are typically divided into four retail portions, resulting in an estimated 24.8 billion individual wing pieces produced each year. The National Chicken Council projects that Americans will consume approximately 1.48 billion wings during Super Bowl gatherings—an amount equivalent to less than one month of domestic broiler production. Given this surge in consumption, the U.S. poultry industry could reasonably refer to the event as the “Chicken Wing Bowl!”
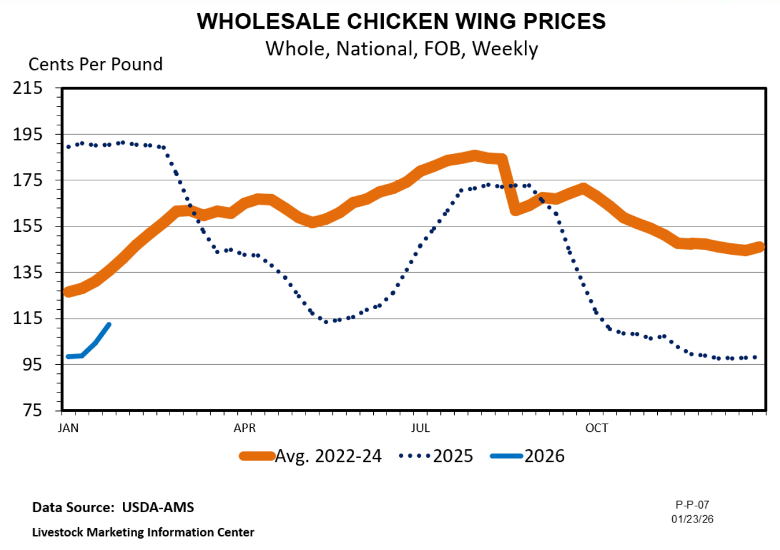
Chicken wing prices have experienced considerable volatility in recent years. However, early 2025 appears favorable for consumers. Wholesale wing prices opened the year below $1.00 per pound and have risen only modestly to slightly above $1.10 per pound (Fig. 1). This price level represents a 66 percent decline from the historic peak of $3.24 per pound recorded in January 2022. With March Madness—another major period of heightened wing consumption—approaching, current trends suggest positive conditions for consumers and retailers alike.
Despite these trends, chicken wing pricing remains historically unpredictable. As one primary wing consumption event has passed, and the next one draws near, restaurants and other retail food outlets try to capitalize on consumer interest. Market competition, combined with relatively low wholesale costs, should help maintain affordable wing prices at the retail level even beyond this Super Bowl. However, current cold storage inventories show 1.12 million fewer pounds of wings compared with the same period last year, which could exert upward pressure on prices eventually. But overall wing inventory is more than double the levels observed back in 2021-22 when prices soared. According to a recent USDA retail price report, the average retail price for conventional fresh party wings in the southeastern United States stands at $2.49 per pound, with individually quick-frozen (IQF) wings priced slightly higher at $2.67 per pound. If supplies remain stable, retail prices may continue to reflect current favorable conditions. Meanwhile, U.S. broiler growers remain committed to meeting consumer demand by supplying the market with high-quality chicken wings.
Contract broiler growers must make business management decisions like any other farmer. However, the scope of those decisions is very different compared to farmers growing and marketing grain, for instance. Broiler growers raising birds on contract for integrated poultry companies have contractually limited abilities to implement production management changes, and since they essentially have one “customer”, they have no chance at varying marketing strategies. Even so, some management choices may positively or negatively influence pay rates they get from the broiler company, and things that influence livability can certainly impact pounds delivered to the plant. Therefore, there may be some opportunities, like row crops or livestock farming, where a grower can choose to focus on production or pay rate improvements to potentially increase revenue. The question is whether one strategy is better than the other.
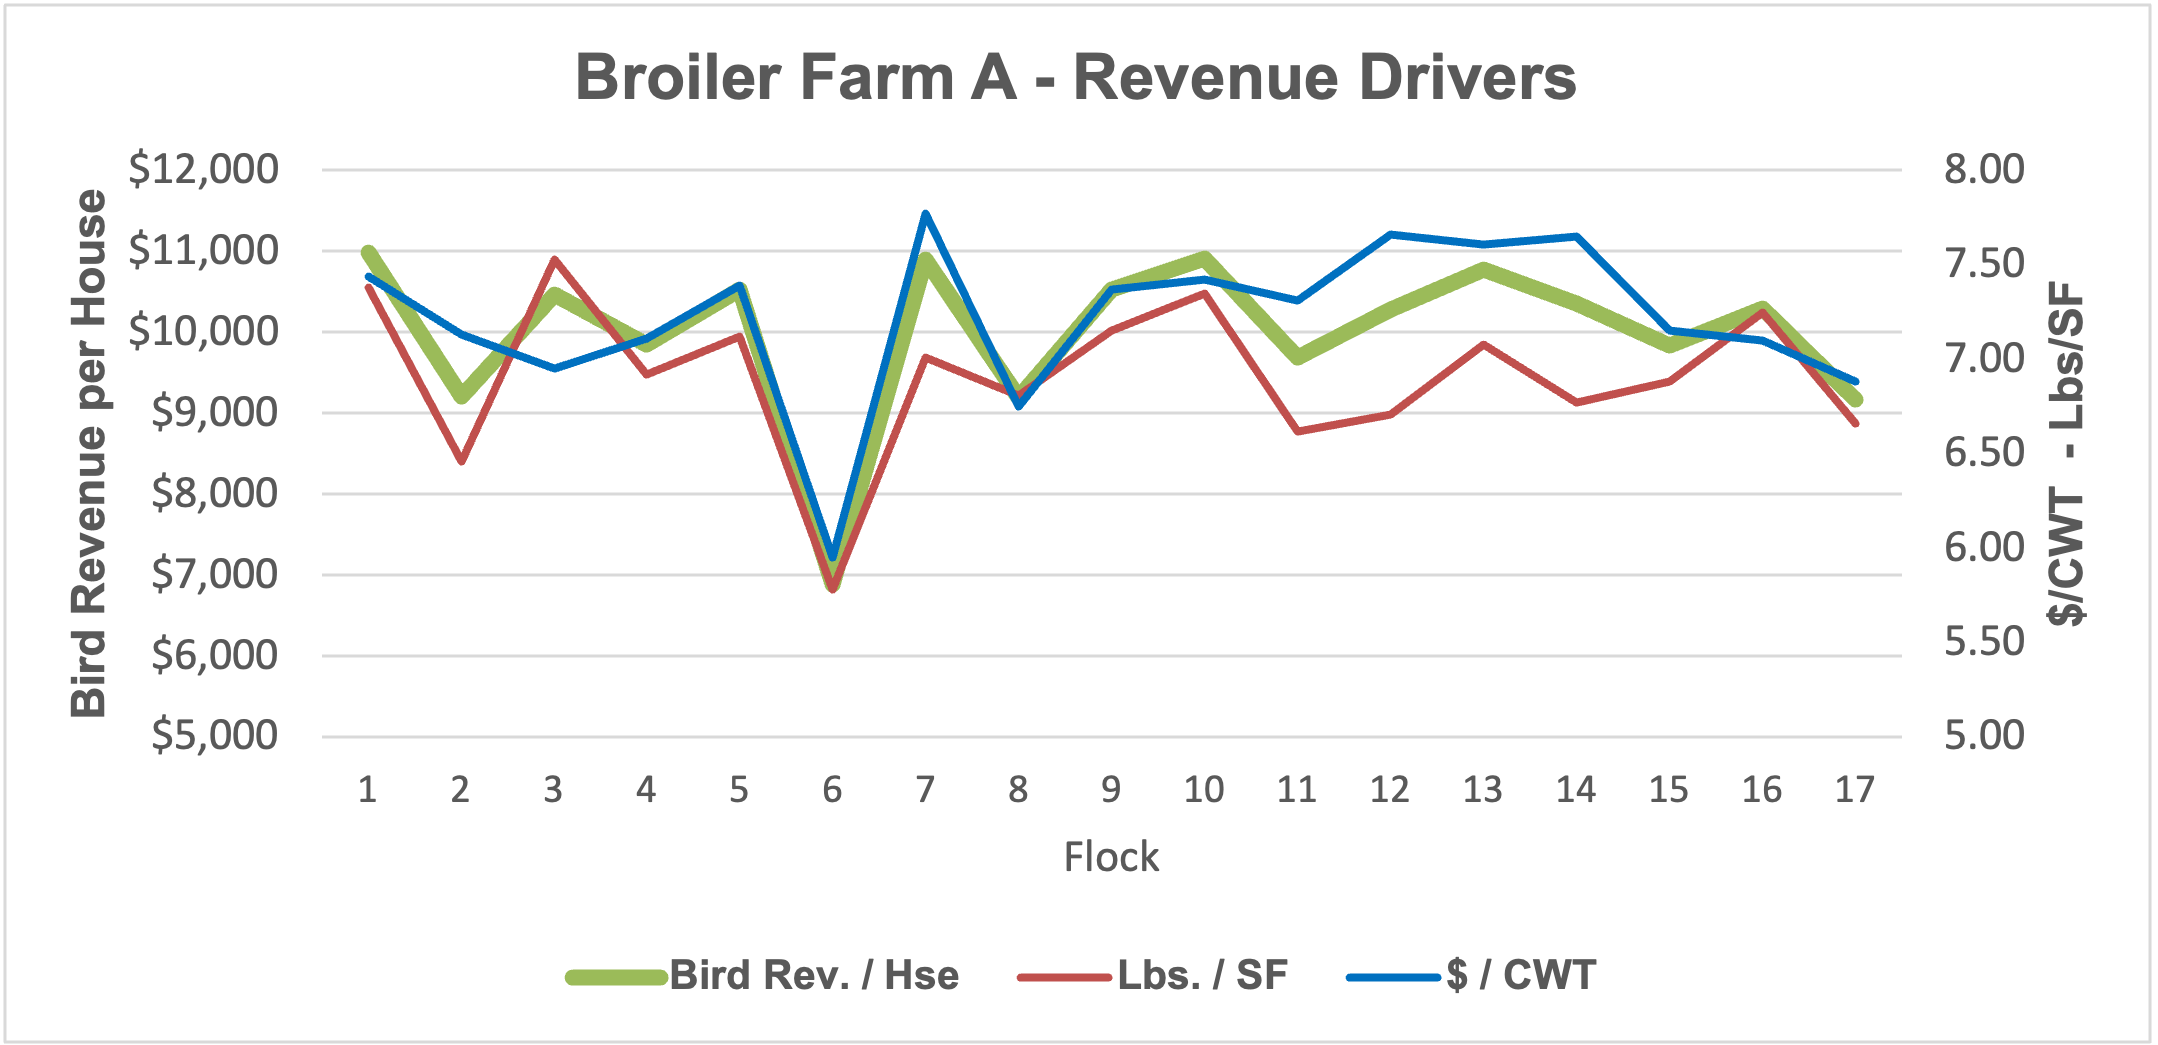
It should be reiterated that a contract broiler grower’s business operates under a simple gross revenue (GR) equation of pounds delivered to the company plant multiplied by the pay rate per pound. If we designate pounds as “L” and pay rate as “P”, the equation is simply L x P = GR. Under current typical competitive contract scenarios, a grower’s pay rate for any individual flock is a function of feed conversion ratio and corresponding flock cost compared to other farms finished and caught in the same week by the company. How well a farm’s cost compares to the average cost that week determines the pay rate. Given the limited abilities to positively impact either pounds or pay rate, the question is which might have a greater chance at positively influencing their GR? In Part 1 of our look at Broiler Revenue, we examined the variability of broiler gross revenue by looking at the two metrics of pay rate in dollars per hundred pounds delivered ($/CWT) and broiler production in pounds broken down to per square foot of housing (lbs./SF) in a nominal fashion on two similar farms across 17 flocks. From that nominal case study, we saw that although there was evidence that either could negatively or positively affect revenue, for many flocks, changes in lbs./SF seemed to override the expected effect of an increase or decrease in pay rate.
The next step looks at the same two farms and attempts to further decipher how the extent of the changes in lbs./SF and $/CWT for each flock impacts GR when compared to the farms’ own averages over the period, further trying to decide if one or the other has the most impact. By simply graphing the percent change from farm average (0%) of each of these metrics (Fig. 1a &1b), we again see what suggest lbs./SF may have a slightly more significant impact on the overall GR equation for many flocks, as often its increasing or decreasing column is the largest of the two and goes in the direction of GR. The problem is that these percentages are likely not directly comparable. In 21 of the 34 flocks, both production and pay rate moved in the same direction as the revenue line. It remains difficult to know which made the most difference to revenue because adding the % change for both does not always equate to the corresponding percentage change in revenue. In fact, it usually doesn’t. This is likely a result of the varying competitive situation that exists for every flock.
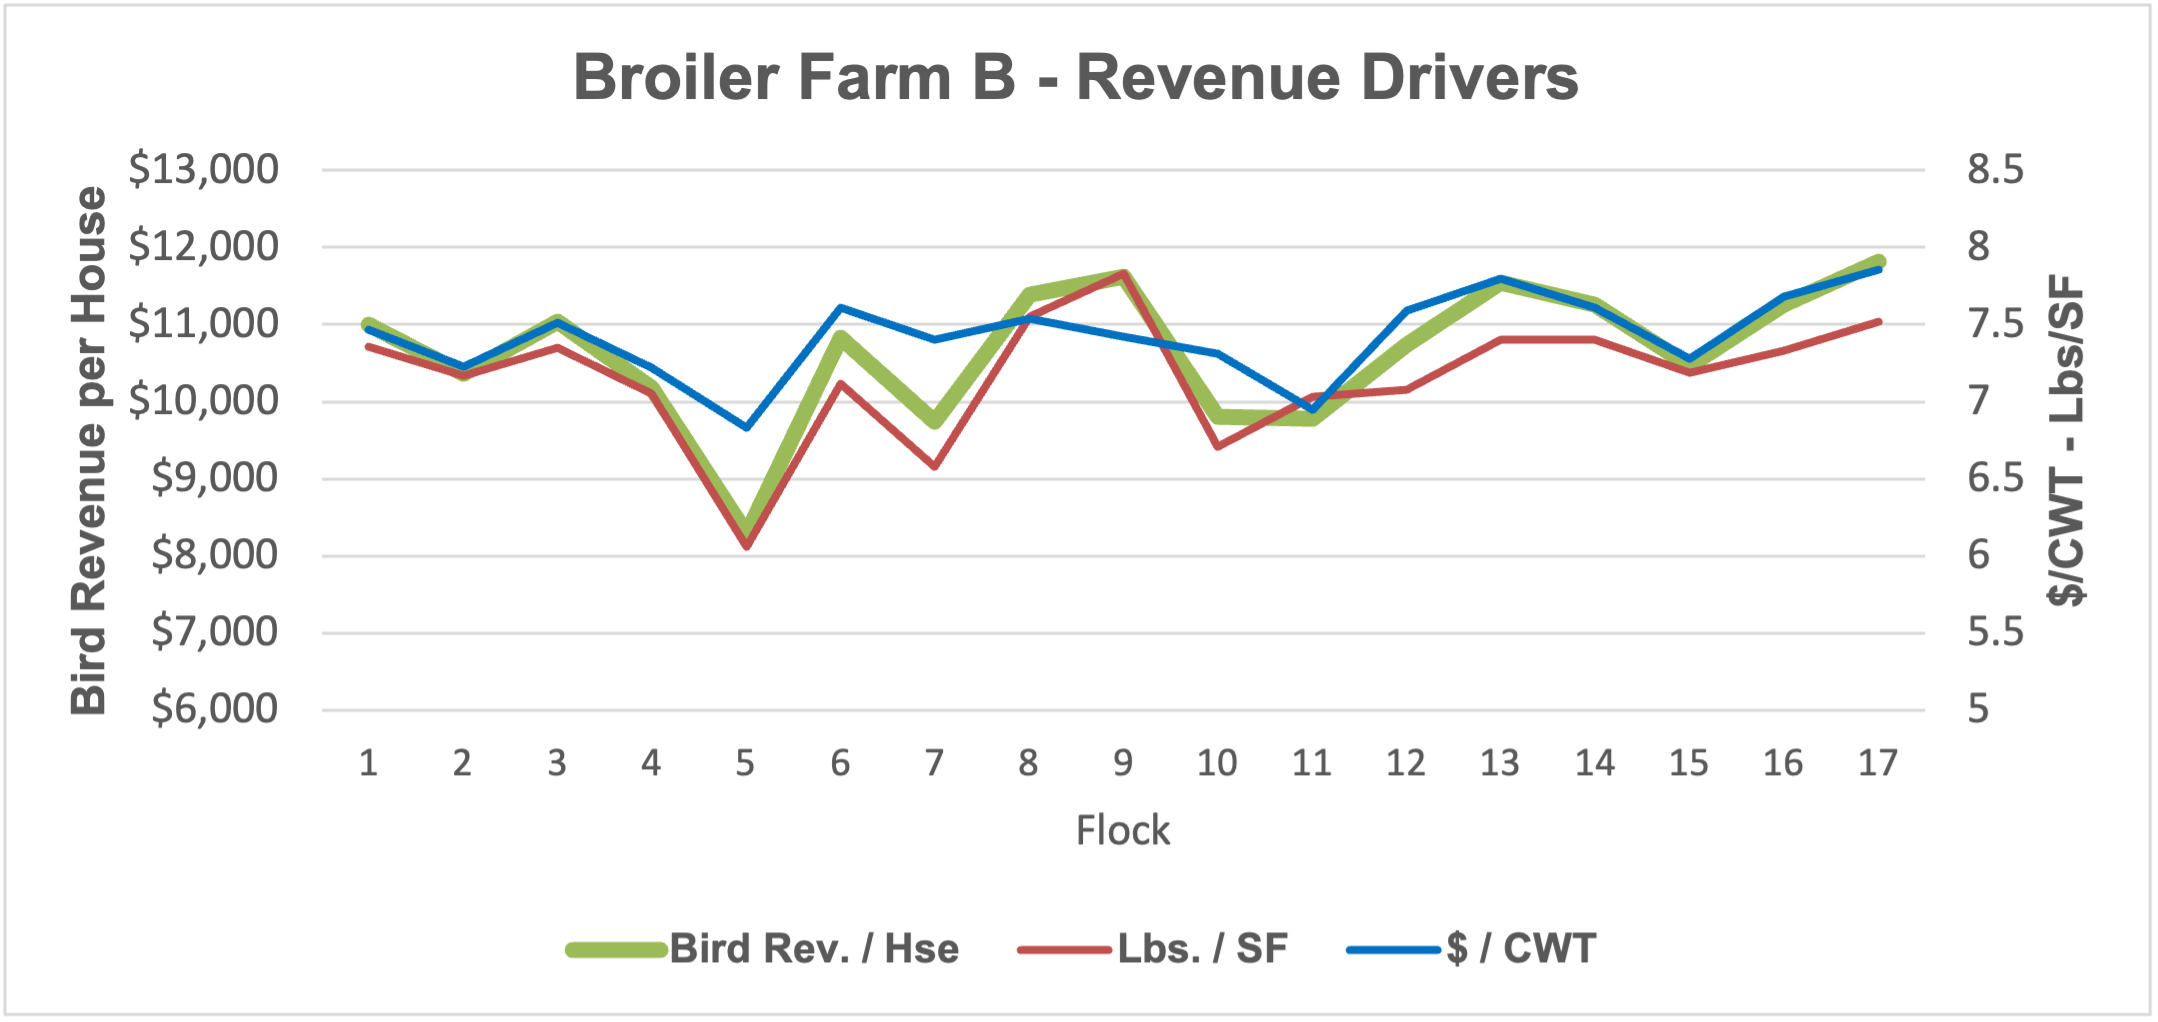
Pay rates are certainly not irrelevant, and avoiding extreme discounts is important. A close look at flock #6 for Farm A and flock #5 for Farm B is warranted. Pay rate had a significant impact on these two flocks for both farms, but Farm A got the worse end of the deal. These flocks were the lowest revenue flock for each farm, as both suffered a similar catastrophic disease outbreak (not HPAI), evidenced by the drastic decrease in production. This also resulted in significant decreases in pay rates for both as they were unable to compete positively in the tournament pay system for these flocks. However, for Farm A, the pay rate decrease was greater. This could be attributed to simple chance in the tournament pay settlement structure that week, as mentioned above. But when combined with an almost equal loss in production, the result for Farm A was 17% less revenue in dollars per house than Farm B’s bad flock ($6,879 vs. $8,283). Thus, the significantly lower pay rate cost Farm A more when combined with the lost pounds. In many cases, since there is no governmental disaster support system for such losses, the farm that suffers from such a disease outbreak receives no additional revenue support from the company either. They simply suffer the loss of birds and revenue along with the company.
Clearly, if either farm could consistently perform better in the tournament and increase their pay rate, they would generate more gross revenue, even if pounds didn’t change. However, be it for efficiency or outdated technology issues, they may be limited in their opportunity to compete for better tournament pay. In such cases, more pounds may be their only opportunity for more revenue. To examine this a little further, we can look at which improves gross revenue more for those negative revenue flocks – improving lbs./SF or increasing $/CWT. If we were to wave a magic wand over these two farms and increase the $/CWT on the negative flocks up to the farm averages, Farm A would gain $9,715, and Farm B would gain $8,514 in revenue. However, if we were to raise lbs./SF for each of those negative flocks up to farm average, Farm A would gain $11,350, and Farm B would gain $11,685. For both farms, increasing lbs./SF on poor flocks impacts revenue more, even at decreased pay rates. In the next installment, we look at what implementing changes to pay structures across the board could do to growers’ actual revenue dollars.
Figures 1 A & B: In the figures below, the 0% lines represent each farm’s average revenue, production, and pay rate across the 17 flocks. Above or below that line represents the percent change above or below farm average.
This is not a question of which came first, we all know the answer to that. But, as was discussed in an earlier SAT for cattle, hogs and lambs, this is a question of productivity for the chicken and egg segments of the U.S. poultry market this coming year. (A turkey outlook previously discussed here)
Chicken
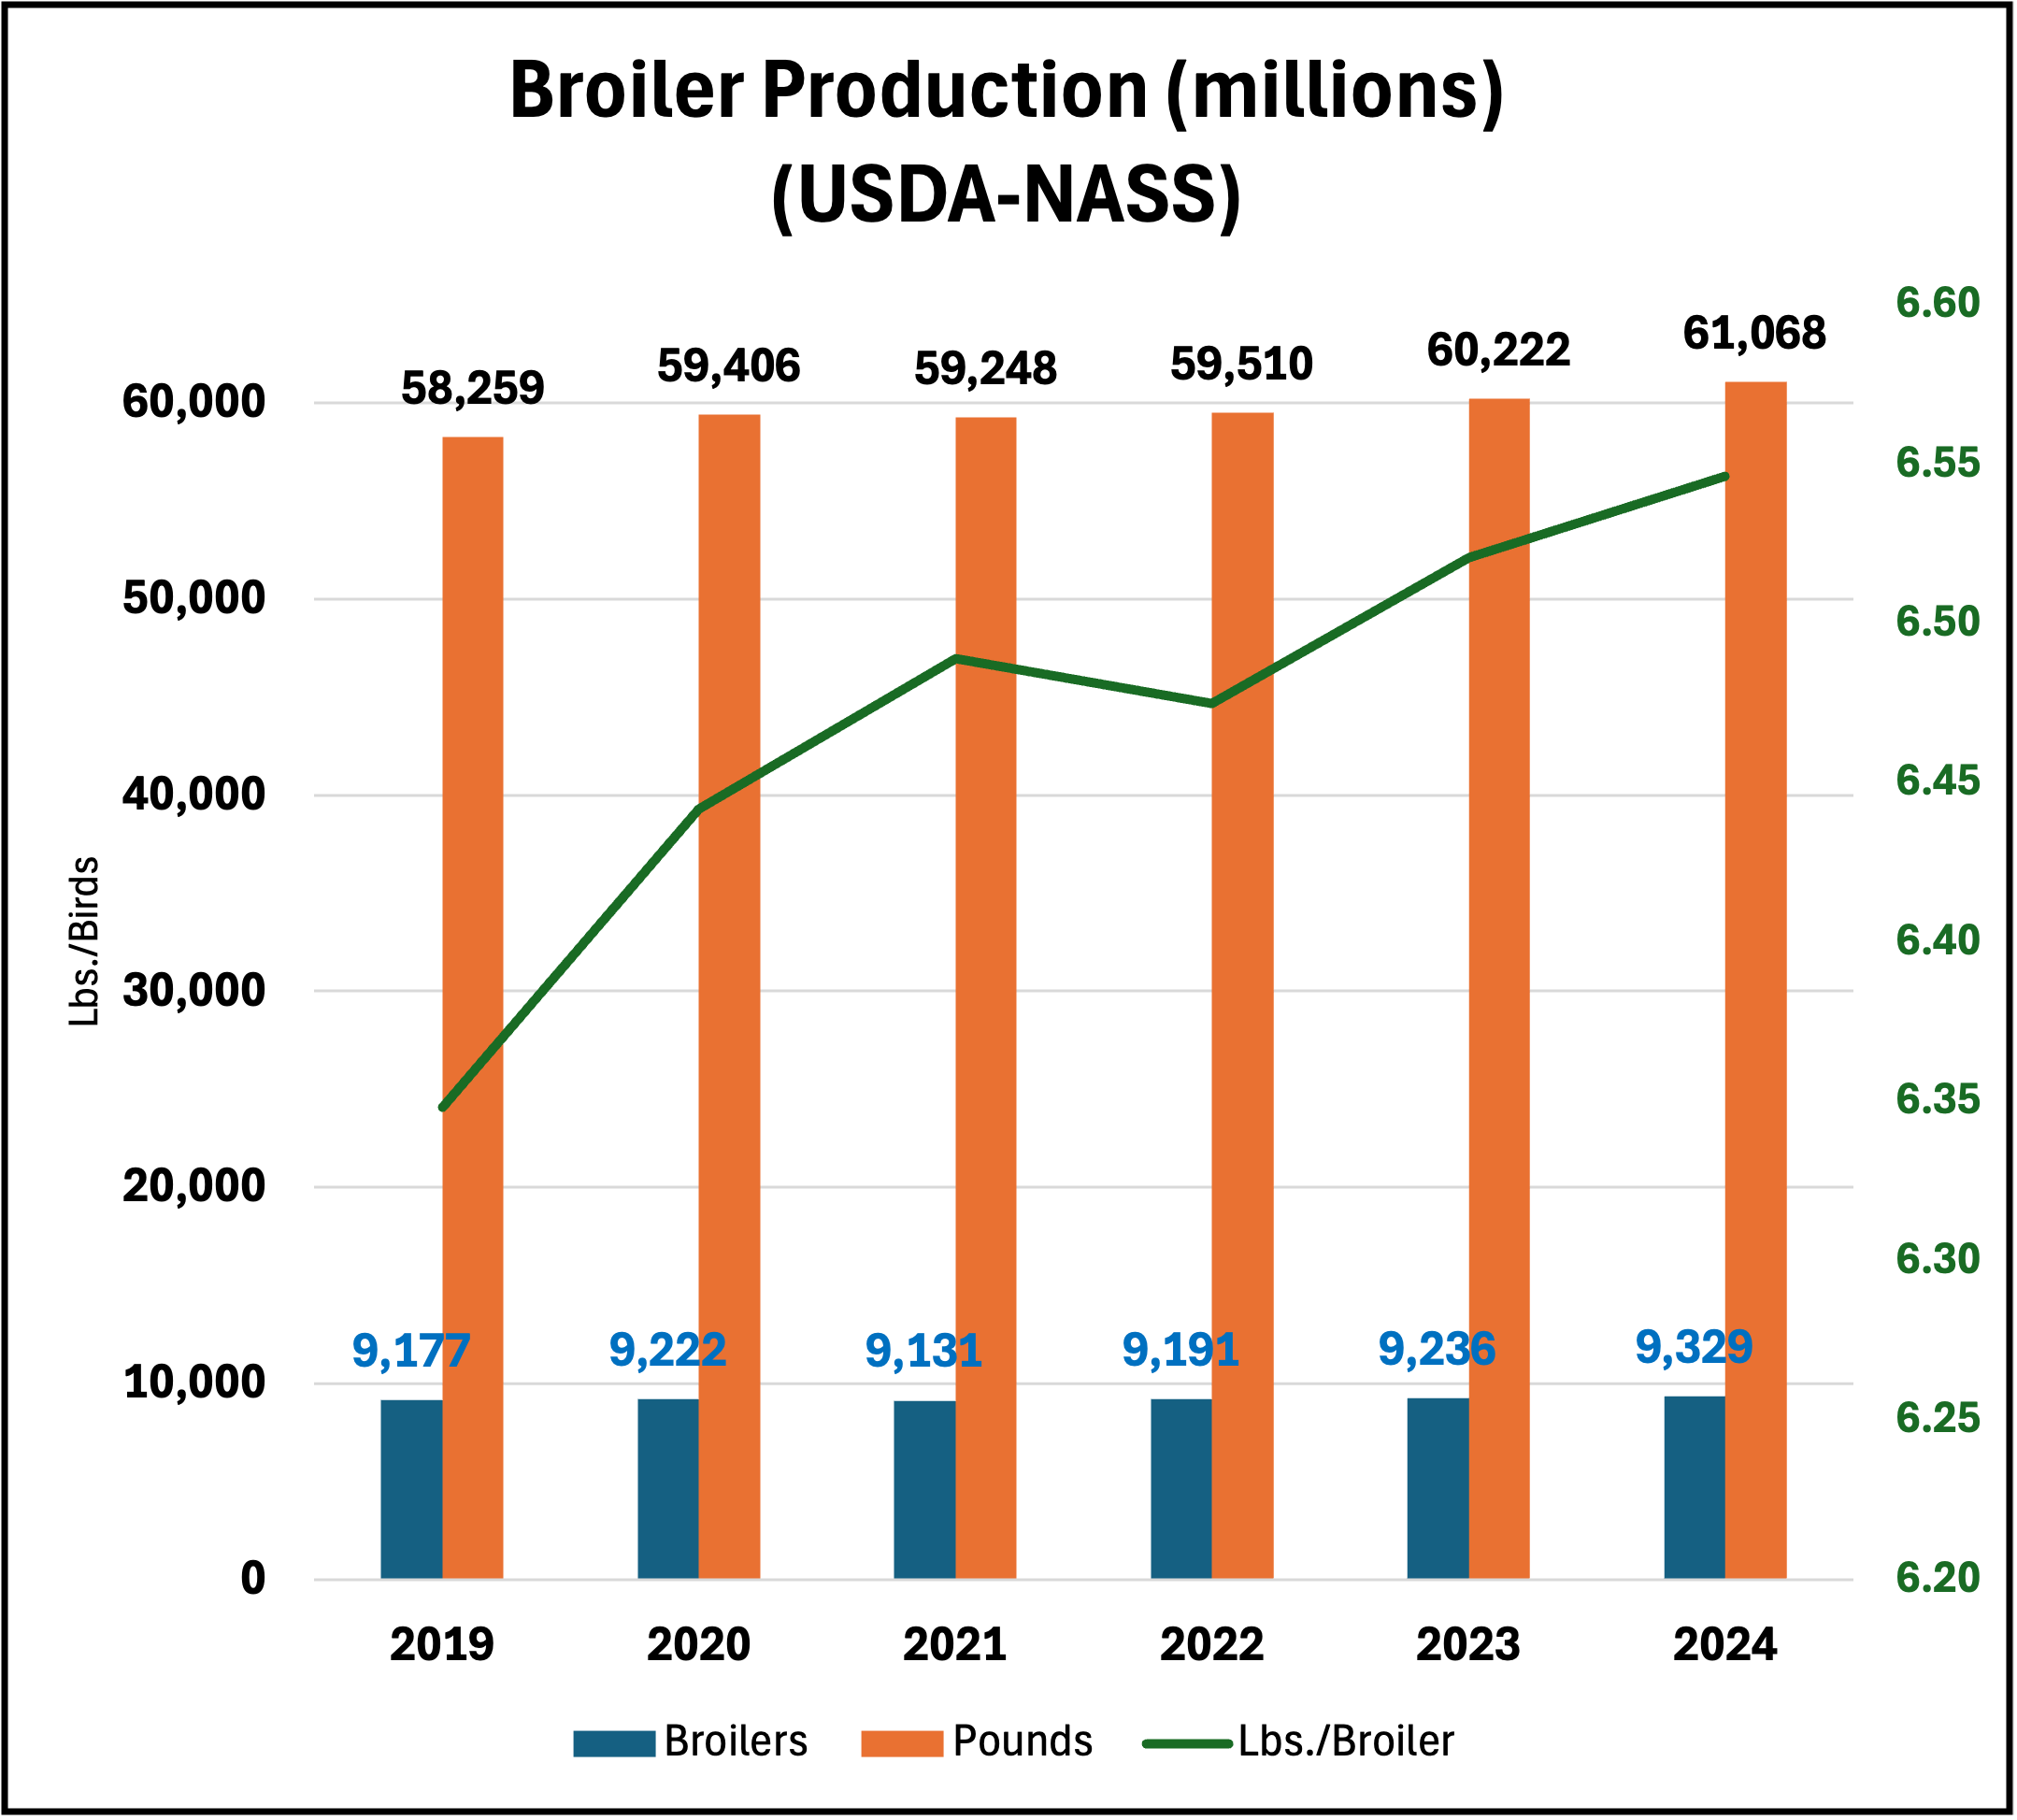
Broiler production increased by 846 million pounds in 2024 over 2023, a 1.4 percent increase (Fig. 1). Increased production came from two sources: more birds and more pounds per bird. On the bird side, 93 million more broilers were produced, a 1 percent increase. As has happened in 5 of the last 6 years, increased chicken production also came from producing a heavier bird, on average, 6.55 lbs. in 2024 vs. 6.52 lbs. in 2023.
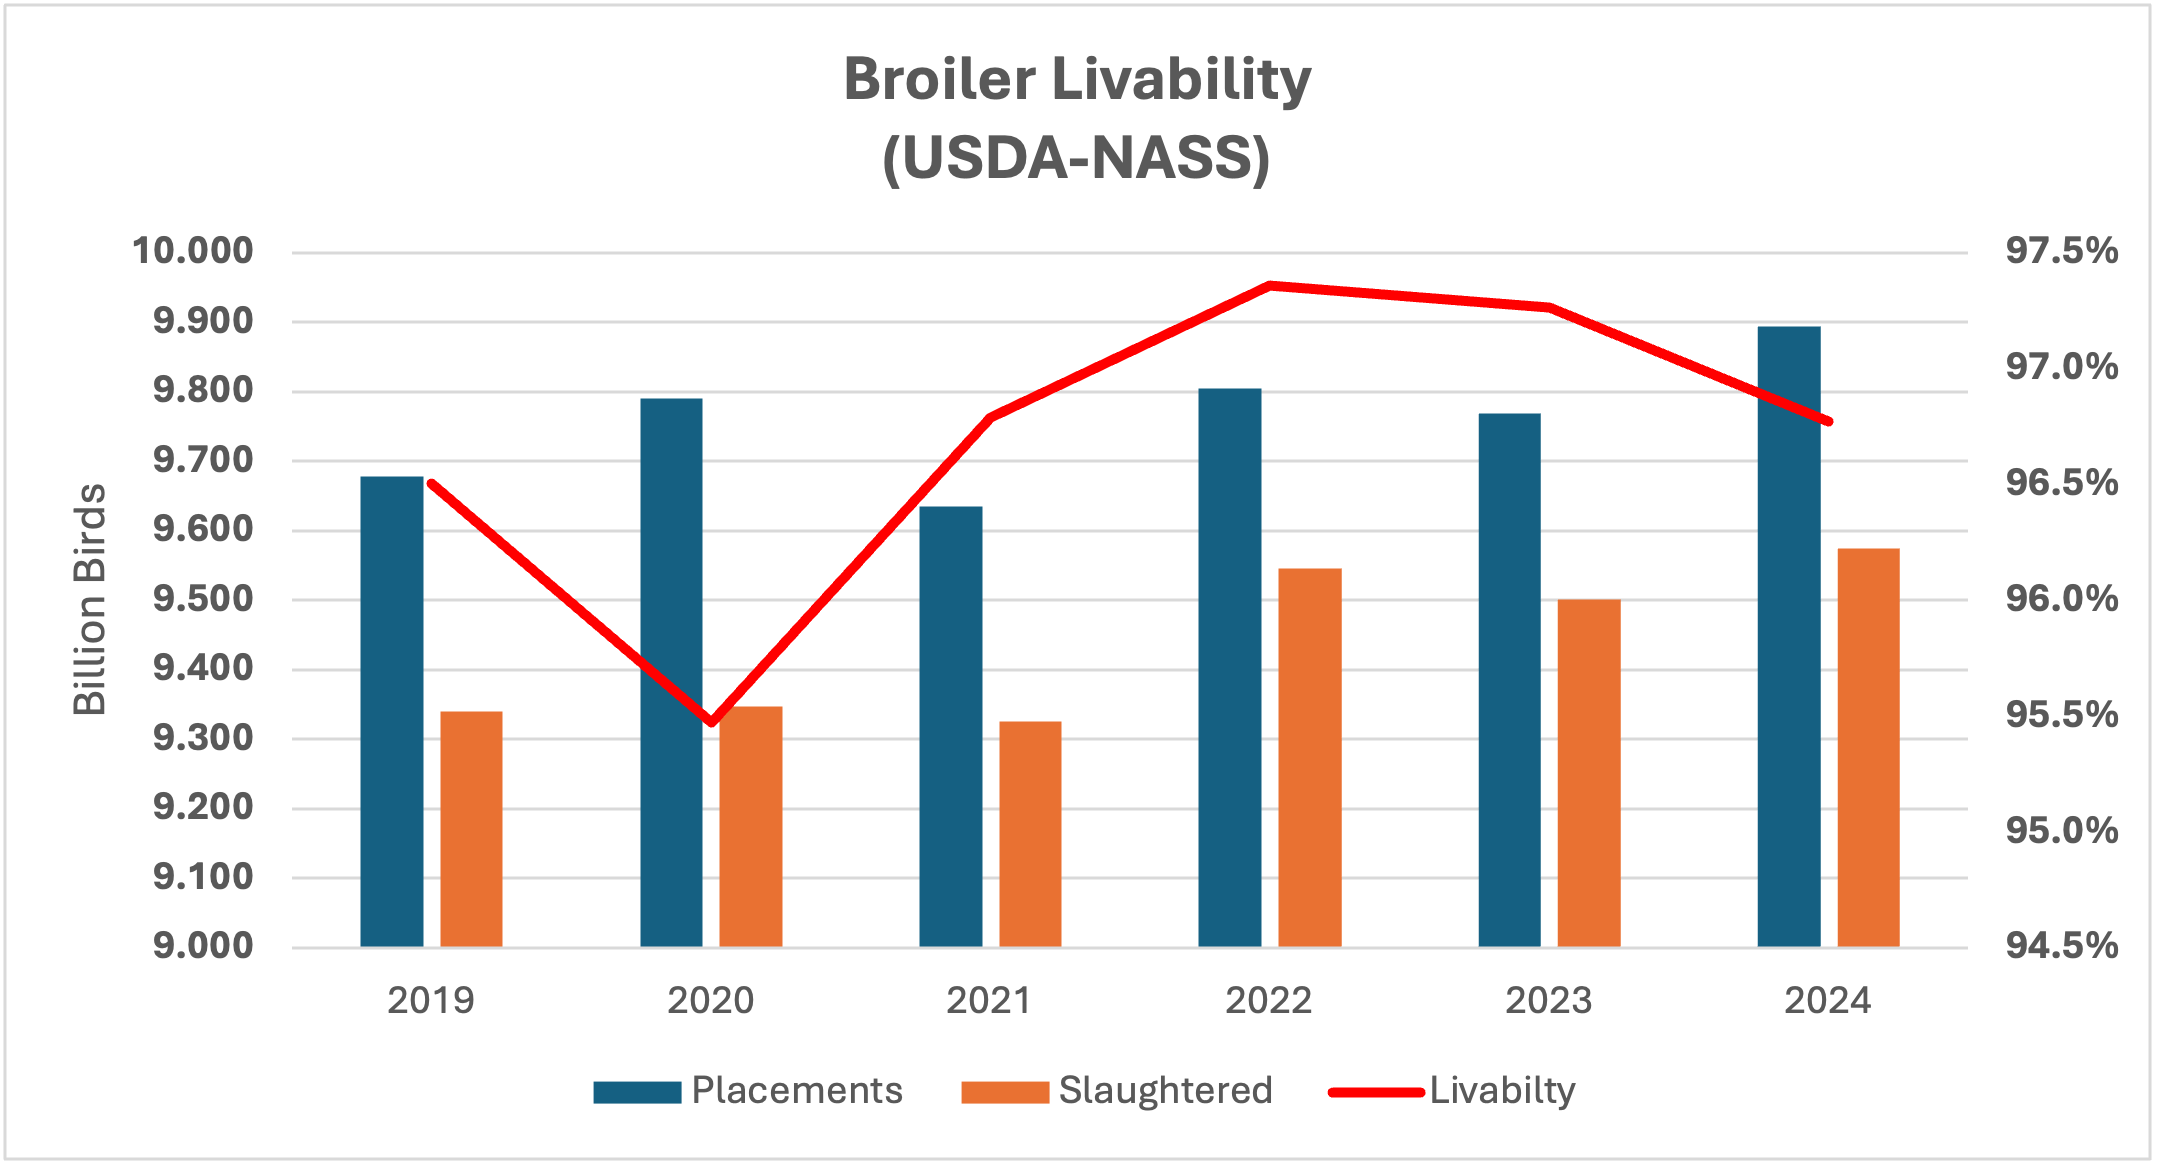
Production increases have been supported by profitable prices and falling feed costs. Broiler demand has likely benefited from increasing prices for beef and pork. So far in 2025, the increased productivity trend continues with the weekly average production maintaining about a 30-million-pound lead on historical weekly production back to 2019 and staying slightly above 2024 production. Though chick livability declined again in 2024, the lost birds were offset by placing more chicks overall (Fig. 2).
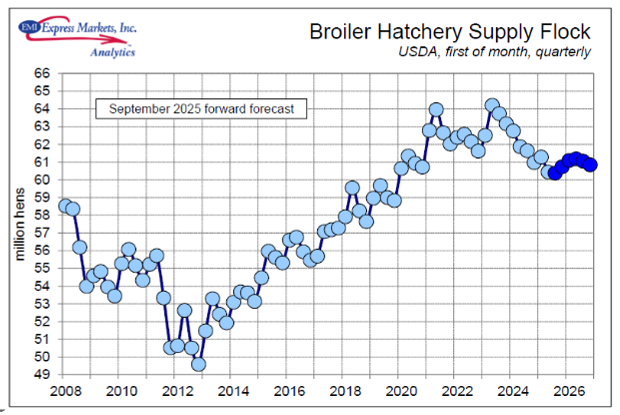
One important question for broiler productivity is if the chicken industry can continue to boost the supply of additional chicks for broilers. This problem goes all the way back to the supply of broiler type pullets. These are the pullets that become laying hens that supply broiler chicks. The broiler hatchery supply flock had seen a steady increase since 2012. But, beginning in 2023, the supply flock began decreasing steadily, with only a slight reprieve being projected (Fig. 3). Just like fewer cows equals fewer feeder calves, fewer breeder hens equal fewer broiler chicks. This supply crunch may start hitting broiler production as early as Q1 2026.
Eggs
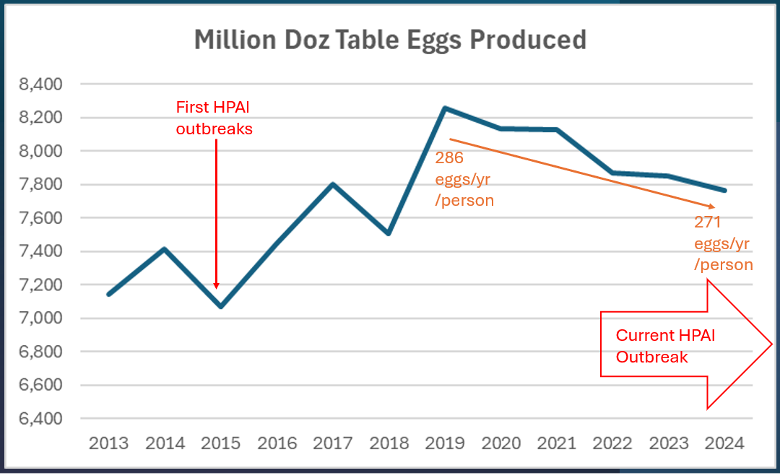
The same old scourge the industry has been fighting since February 2022 continues to haunt table egg supply – Highly Pathogenic Avian Influenza (HPAI). Since this outbreak began in 2022, 127 million laying hens have been lost. As outbreaks continue, new hens entering production must make up for lost birds and normal turnover. While HPAI has sharply reduced the number of table egg layers since 2022, a longer term look at supplies reveals that the number of table eggs produced has been falling since 2019 (Fig. 4). Egg prices hit all-time highs in late 2022 and again in early 2025. But, during the interim period, prices were relatively stable. Price volatility seems to be mostly due to short-term supply challenges.
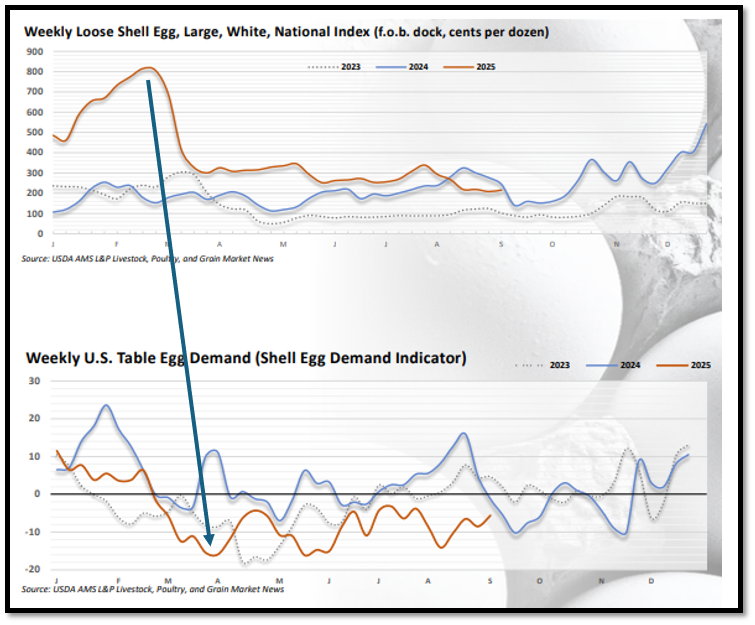
Total per capita egg consumption is down from 286 eggs in 2020 to 271 in 2024 (egg-news.com sourced). While consumption tends to equal production (e.g., we eat all we produce), the question remains whether people are eating fewer eggs in general, or if consumption is down because of price and supply dynamics? The sharp price spike in 2025 was followed by a marked decrease in egg demand (Fig. 5), which suggests price as a primary driver. But since then, prices have moderated, and demand hasn’t seemed to have rebounded much, which suggests this is more than just a price story. Interest in production and productivity is likely to remain important as HPAI occurrences are ramping up as Fall begins and wild bird migrations resume their normal patterns.
Fig. 1: Broiler production (chicken) in the us has been on a slower year over year increase in pounds for many years. Over the last 6 years, pounds of chicken produced have increased 5%. 1.4% in ’23 to ’24 alone, with 2025 projected to be another slight increase.
Fig. 2: Increased placements of broiler chicks has overcome an increase in mortality to maintain increasing production of chicken meat.
Fig. 3: Broiler laying hen supply has been decreasing the past several years, possibly stressing the future supply chain broiler chicks.
Fig. 4: Total Table Eggs being produced has been decreasing since 2019, as well as the number of eggs consumed per person annually. (USDA-NASS)
Fig. 5: Egg prices can cause noticeable reactions to egg demand, especially when those prices are extremely high, as in early 2025.
A few weeks ago, the current state of beef and pork prices was addressed in Southern Ag Today. Poultry, namely chicken and turkey, make up the bulk of the remainder of the American animal protein diet. Chicken is at the top of the list, with over 100 pounds per capita annually consumed. Turkey, on the other hand, is last on the consumption list.
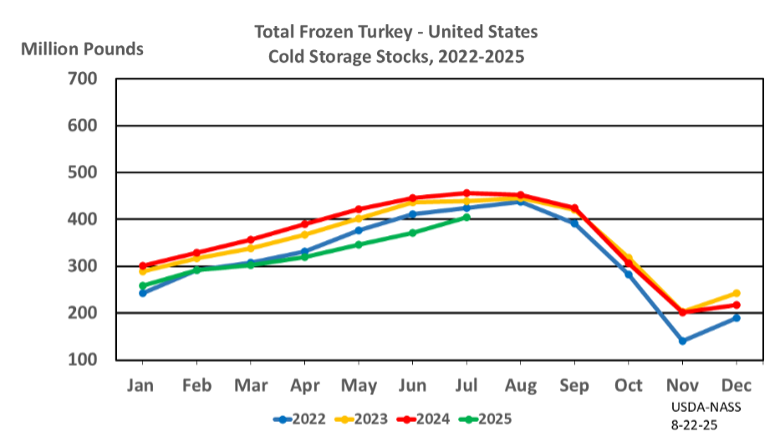
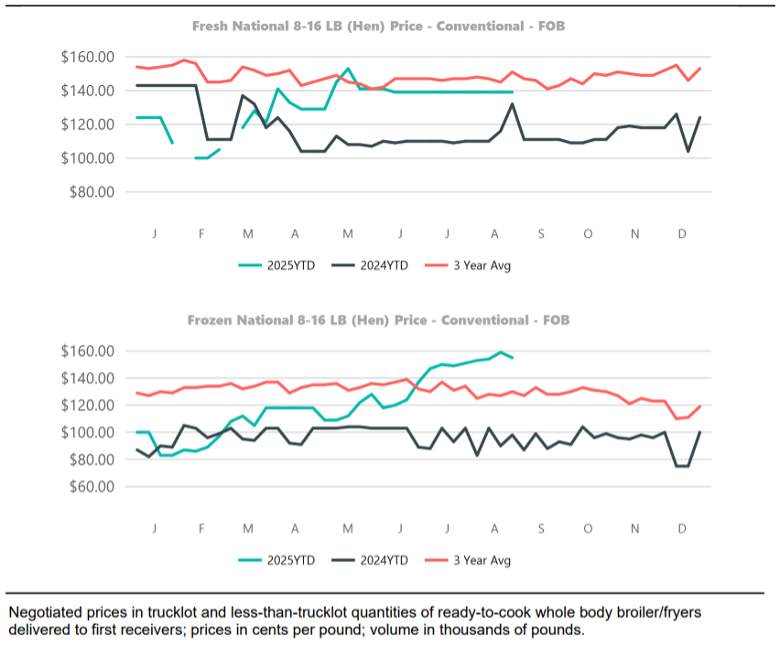
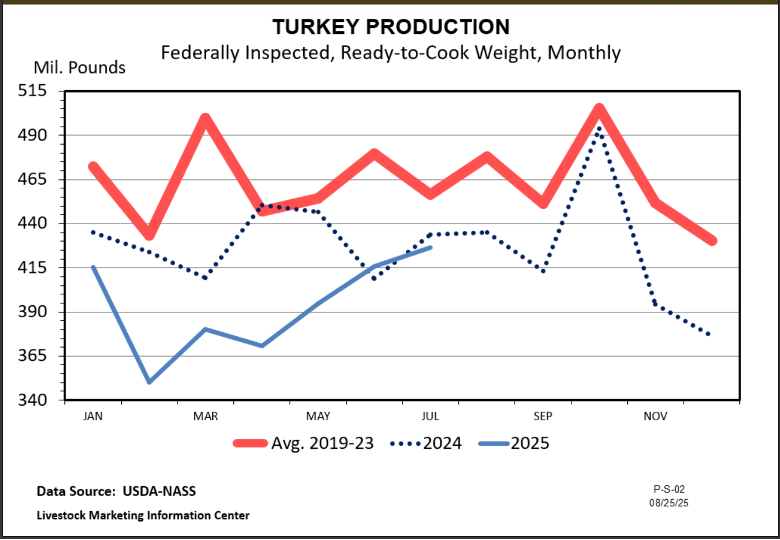
However, Thanksgiving is Turkey’s time to shine. This seasonal demand certainly affects price, but it is also part of the turkey production schedule. Late May or early June placements of young toms are targeted to be ready to hit the fresh market for Thanksgiving. August placements would target smaller young hens. So far in 2025, poult placement is down every month leading up to August compared to last year. Also, turkey egg set was lower in most months in 2025 compared to 2024. However, July eggs set in hatcheries for August poult placement are up 1 percent over last year. Depending on the hatch, these eggs could bolster more fresh birds ready for the table in November. But overall, there have been fewer poults placed in 2025, likely meaning fewer fresh young toms and hens, which could lead to higher prices this holiday. The frozen market, while seasonally trending up, has less pounds of turkeys in cold storage compared to years past (Fig. 1), which also suggests a lower supply this holiday season.
With lower supply usually comes higher prices. In Fig. 2, we see that, for both large and small lot purchases, fresh turkey prices are higher in 2025 than in 2024. Although large quantity buyers were steady at $1.40/lb going into fall, those prices may increase over the next month as availability dwindles, and holiday inventory build begins. In fact, early September trading is trending in the $1.55/lb area. Many of these birds may be going into cold storage for Thanksgiving sales.
While current turkey prices are looking positive for producers, turkey growers have had a difficult time these past few years dealing with the loss of over 18 million birds to Highly Pathogenic Avian Influenza (HPAI). Overall production has been below historical averages in the past two years (Fig. 3). This fall has seen several cases of HPAI hit turkey operations, causing bird losses totaling 195,200 from August through early September. As wildfowl migration ramps up, more cases will likely appear this fall. Depending on the timing and severity of such outbreaks, the fresh turkey market could get hit with additional supply shrinkage, which would translate into yet higher prices for the 2025 holiday season.
(Fig. 1) Frozen turkey in storage is lower this year than the previous three years but trending upward as is usual for the season. With overall placements being down, this decreased supply may linger and be a positive leverage for prices this year.
Fig. 2: Smaller turkeys, typically young hens, are where most whole birds come from, both fresh and frozen. Large truckload lot prices have been steady for these birds, perhaps reflecting contracted long-term pricing from larger buyers. However, as can be seen in the small lot pricing, as holiday demand starts to build, prices are likely to increase in the next month.
Fig. 3: Turkey production has been below historical average for the last two seasons, and looking at egg set and poult placement, this number is not expected to rebound soon.
On July 1, 2026, the “Poultry Grower Payment Systems and Capital Improvement Systems” ruling is set to go into effect. The ruling was set forth by the USDA Agricultural Marketing Service to amend the Packers and Stockyards Act of 1921. The most impactful change predicted is how it specifically addresses the way contract broiler growers are paid. The ruling requires live poultry dealers (integrators) to change the typical grower ranking systems, typically called “tournament pay”, to a system that establishes a minimum pay regardless of grower cost performance and allows for only positive pay incentives to be employed by integrators. For most integrators to meet this new requirement, it is expected that a standard minimum pay per pound of live broiler delivered to the processing plant will be established for all their growers. If you ask broiler growers, most will say they perceive this as a positive change, potentially making it easier to manage their businesses, and many will likely receive an increase in overall revenue. But this begs the question: will it positively affect all growers all the time, and is this the best way to help growers? And further, what affects revenue more – pay per pound or pounds out the door? In this and two upcoming contributions to Southern Ag Today, we look at what is driving the broiler revenue bus, to what extent does it have control, and finally, just how much a small change can mean to a grower’s bottom line.
While an integrator may establish a fixed base, or minimum pay rate, that pay rate is only applied to pounds leaving the houses. There are many factors beyond the grower’s control that impact total pounds, such as bird placement rate (density), out-time between flocks, flock length, and mortality, especially when mortality is associated with a major disease event. While bird weight can be tied to farm management, the integrator makes the final decision on when to catch the birds, and a change of a couple of days can have a significant impact on pounds delivered. Out-time between flocks can also have significant impacts on pounds. Many things that affect out time are out of the control of both grower and integrator, like chick availability. To evaluate the question, I examined three and a half years of data from two broiler farms of the same size, age, technology, and in similar locations growing for the same integrator under the same tournament pay contract. The farms have different on-farm management, and Farm B is the better performer of the two. I compared bird revenue per house from 17 flocks to pounds per flock per square foot of housing (Lbs./SF) and pay per pound ($/CWT), nominally (Fig. 1a-b). A quick look at the graphs and it seems the green revenue line seems to mostly mirror the red Lbs./SF line. A closer look reveals that, while many flocks saw a directional movement of all three factors together, there were several flocks where $/CWT increased yet revenue decreased, driven by a decrease in Lbs./SF. There were also a few flocks where the opposite occurred and $/CWT decreased, yet revenue increased, driven by increased Lbs./SF. In these instances, Lbs./SF drives the revenue up or down despite opposite changes in pay rate. This would suggest that a simple pay rate fixation would not always equate to an increase in revenue, and that a decrease in pounds (often out of a grower’s control as indicated above) could easily overtake the potential positives of a marginal pay rate increase.