Author: Francisco Abello

  • Wheat Alternatives: Maximizing Profitability in a Tough Market

    Wheat Alternatives: Maximizing Profitability in a Tough Market

    With cash wheat prices falling, farmers in many regions of the South are once again facing difficult decisions in their efforts to maximize returns on their crops. As prices dip below the breakeven threshold, alternative uses for wheat, such as grazing or baling, may offer improved profitability.

    What follows is an example of a Wheat and Small Grains Decision Aid tool designed to help farmers analyze whether it is more beneficial to use wheat for grain, grazing, or hay. Evaluating the available alternatives is always prudent based on the relative prices of grazing, wheat hay, and grain, as well as the expected yields, production costs, and the availability and cost of harvesting or baling equipment. For this analysis, we assume that harvesting and baling equipment is custom-hired. However, from a cash cost perspective, owning your harvesting or baling equipment will influence the comparison of these two alternatives.

    In contrast to last year, the hay alternative demonstrates higher profitability under similar production conditions in the Rolling Plains region of Texas. To estimate potential hay production, we assume grain yield corresponds to 40% of total biomass production. Thus, a wheat yield of 45 bushels per acre would produce a total biomass of approximately 3.1 tons per acre. Further, we assume that harvest and baling will yield 76% of this total biomass or about 2.3 tons per acre[1]. Estimating both grain and hay yield potential is essential when comparing these options.

    The grazing option also appears more favorable, provided there is sufficient water, forage production, and livestock to maximize beef production. 

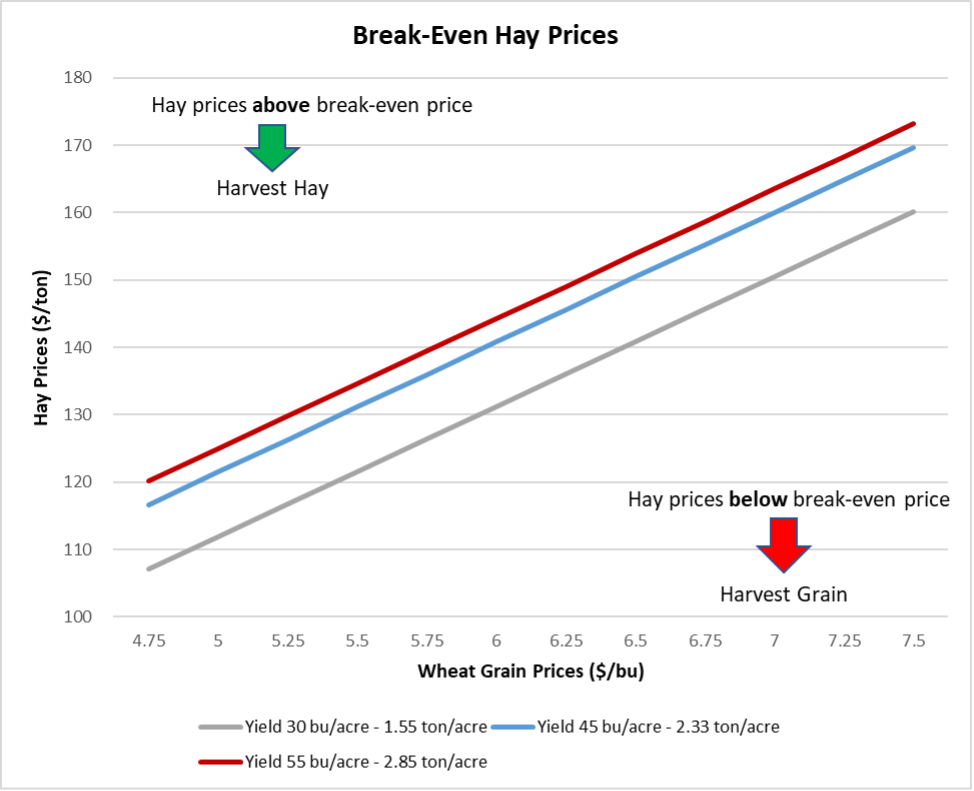
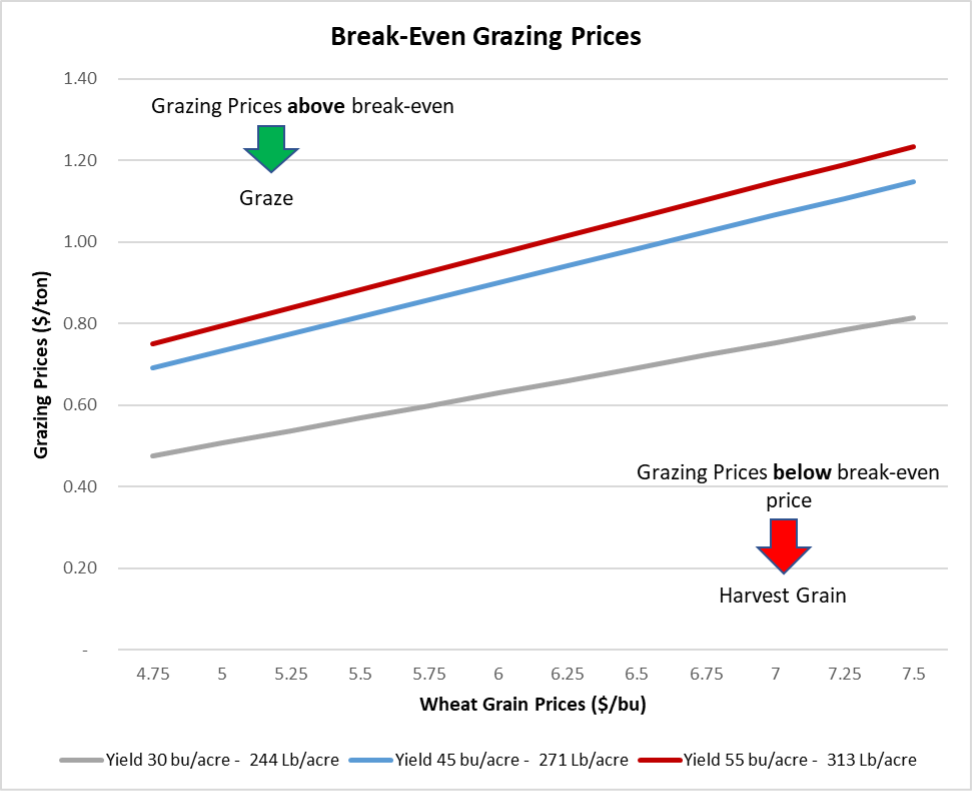
    Another way to approach this information is to determine at what price we must sell our hay (or grazing) to achieve a profit margin similar to that of wheat grain. The Decision Aid tool will use your data and costs to calculate hay and grazing breakeven prices (Graphs 1 and 2).


    [1] (according to “Wheat Hay vs. Grain: A Comparison of Economic Opportunity” by Reagan Noland, Bill Thompson, and Clark Neely).

    Graph 1. Break-Even Hay Prices

    You might consider baling wheat if you can sell the hay above the breakeven price for hay given an expected grain price and yield. For example, with an estimated yield of 45 bushels per acre and a price of $5 per bushel, baling wheat would be more profitable if the net price per ton of hay exceeds $121 (assuming production of 76% of the total estimated biomass 2.3 tons per acre can be achieved). 

    Graph 2. Break-Even Grazing Prices 

    Similarly, for an estimated yield of 45 bushels per acre and a price of $5 per bushel, you would consider grazing out wheat if the grazing price exceeds $0.73 per pound of gain. 

    With weak wheat prices, exploring alternatives like grazing or hay may lead to improved financial outcomes in many areas of the South. The Wheat and Small Grain Decision Aids (Link) serves as an economic and financial tool to assist every farmer in making informed decisions. Using your own data, yields, prices, and costs is essential for effectively analyzing these alternatives. These examples reflect the current wheat conditions and expectations in the Texas Rolling Plains. Please let us know if you need assistance in using this decision aid to help you make better choices for your farm.


    Abello, Pancho. “Wheat Alternatives: Maximizing Profitability in a Tough Market.Southern Ag Today 5(9.1). February 24, 2025. Permalink

  • Export Challenges Drive Down Sorghum Premiums

    Export Challenges Drive Down Sorghum Premiums

    Sorghum prices have traditionally tracked corn prices, adjusted by a premium or discount primarily dictated by export demand. However, recent trends reveal a decline in sorghum premiums, driven by reduced exports, particularly to China.

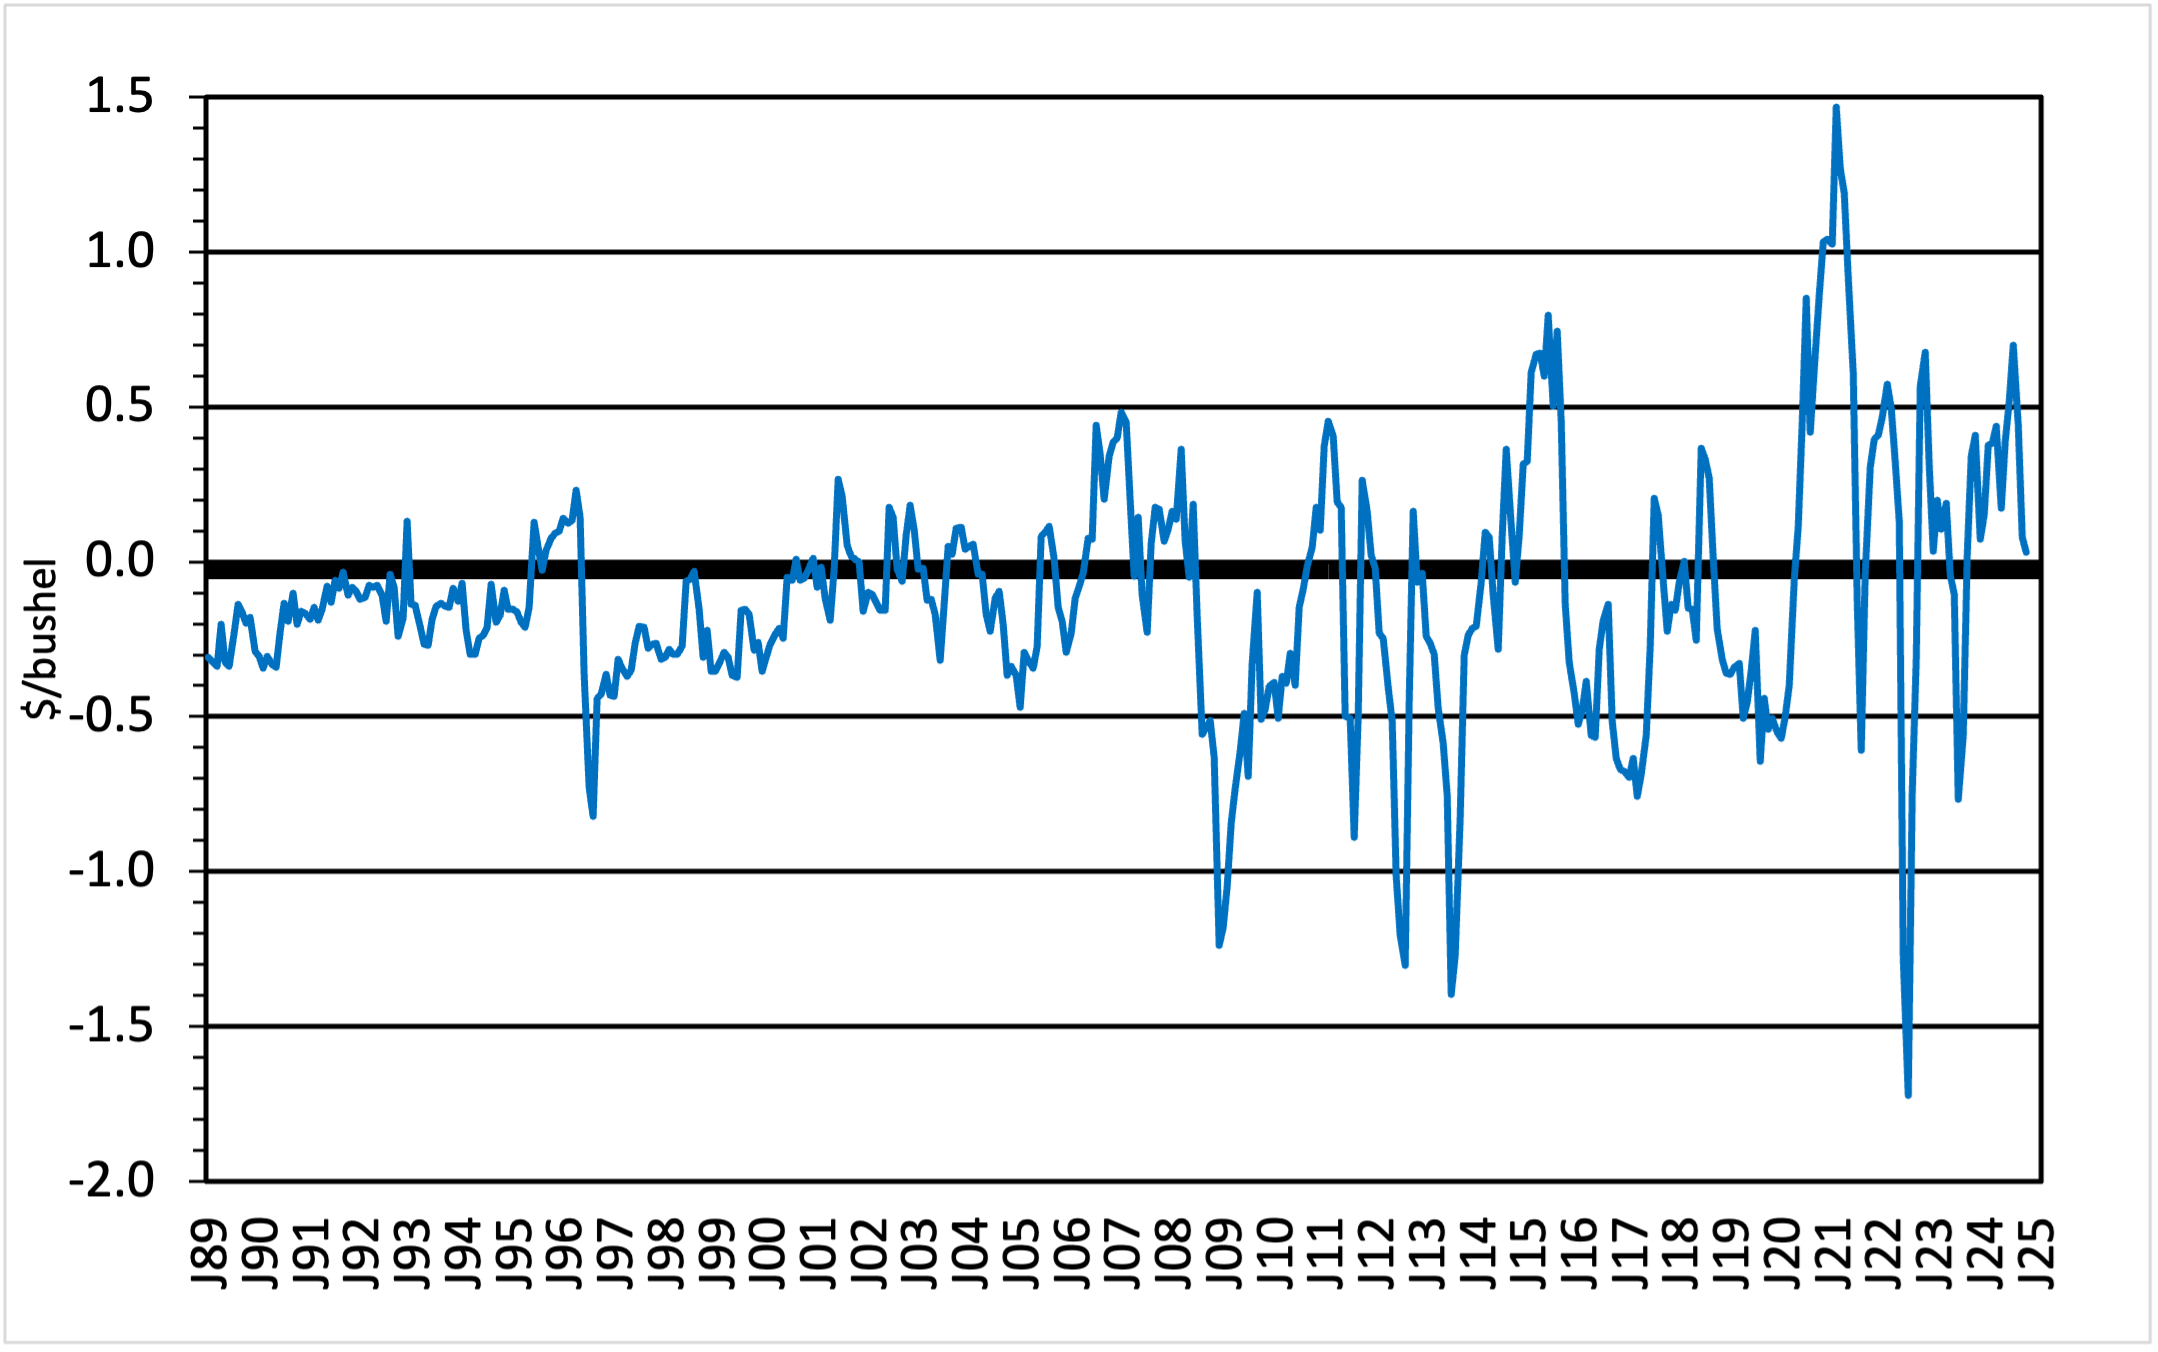
    In late 2024, sorghum premiums experienced a significant drop. Figure 1 shows U.S. Average Prices Received by Farmers for Sorghum Minus Corn (January 1989 – November 2024). In August, the premium stood at 70 cents over corn but fell to just 3 cents by November 2024. Projections suggest that December could witness a negative basis. This trend has been particularly pronounced in Texas, where January 2025 prices showed a discount of 59 cents per bushel compared to corn (Texas cash average price for the North, Central, and South Panhandle, USDA, AMS, Market News). 

    Figure 1. U.S. Average Prices Received by Farmers Sorghum Minus Corn January 1989-November 2024(Source: NASS/USDA/Ag Prices 12-31-24)

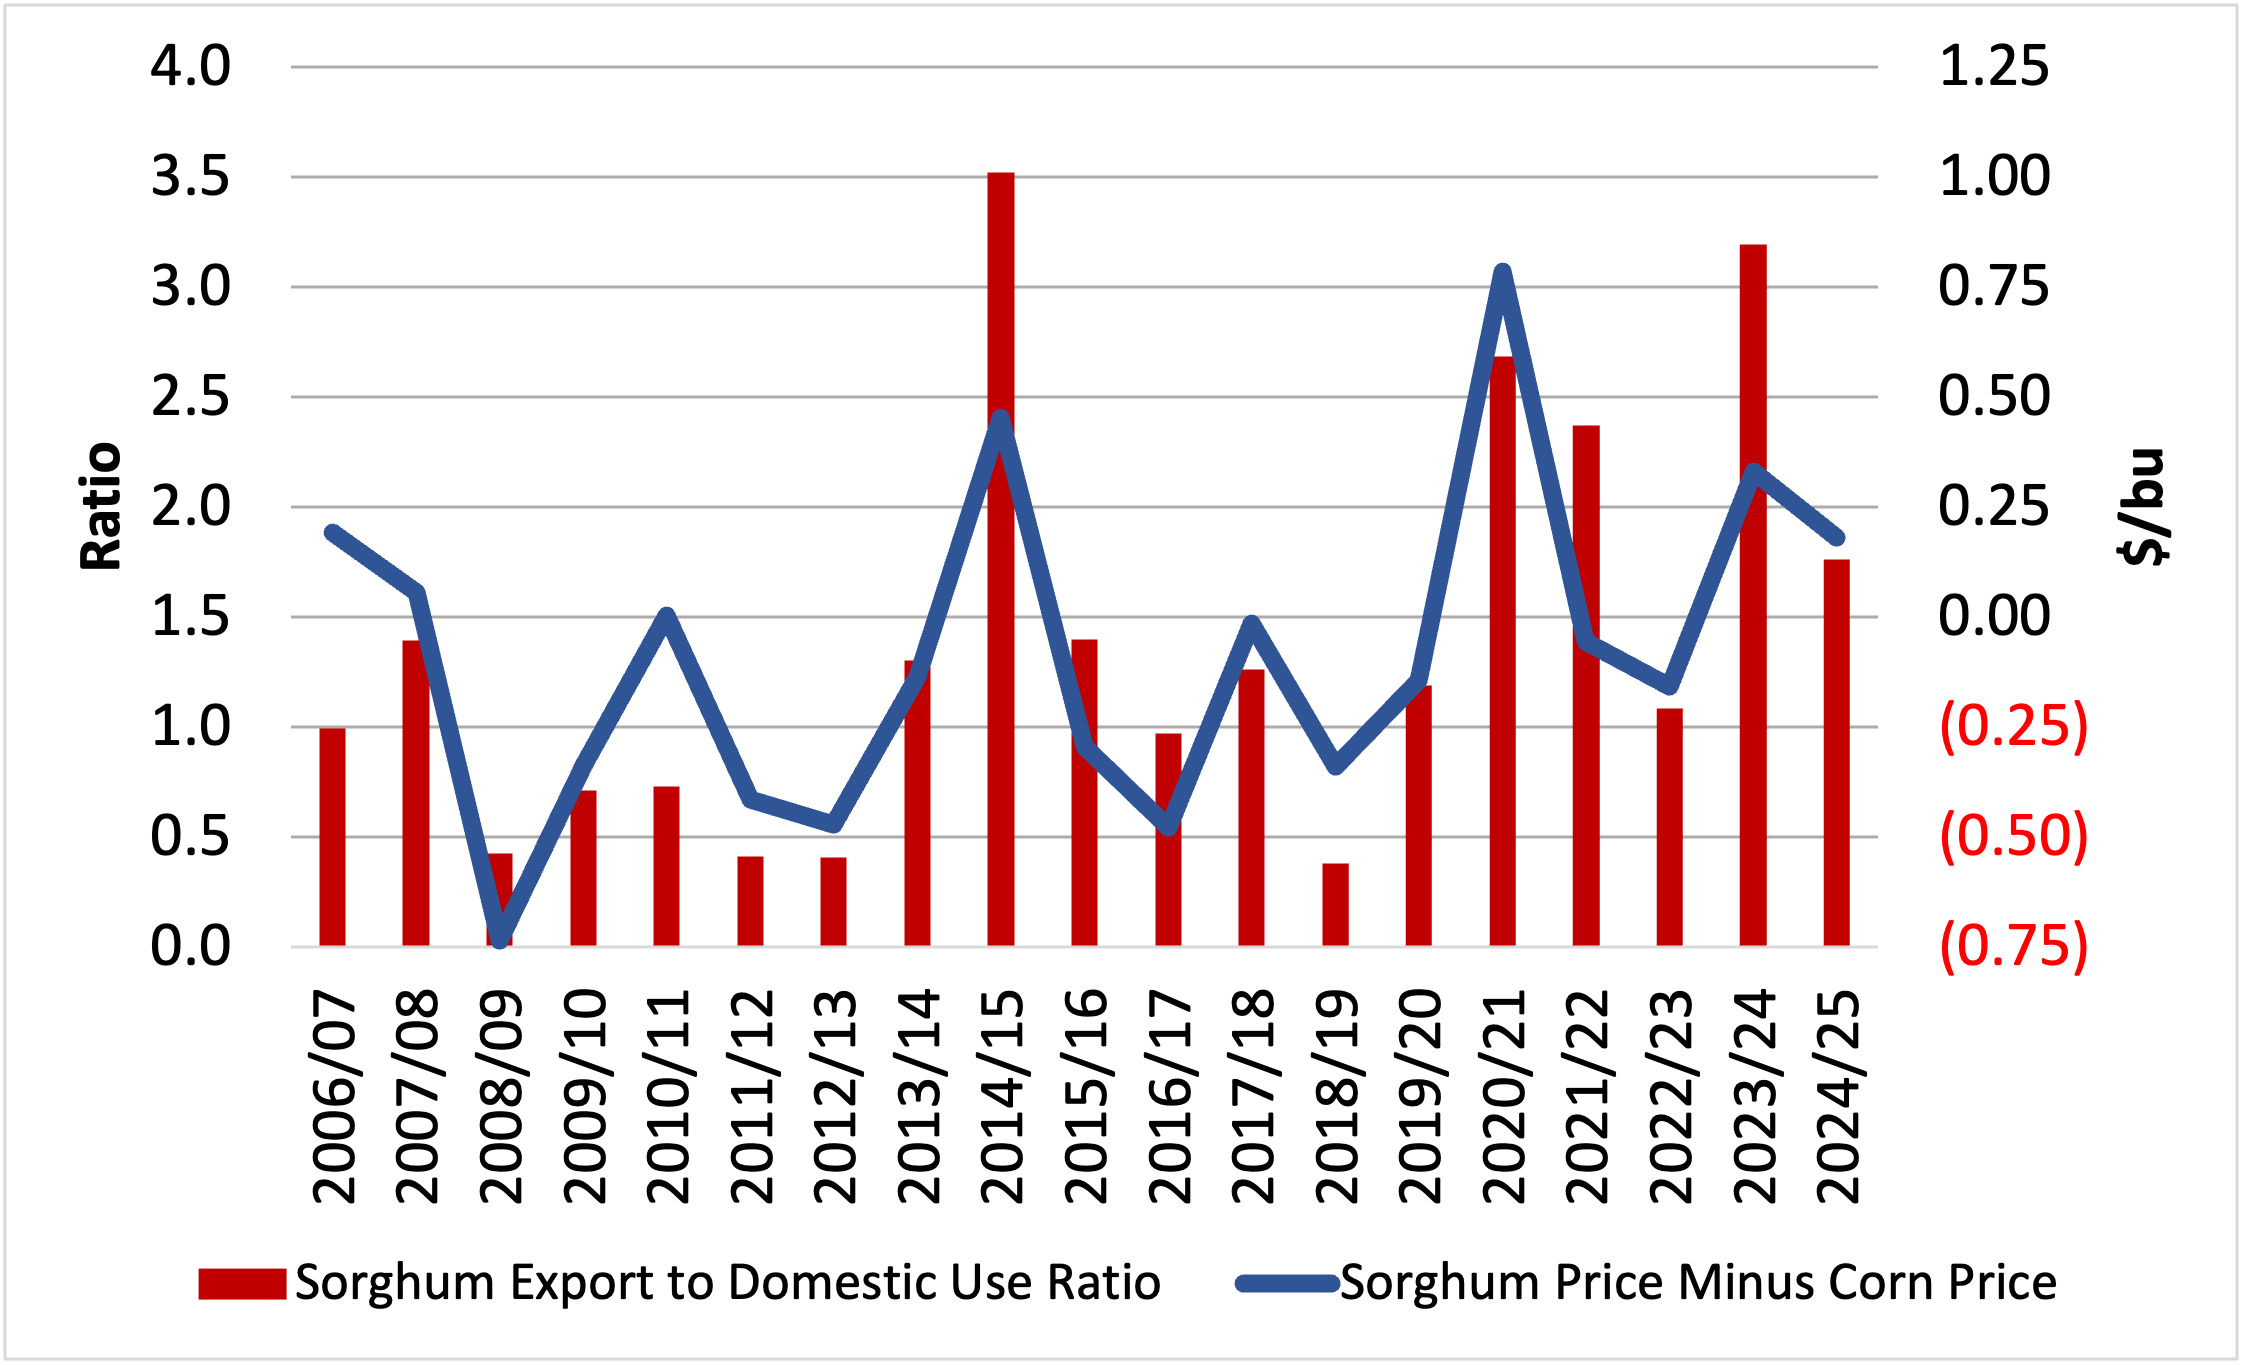
    During the 2023/24 season, the level of exports increased along with higher production and lower domestic consumption. Production in 2023/24 increased to 318 million bushels from the previous year of 188 million bushels, a result of significantly larger harvested acreage and better yields. The exports-over-domestic-consumption ratio also increased to 3.00 alongside better premiums over corn (Figure 2).

    Figure 2. Sorghum to Corn (Premium or Discount) and the ratio of sorghum exports to domestic use. Source (Dr. M. Welch, USDA February WASDE, USDA, NASS Agricultural Prices)

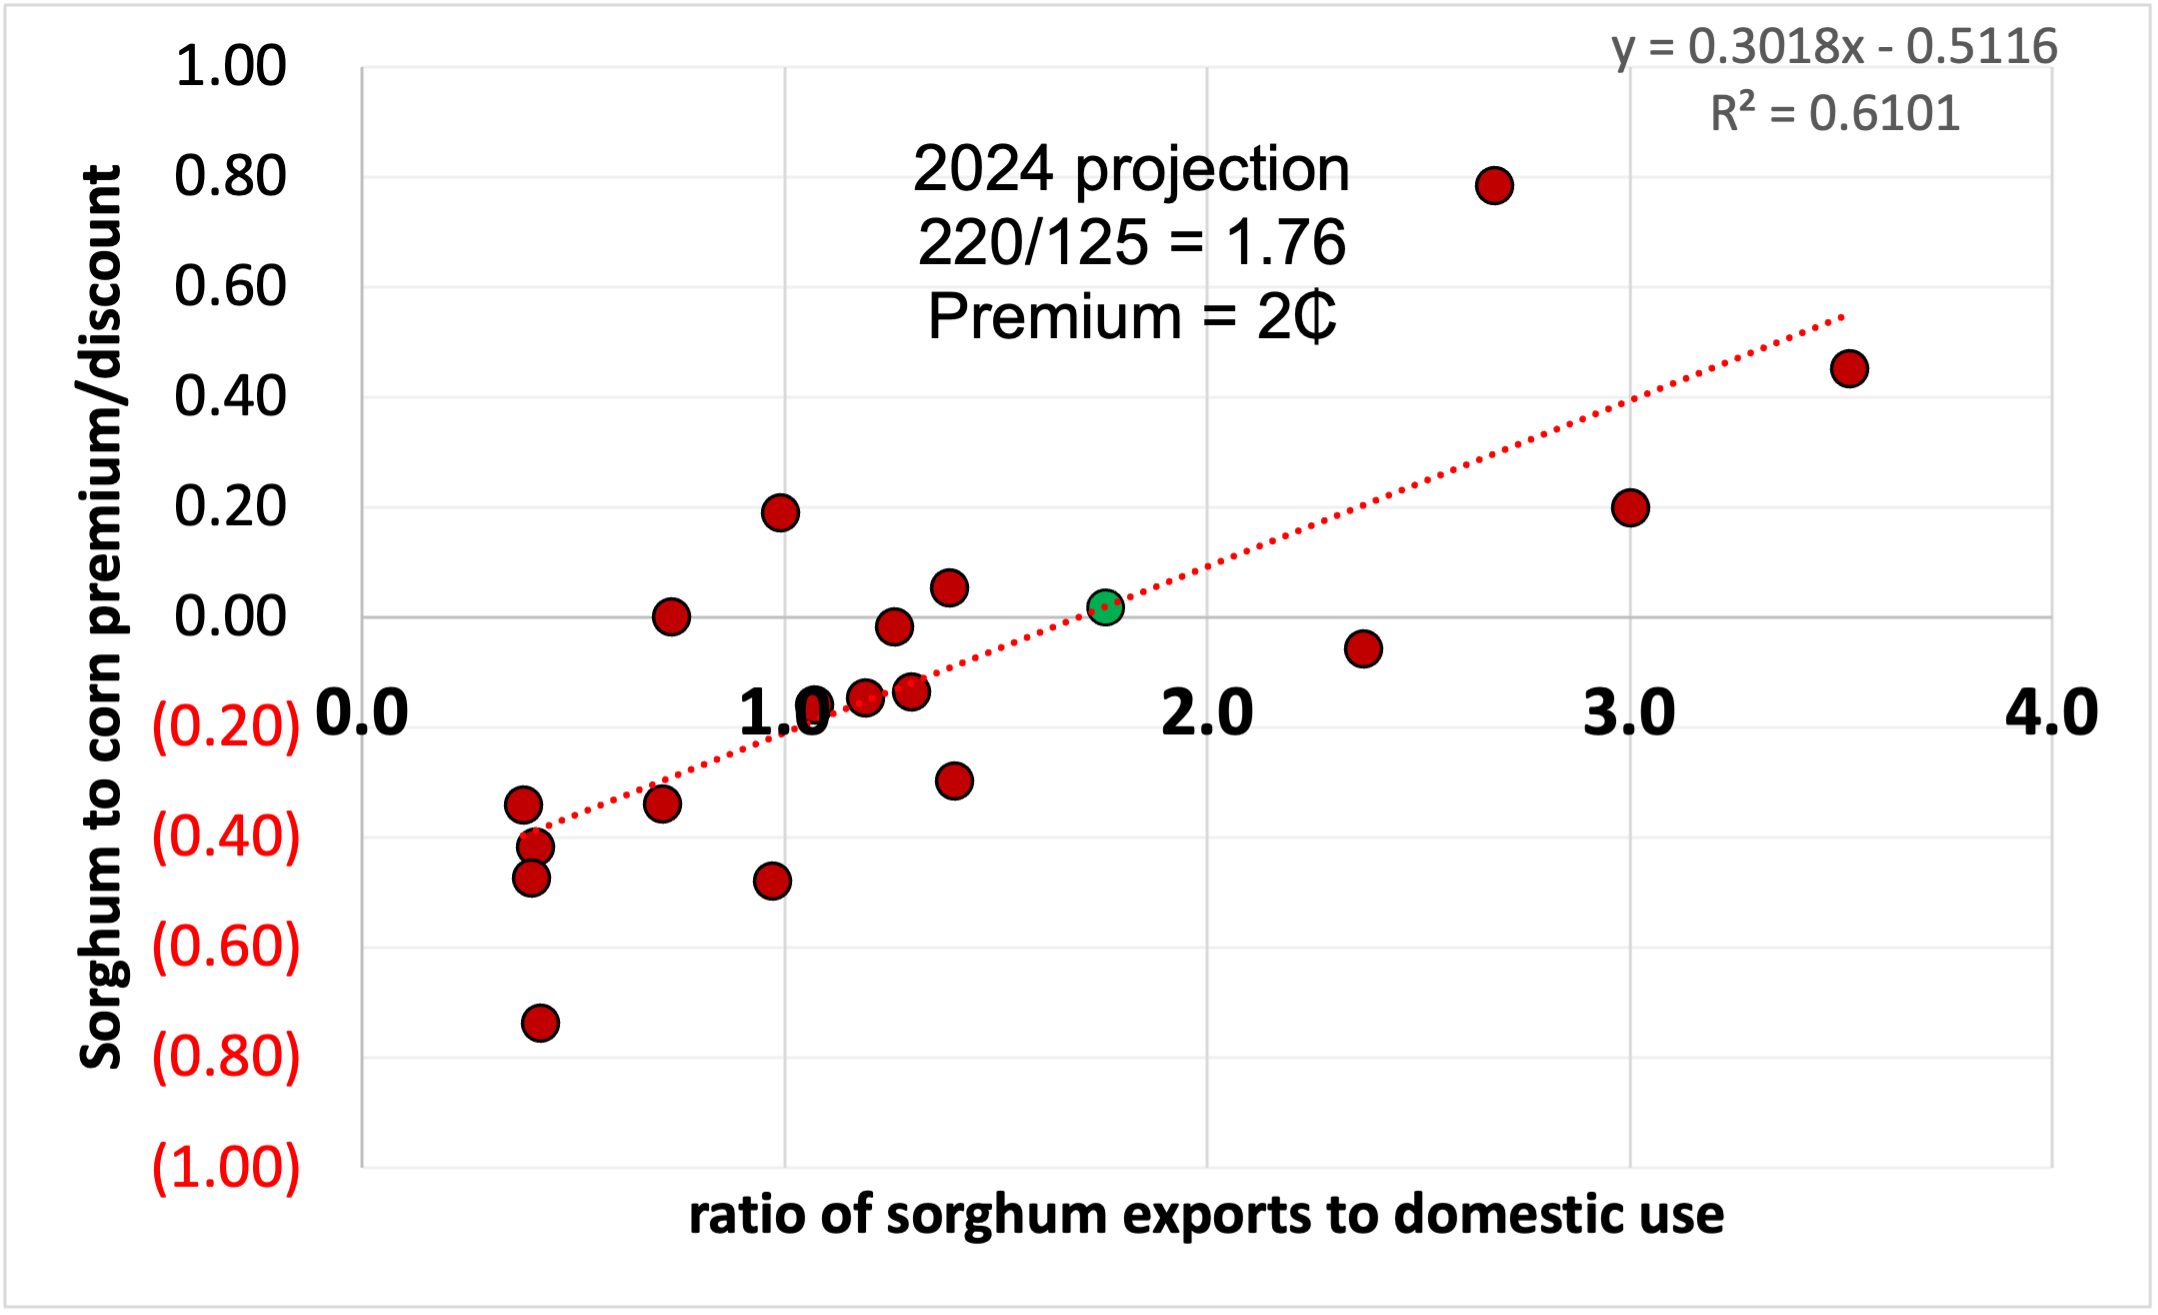
    Looking ahead, USDA’s January WASDE projections anticipate a 23-million-bushel increase in 2024/25 production, along with a rise in domestic use to 125 million bushels. WASDE increased area harvested and projected yield for the 2024/25 season compared to their latest report in December 2024. However, exports are projected to remain steady at 220 million bushels. This results in a reduced export-to-domestic-use ratio of 1.76, implying a likely premium of just 2 cents per bushel using Dr. Welch’s model to calculate sorghum-to-corn premium or discount as a function of the ratio of sorghum exports to domestic use (Figure 3). However, we are five months into the marketing year and this ratio may change as the marketing year progresses and USDA revises sorghum domestic use and export estimates.

    Figure 3. Sorghum-to-Corn Premium/Discount as Function of the Ratio of Sorghum Exports to Domestic Use. Source: Dr. Mark Welch, USDA February 2024 WASDE and 2024 Ag Outlook Conference.

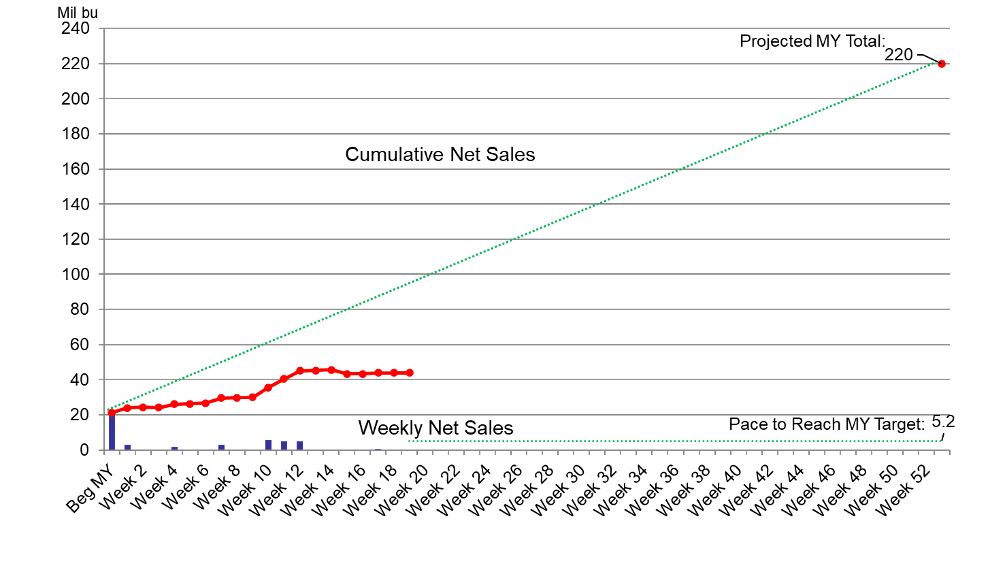
    The slowdown in Chinese sorghum imports has exacerbated discounts. As of January 2025, U.S. sorghum export sales commitments represent only 20% of the USDA’s projected marketing year exports, far below the historical average of 75% by March (Figure 4). This shortfall has driven premiums downward and widened discounts across various regions. With only 20% of projected exports committed by January 2025, achieving the USDA’s 220-million-bushel forecast appears challenging. The direction of trade policies and tariffs will influence U.S. sorghum exports. Whether this is positive or negative for sorghum prices is yet to be determined.

    Figure 4. U.S. Grain Sorghum Export Sales Commitments, 2024/25 MY. (Source: USDA, FAS, January 16, 2025). 


    Abello, Pancho. “Export Challenges Drive Down Sorghum Premiums.Southern Ag Today 5(4.3). January 22, 2025. Permalink

  • Increase in PRF Adoption in the Southern Region

    Increase in PRF Adoption in the Southern Region

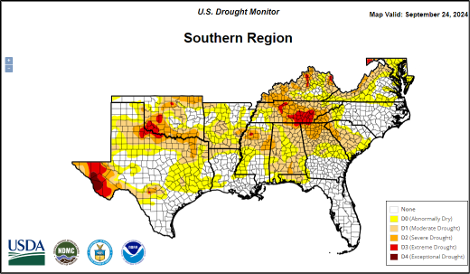
    In recent years, drought has been a common occurrence in many Southern states, including Texas, Oklahoma, Louisiana, Arkansas, Mississippi, Alabama, Florida, Georgia, South Carolina, North Carolina, Virginia, Maryland, Tennessee, and Kentucky. The U.S. Drought Monitor reported that approximately 65% of this area was experiencing some level of drought as of September 24, 2024 (Fig 1).  Producers are increasingly adopting the USDA’s Pasture, Rangeland, and Forage Insurance (PRF), recognizing its crucial role in supporting ranchers during these challenging times.

    Figure 1. U.S. Drought Monitor, Southern Region 9-24-24

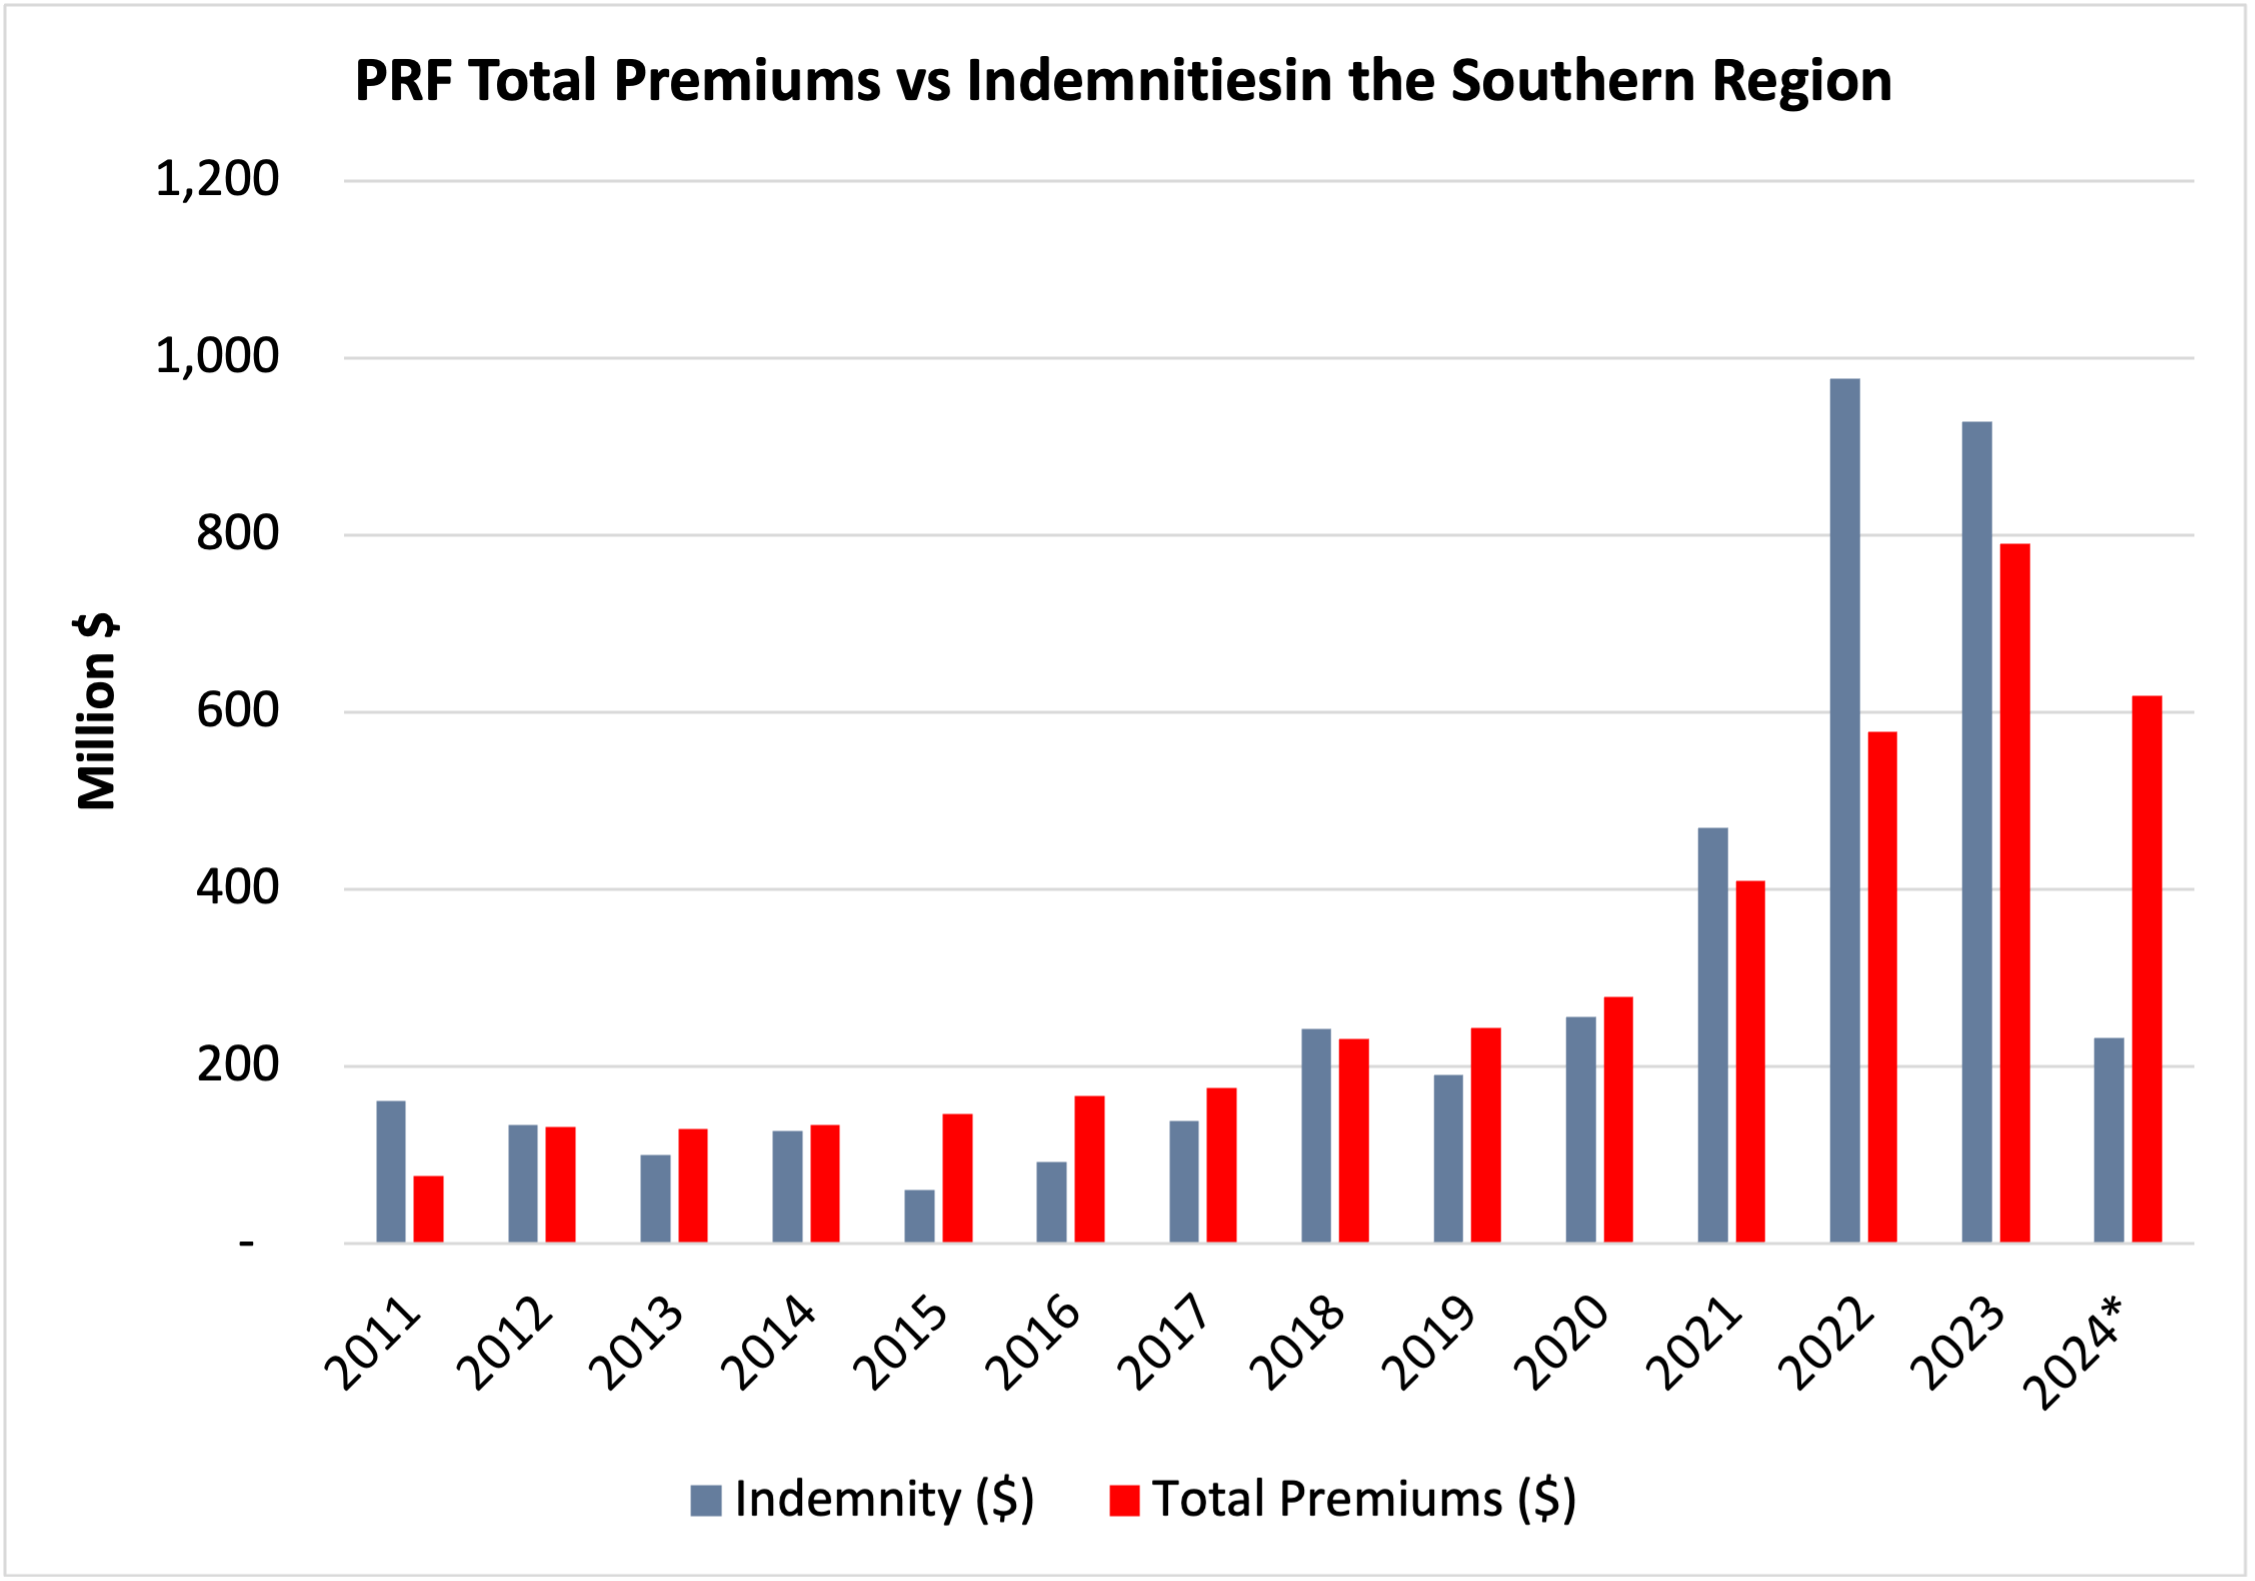
    The PRF program was established in 2007 to help livestock and forage producers mitigate the risks associated with forage loss due to lower precipitation. The program is available in 48 states and covers over 247 million acres. The severity of droughts and the effectiveness of PRF have led to an increasing adoption of this risk management tool each year. According to the latest data, the average indemnity payment since 2011 from the region was similar to total premiums paid. During the droughts of 2021, 2022, and 2023, the indemnities paid were 14%, 69%, and 17% higher than the total premium paid, totaling $2.372 billion in indemnities versus $1.776 billion in total premiums during those three years. (Fig 2)

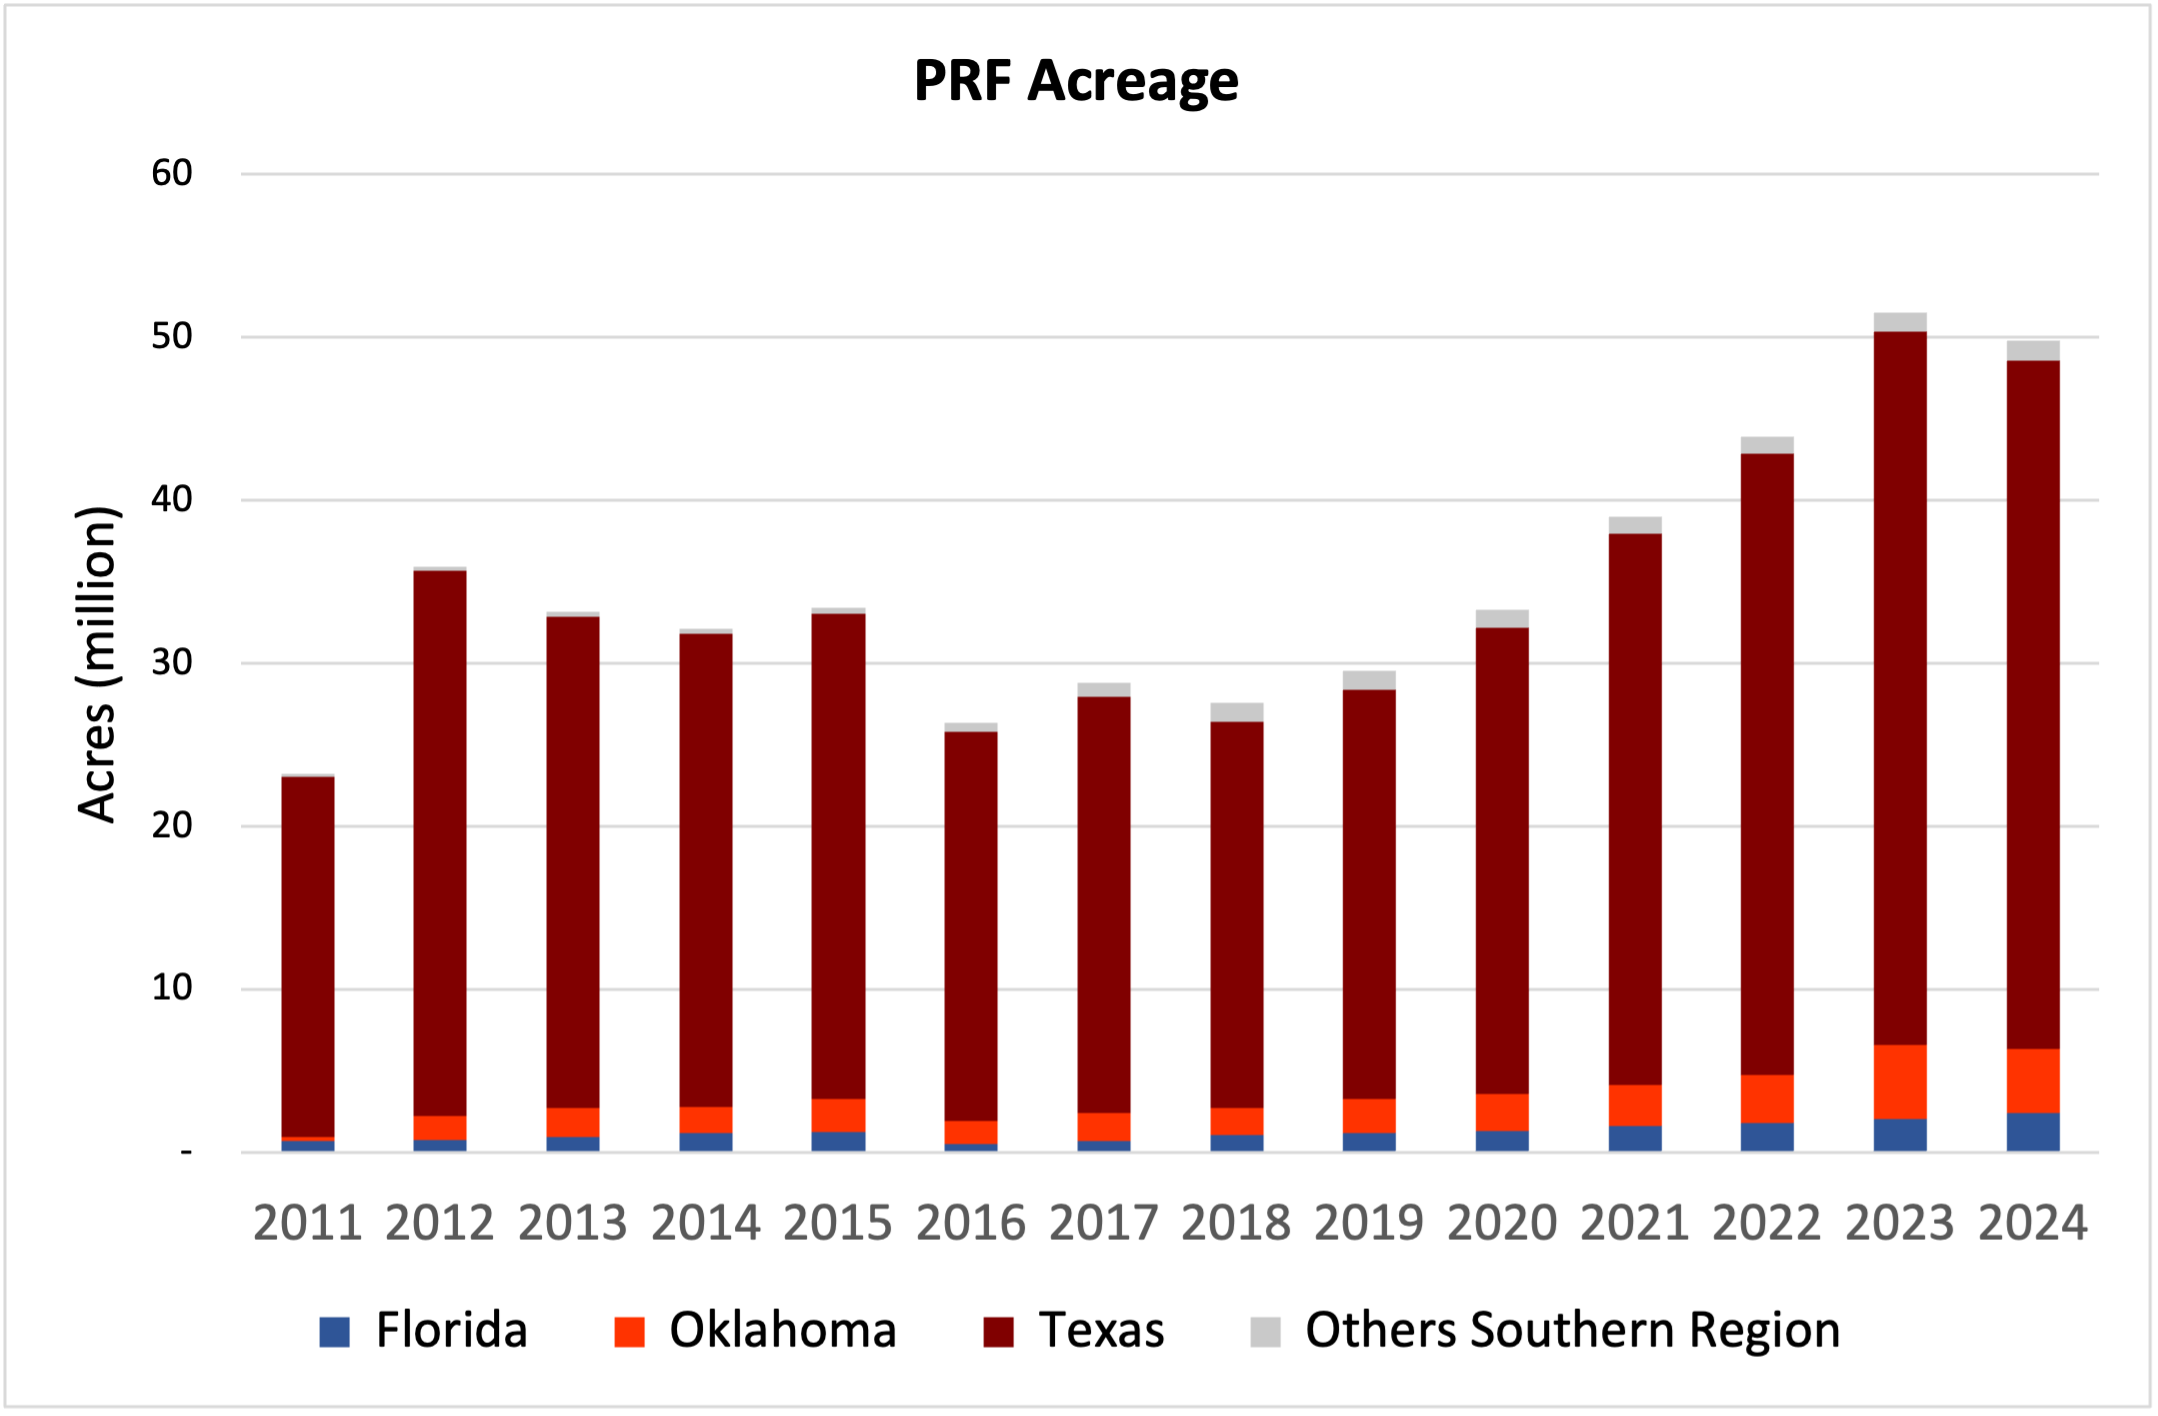
    In the Southern Region, the adoption of this program has more than doubled since its inception, with enrolled acres increasing from 20.8 million in the first year to approximately 49.8 million in 2024. With its vast area of open rangeland, Texas dominates PRF acreage enrollment, followed by Oklahoma and Florida.  These three states have seen significant increases in the adoption of PRF insurance, with Texas enrolling 42.8 million acres in 2024 (a 191% increase from 2011), Oklahoma enrolling around 4 million acres (a 1,491% increase from 2011), and Florida insuring 2.4 million acres in 2024 (a 344% increase from 2011). The other Southern Region states have also seen substantial increases in insured acres, indicating the growing recognition of the program’s benefits (739% increase from 2011). (Fig 3). For more information on PRF, consult the USDA Fact Sheet. If you’re considering purchasing this insurance, you can find a list of approved agents and insurance companies on the USDA website.

    Figure 2. PRF Premiums Paid by Farmers vs Indemnities Received in the Southern States (*2024 Partial Results)

    Figure 3. PRF Enrolled Acres in the Southern Region


    Abello, Pancho. “Increase in PRF Adoption in the Southern Region.Southern Ag Today 4(40.1). September 30, 2024. Permalink

  • Prospects for Sorghum Premiums in the Upcoming Season: A Forecast Analysis

    Prospects for Sorghum Premiums in the Upcoming Season: A Forecast Analysis

    Sorghum prices generally follow corn prices.  Since 2006/07, the biofuel era, the largest discount of sorghum to corn was -$0.74 per bushel; the largest sorghum premium to corn was +$0.79; and the average price relationship was -$0.11.   (Figure 1).

    Figure 1. Monthly Average Sorghum and Corn Prices Paid to Farmers by Marketing Year

    The level of sorghum premium or discount is largely contingent upon demand, predominantly influenced by exports. Figure 2 shows the relationship between the sorghum exports-to-domestic-use ratio and the premium or discount received by U.S. farmers.

    During the 2020/21 season, we witnessed a significant increase in sorghum premiums due to increased export demand. These premiums occurred because of the US-China Phase One Trade Agreement (U.S. sorghum exports are not subject to tariff-rate quotas like corn), the recovery of the Chinese swine sector, and high corn prices that supported high exports of U.S. sorghum to China. The export ratio over domestic consumption during 2020/21 increased to 2.68 (Figure 2). Exports during this season totaled 279 million bushels, while domestic consumption totaled 104 million bushels. After 2020/21, the ratio of exports over domestic consumption decreased due to lower yields, drought, and fewer exports, reaching a low level of 1.08 in the 2022/23 season and a discount in the price of sorghum to corn of -$0.16 per bushel.

    Figure 2: Sorghum to Corn (Premium or Discount) and the Ratio of Sorghum Exports to Domestic Use

    Source (Dr. M. Welch, USDA February WASDE, USDA, NASS Agricultural Prices)

    During the 2023/24 season, the level of exports increased along with higher production and lower domestic consumption. Production in 2023/24 increased to 318 million bushels from the previous year of 188 million bushels, a result of significantly larger harvested acreage and better yields. The exports-over-domestic-consumption ratio also increased to 3.00 alongside better premiums over corn.

    Looking forward to next season, production for 2024/25 is expected to increase again, given USDA’s February WASDE projections and projections from the Ag Outlook Conference on February 15, 2024. Planted acres are expected to decrease by 2.8% from the previous season, but the area harvested projection is unchanged with a return to more normal growing conditions. The projected yield in 2024 of 69.2 bushels per acre is much better than the drought impacted yields of the last two years, up 33% compared to 2023. 

    Domestic use and exports are expected to increase next season. Domestic use is projected to be 115 million bushels (+35 million bushels), while exports are expected to be around 295 million bushels (+55 million bushels). This level of exports and domestic consumption results in a ratio of sorghum exports to domestic use of 2.57. The sorghum premium over corn price at this ratio would be around $0.26/bu using Dr. Welch’s model to calculate sorghum-to-corn premium or discount as a function of the ratio of sorghum exports to domestic use (Figure 3).  While this price relationship is not exact, the ratio of sorghum exports to domestic use in the 2024/25 marketing year is projected to be the 4th highest of the biofuel era, suggesting a better-than-average sorghum price relationship to corn. 

    Figure 3: Sorghum-to-Corn Premium/Discount as Function of the Ratio of Sorghum Exports to Domestic Use

    Source: Dr. Mark Welch, USDA February 2024 WASDE and 2024 Ag Outlook Conference.

    Abello, Francisco Pancho. “Prospects for Sorghum Premiums in the Upcoming Season: A Forecast Analysis.Southern Ag Today 4(12.1). March 18, 2024. Permalink

  • Producers Embrace USDA’s Livestock Risk Protection Program

    Producers Embrace USDA’s Livestock Risk Protection Program

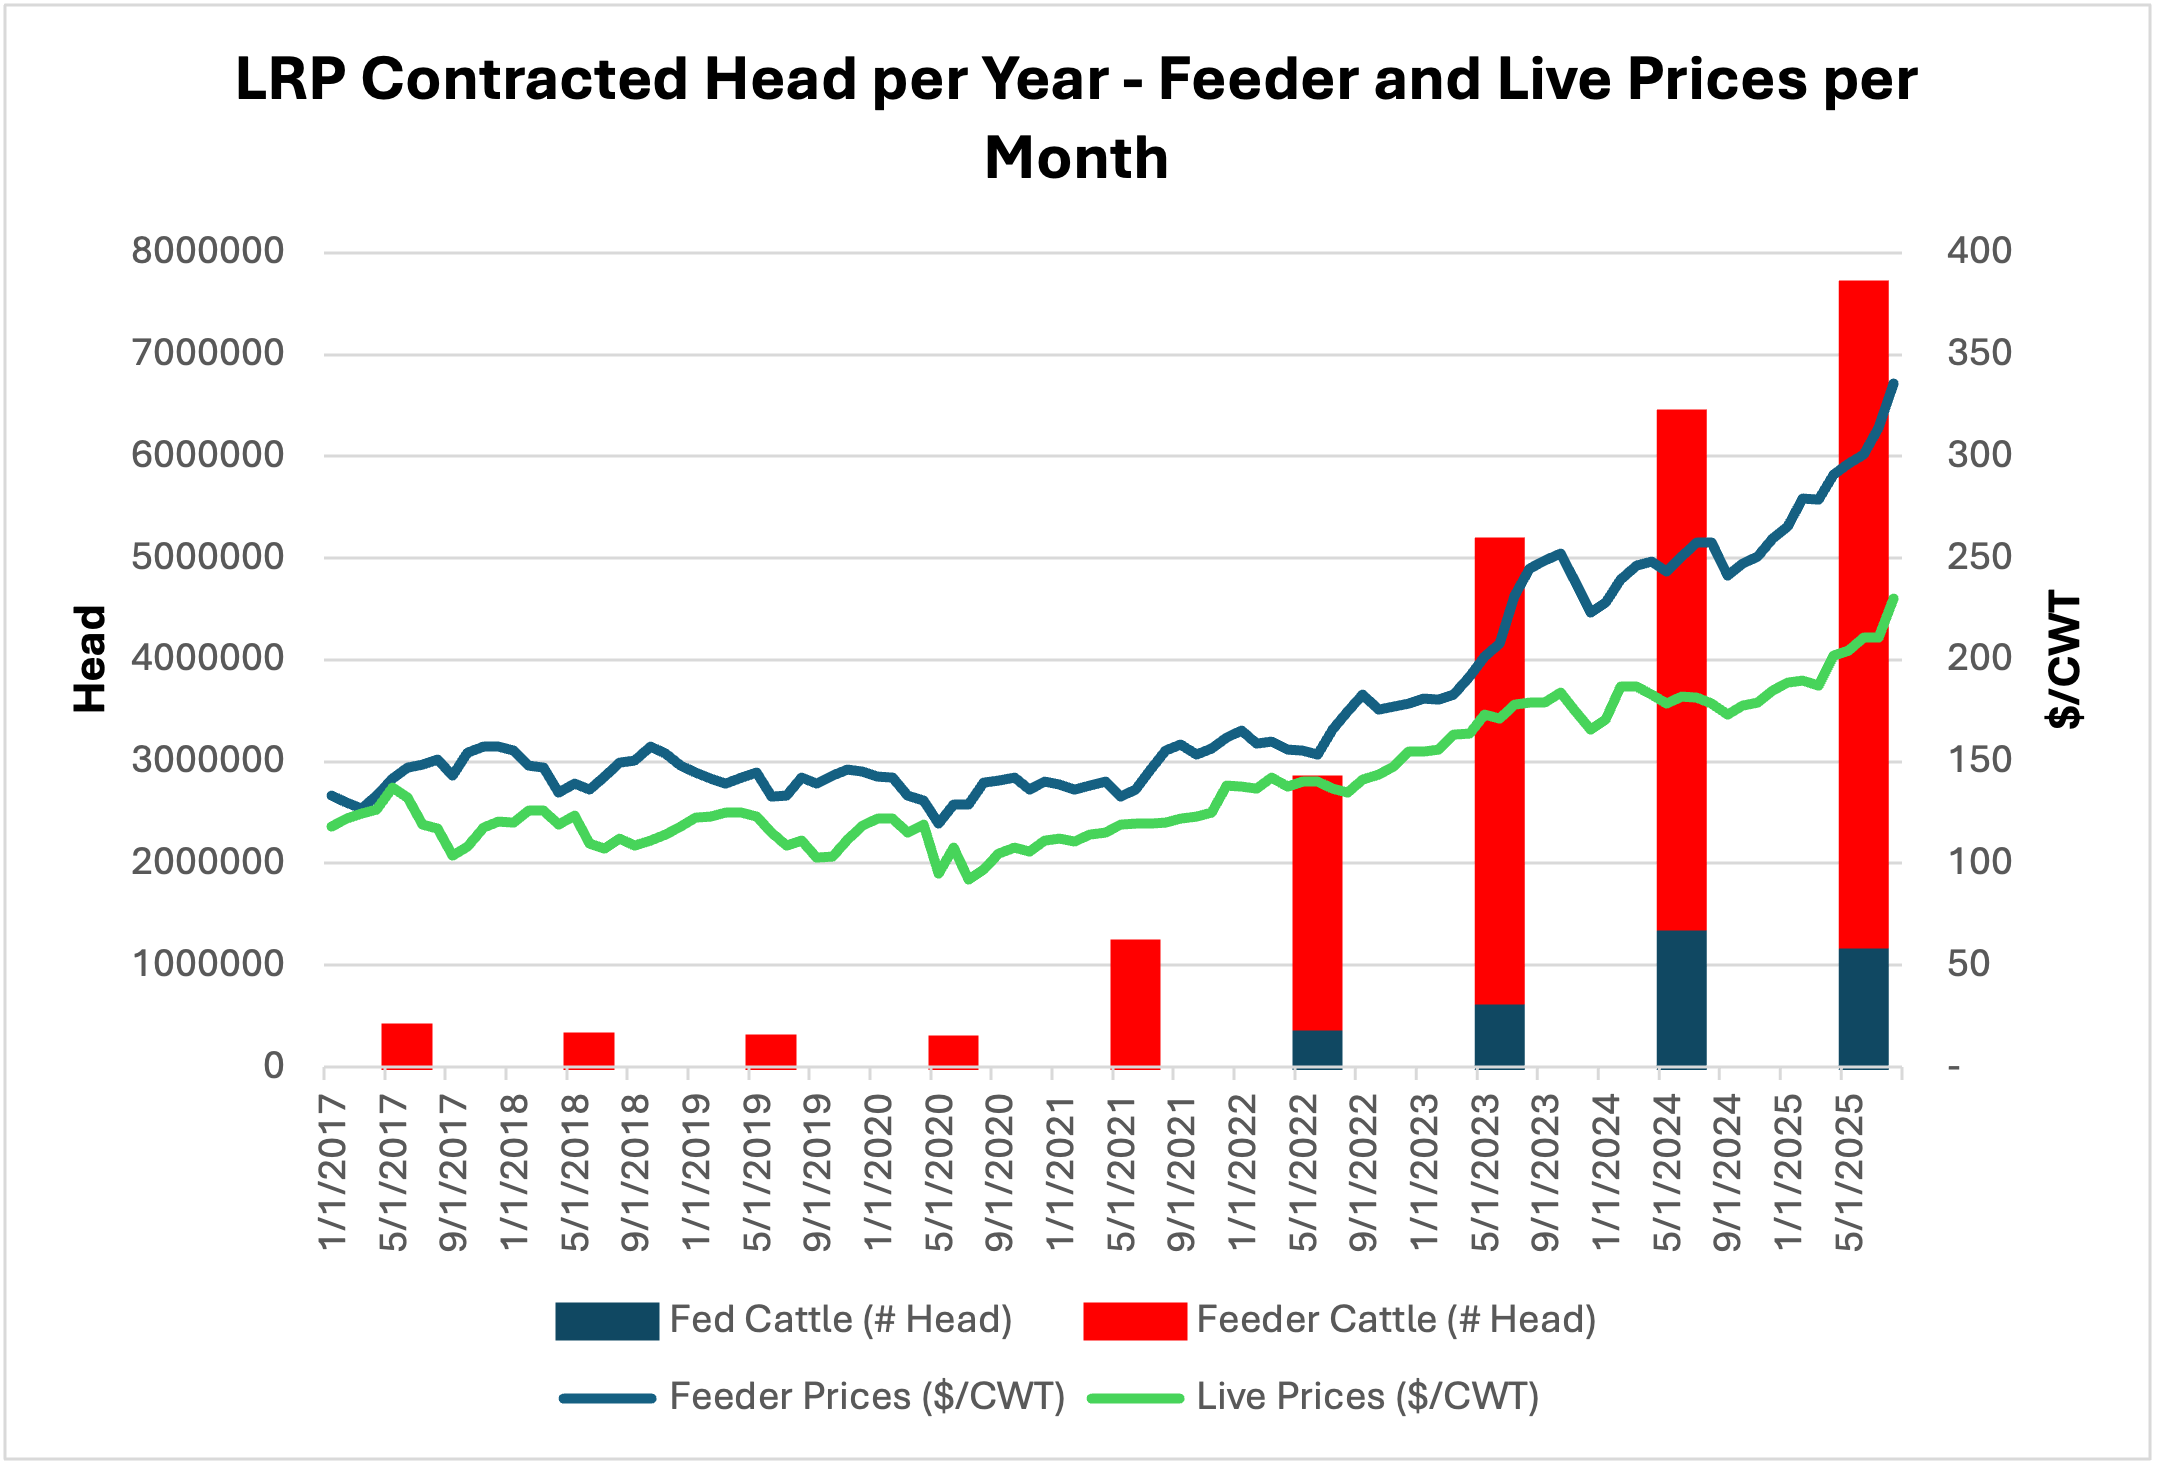
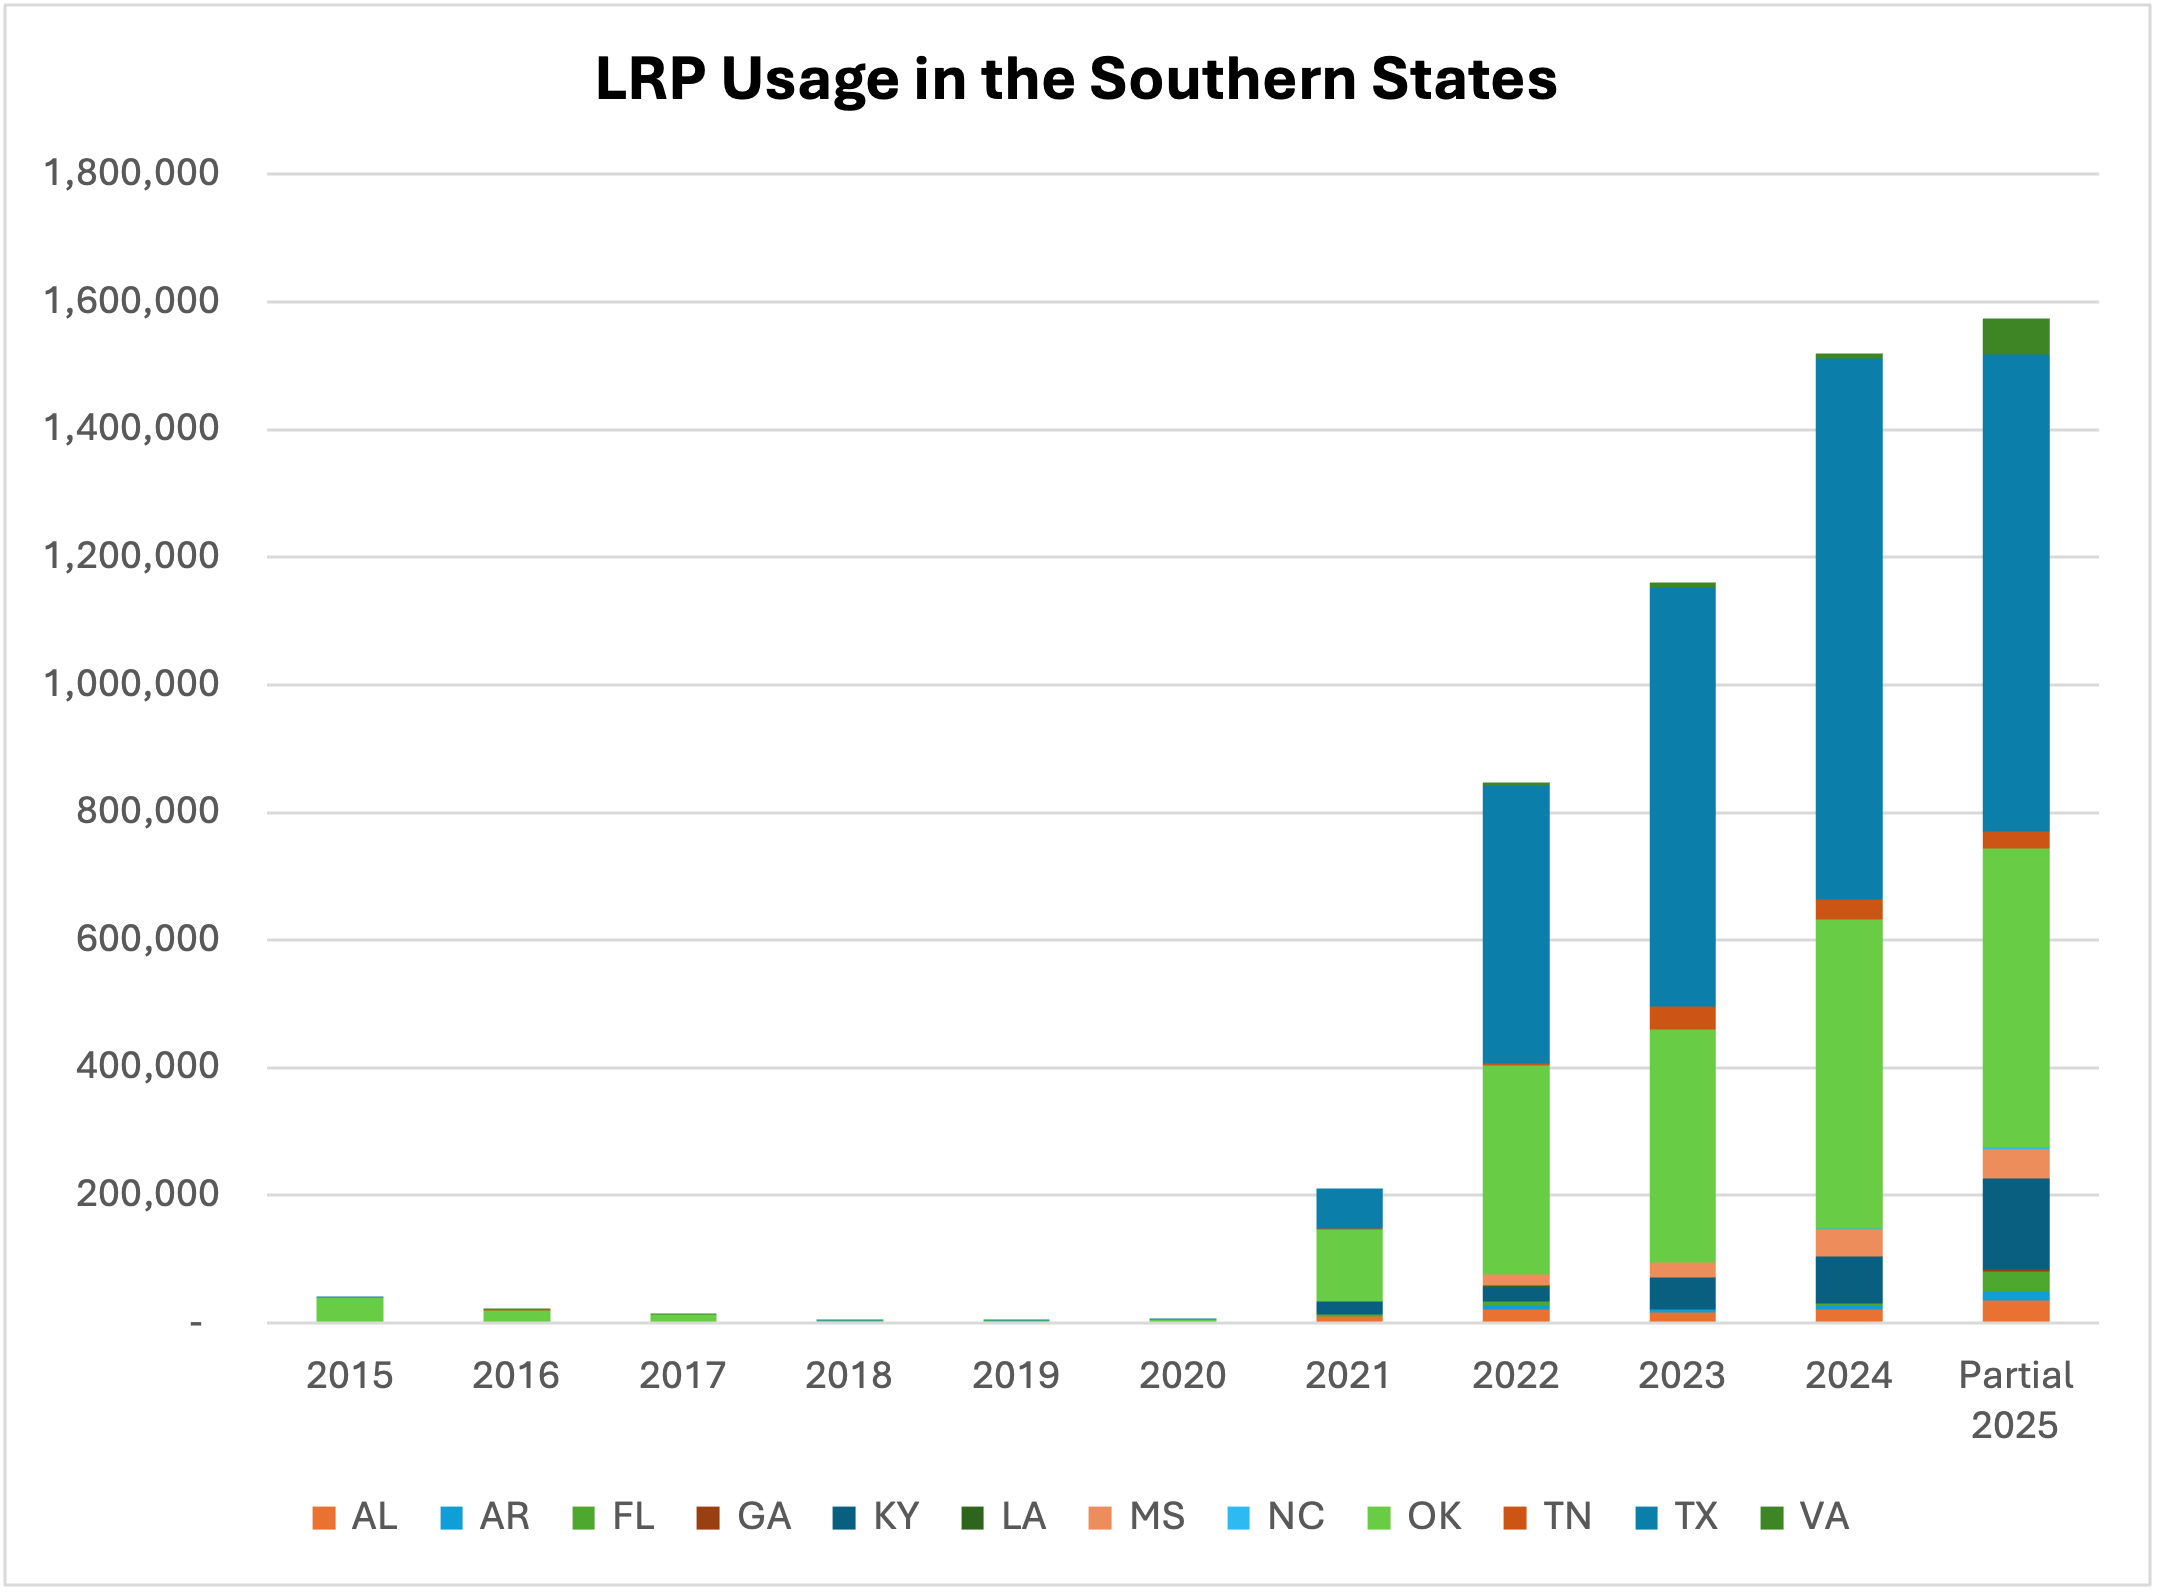
    Producers across the United States and the Southern States are increasingly adopting the Livestock Risk Protection Program, commonly known as LRP. This program, which is designed to protect ranchers against falling cattle prices, has witnessed a remarkable surge. From a mere 71 thousand head covered in 2017, the usage of LRP has increased rapidly to 5.2 million head by October 2023. In 2022, ranchers insured 3.4 million head, up from 1.8 million in 2021. Ranchers’ use of LRP in the Southern region has contributed significantly to this growth (Figure 1). As of October 2023, ranchers have insured approximately 1 million head annually through the LRP program, with Texas and Oklahoma insuring 56% and 34% of this total, respectively.

    Figure 1: LRP Usage in the Southern States

    This increase occurs alongside increases in subsidy levels and other changes to LRP and the significant improvement in the market feeder and live cattle prices (Figure 2). During 2019 and 2021, the USDA introduced several modifications to the LRP program. These changes not only reduced the producers’ portion of premium payments but also allowed them to defer premium payments until the end of the endorsement period. The option to pay premiums at the ending date offers ranchers a considerable cash-flow advantage. Another benefit of the LRP program is it doesn’t require a minimum number of cattle to be insured, meaning cow-calf or stocker producers with just a few head can use it.

    Additionally, the rise in cattle prices has emphasized the importance of implementing a solid price risk management plan. LRP can help minimize financial losses, secure profit margins, and reduce the risk of business failure, particularly in the face of higher investment levels. The increased adoption of LRP reflects a growing number of ranchers who are utilizing risk management plans in their operations.

    Figure 2: LRP Head per Year and Feeder and Live Prices per Month

    Source: USDA – RMA. Livestock Risk Protection Participation. https://www.rma.usda.gov/Information-Tools/Summary-of-Business/Livestock-and-Dairy-Participation


    Abello, Pancho. “Producers Embrace USDA’s Livestock Risk Protection Program.Southern Ag Today 3(44.2). October 31, 2023. Permalink