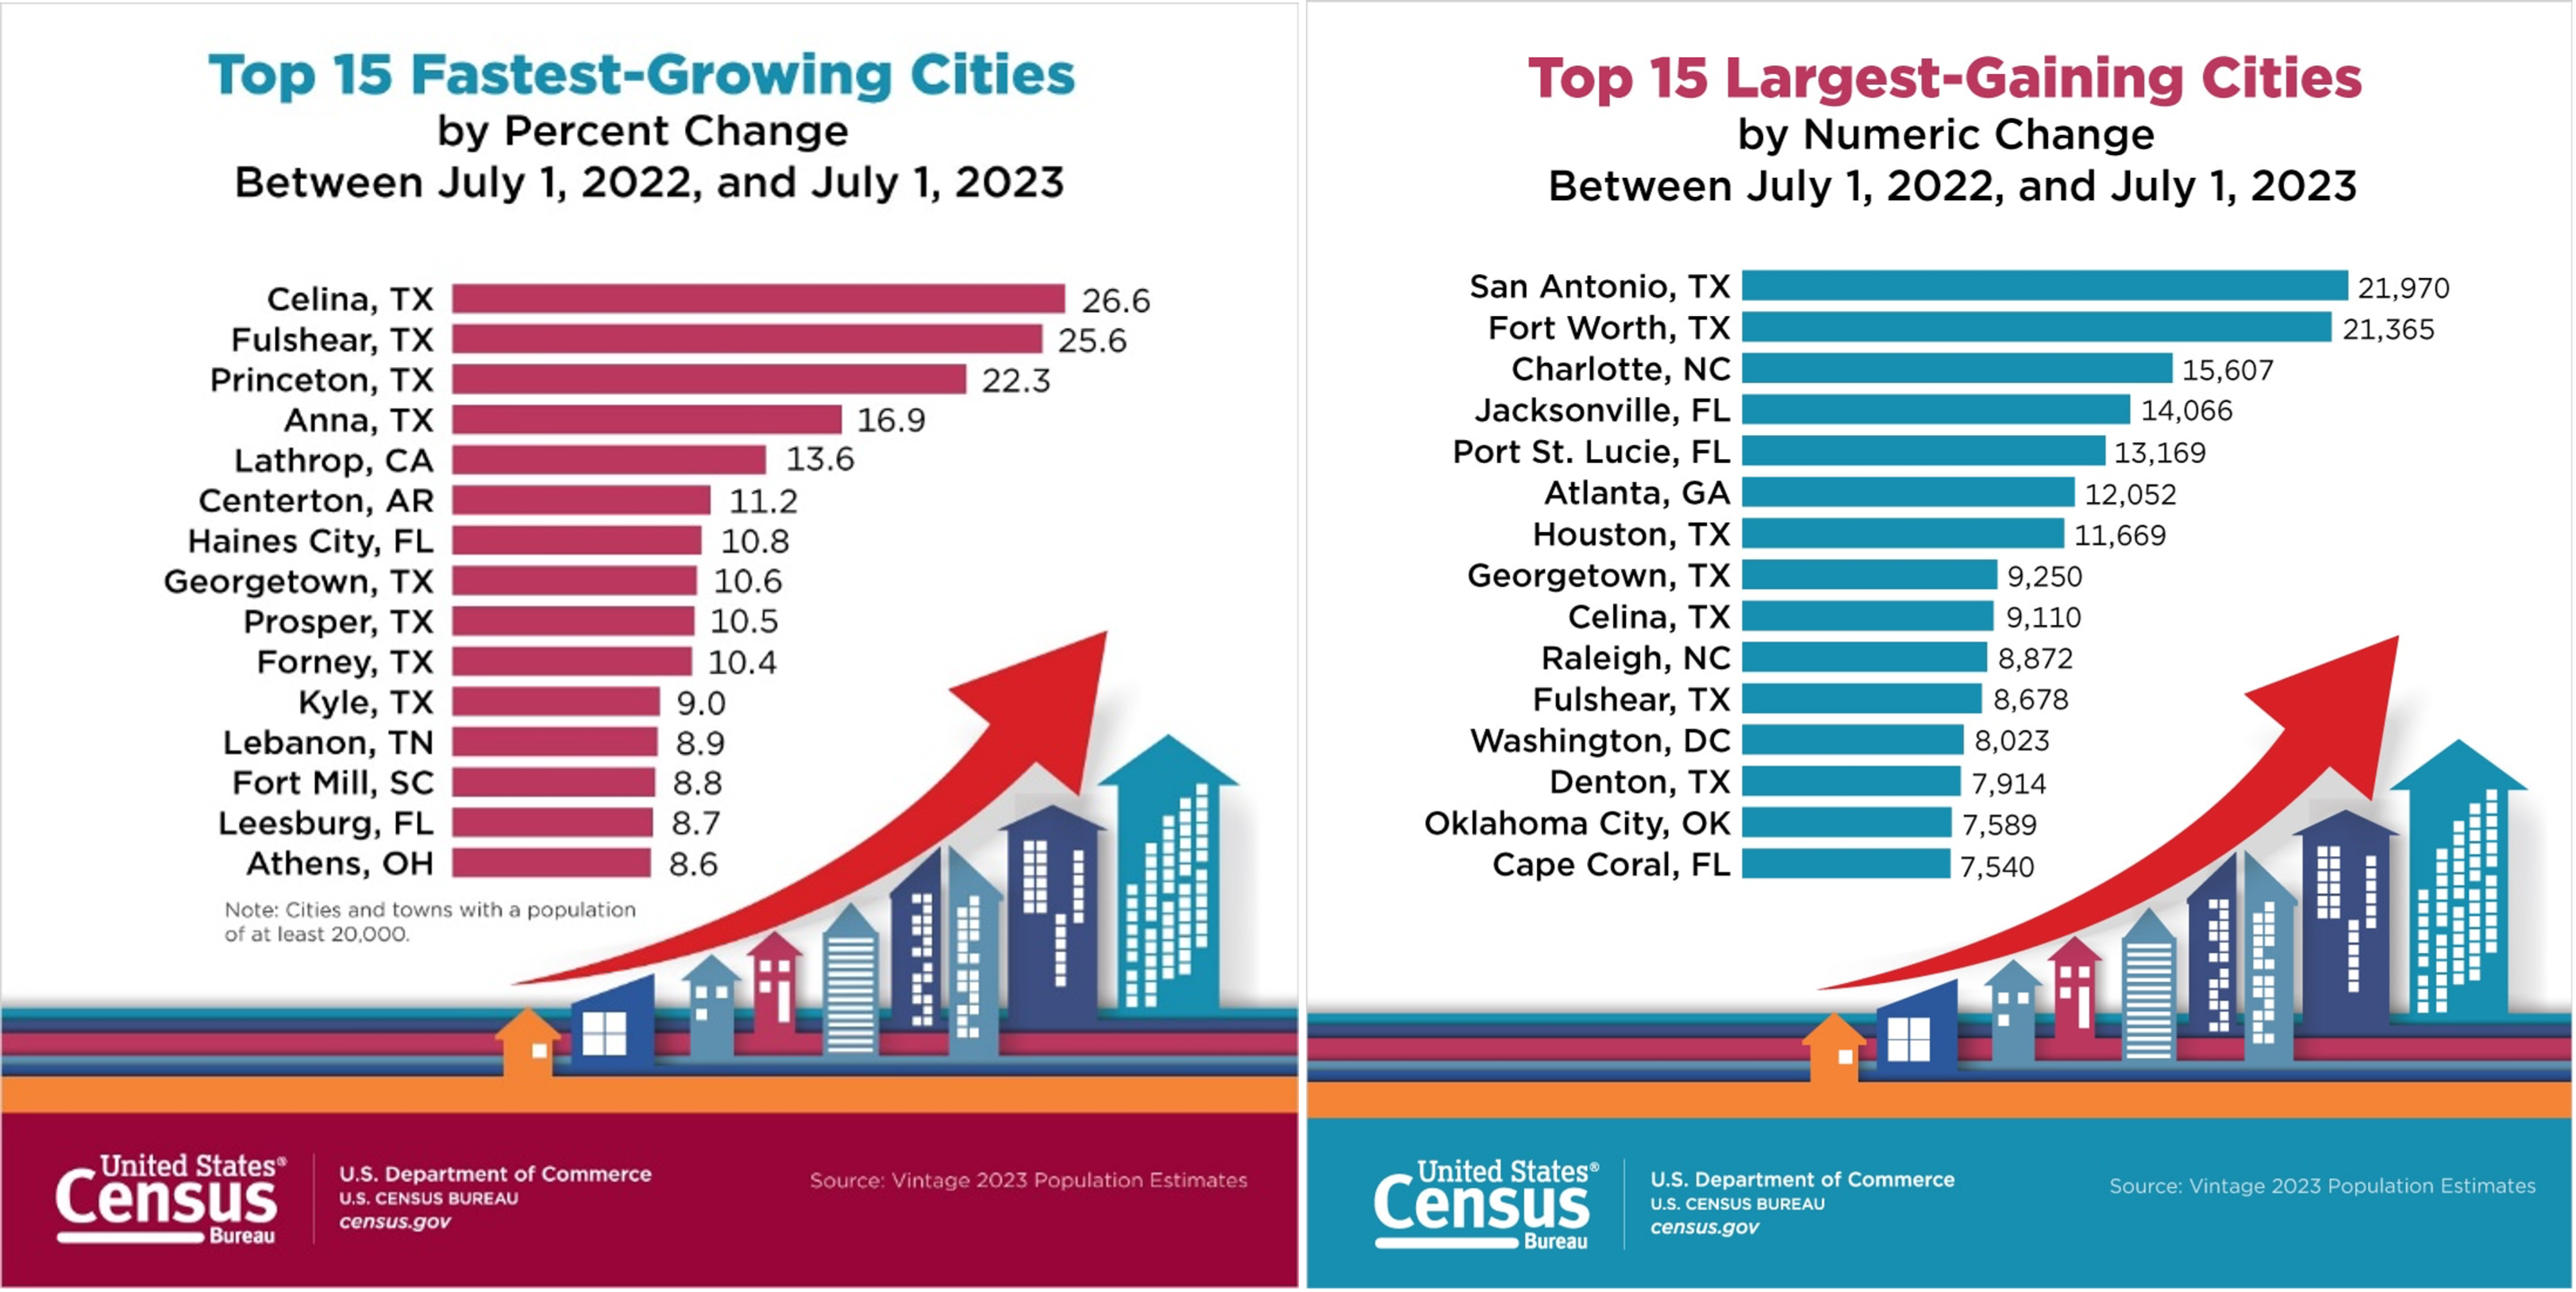
At first glance, services like Instacart, Hello Fresh, and DoorDash may seem unrelated to Community-Supported Agriculture (CSA), a business model that connects consumers directly with local farmers through seasonal subscriptions and spotlights the shortest food miles, strong community ties, and sustainable farming. However, the rapid growth of these convenience-oriented platforms (Kaczmarski, 2024; Restrepo & Zeballos, 2024; Statista, n.d.) is reshaping how people shop, cook, and eat. As more consumers prioritize convenience and time savings, traditional CSA models are under pressure to adapt or risk becoming obsolete.
When it comes to delivery meals, services like Instacart, Hello Fresh, and DoorDash cater to different food preferences, such as grocery delivery, meal kits, and cooked meals, each offering increasing levels of convenience. Instacart provides the convenience of traditional grocery shopping without leaving home. For those who prefer not to shop for groceries themselves, Hello Fresh simplifies meal preparation with curated kits designed for busy individuals or those less familiar with cooking. Finally, for people who neither want to cook nor shop, DoorDash delivers ready-to-eat restaurant meals within minutes. The popularity of these services reflects a broader shift in food purchasing habits where time savings often take priority over the cooking experience itself.
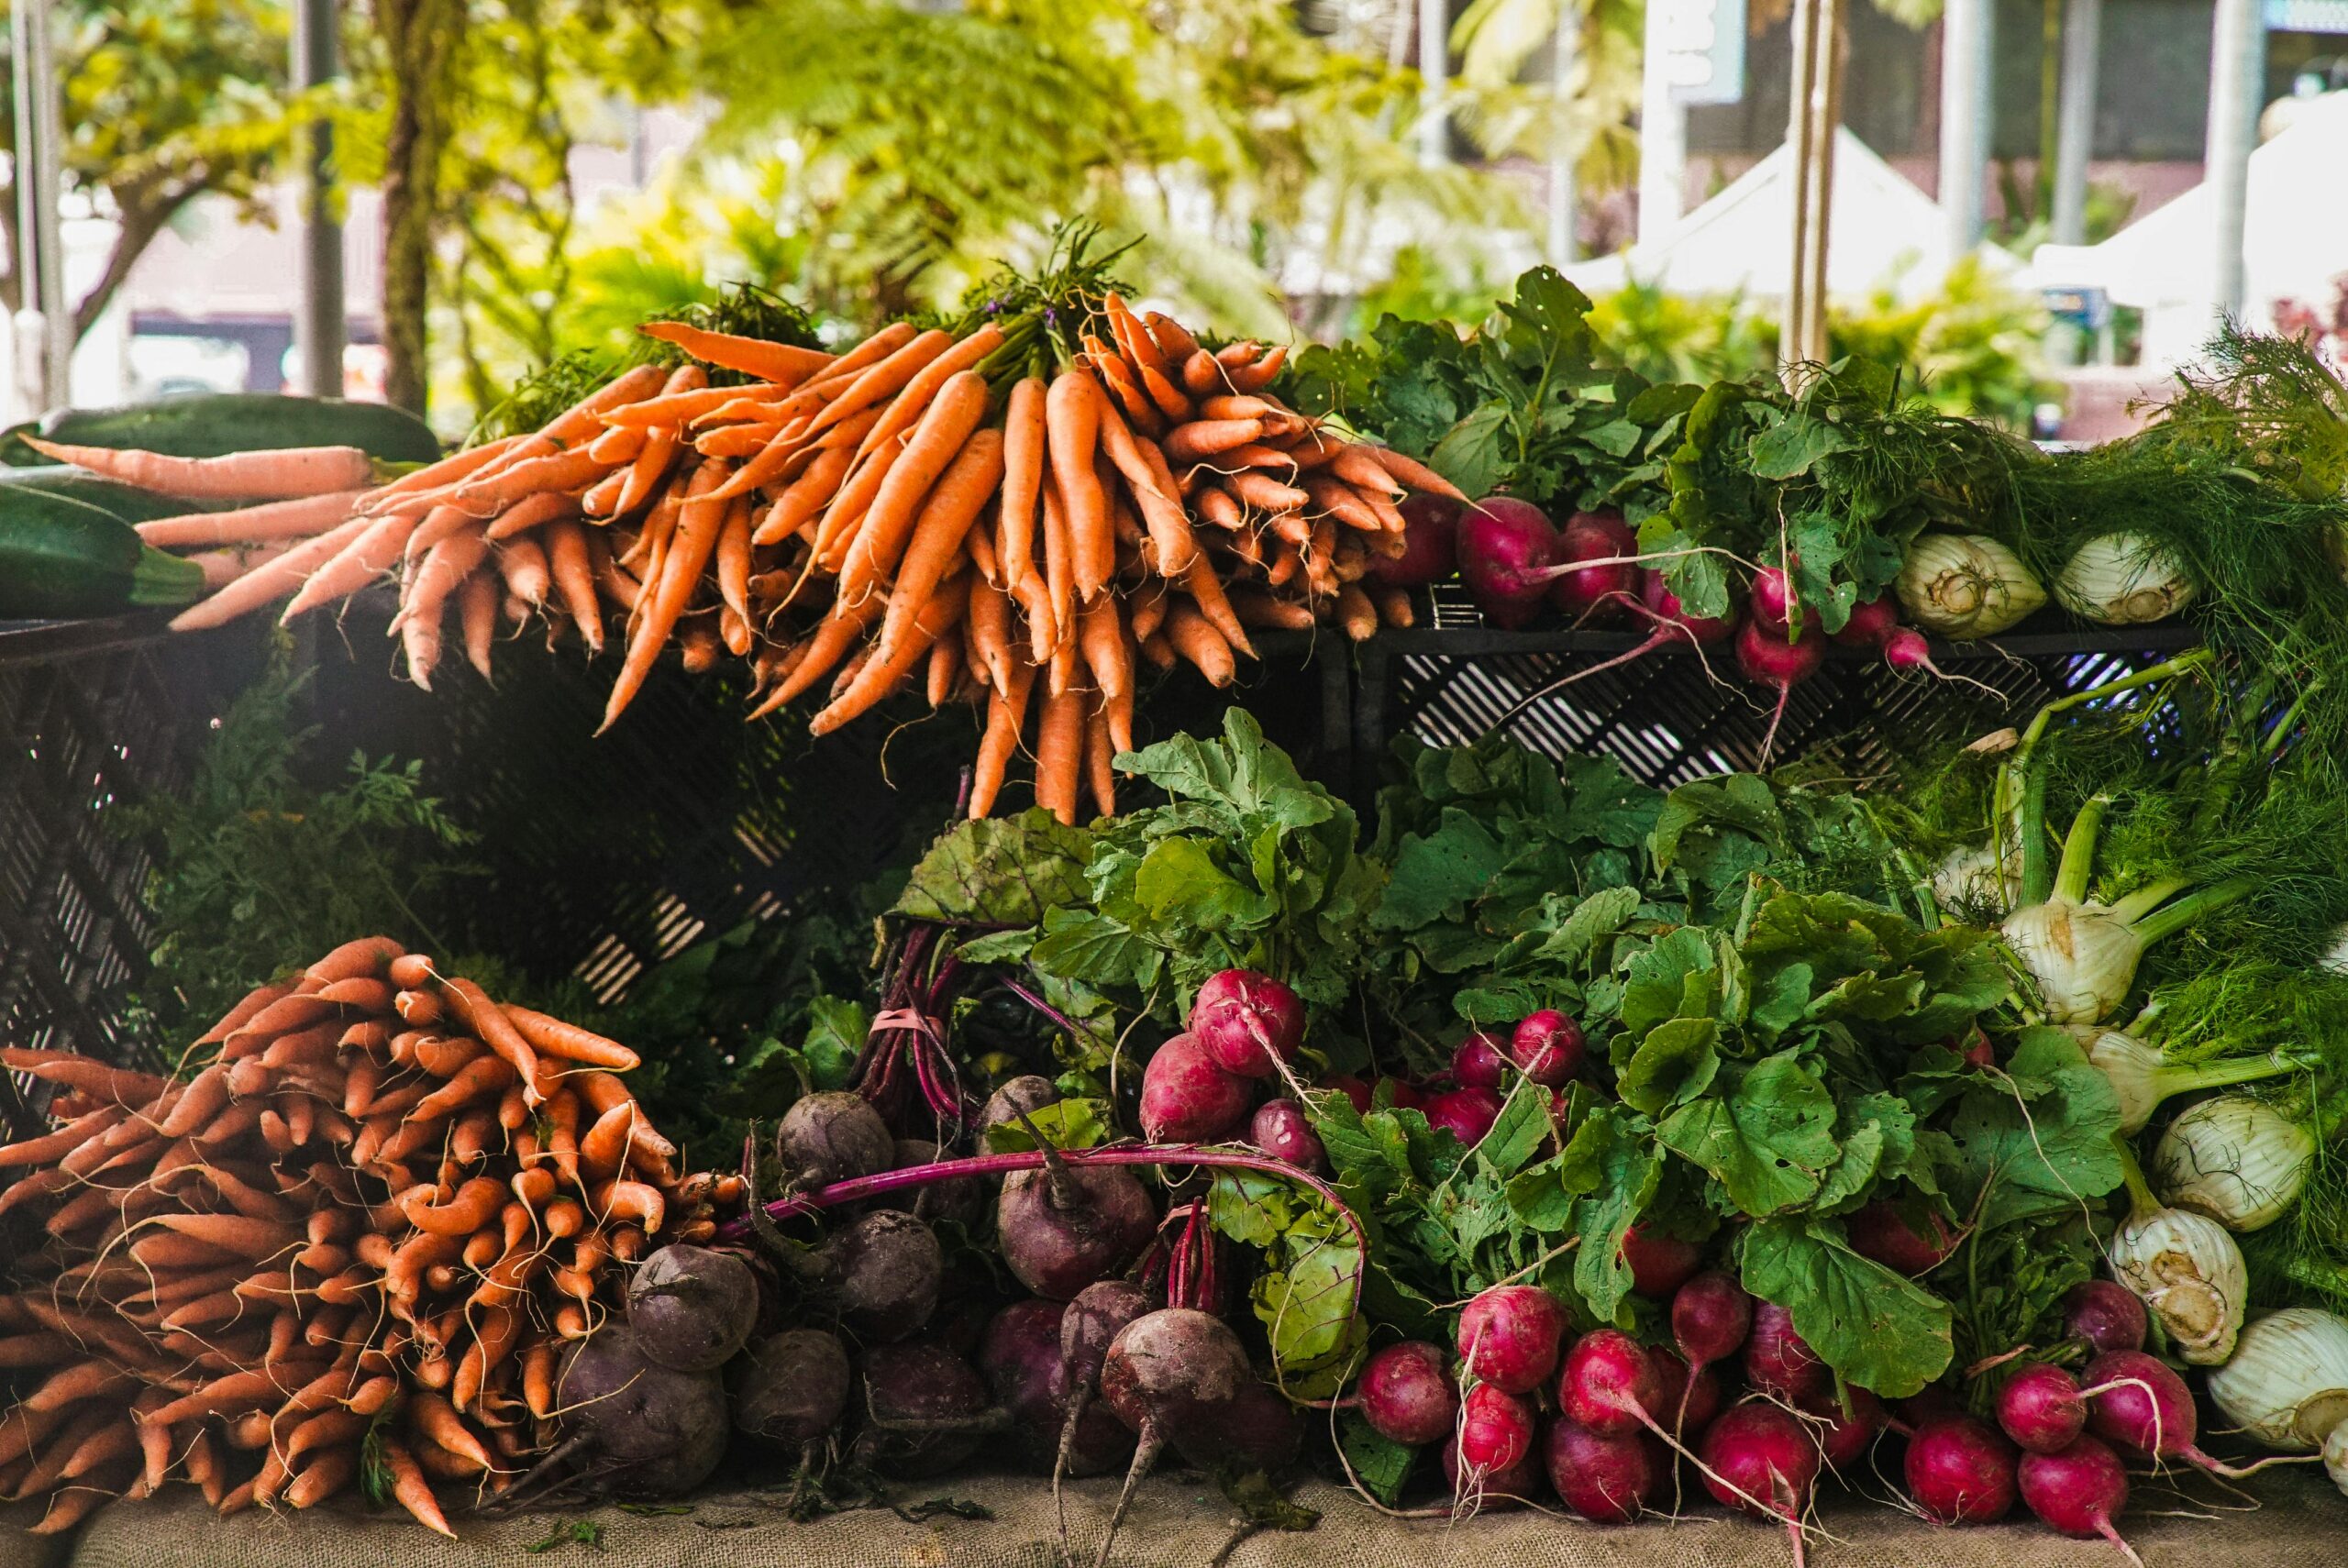
By contrast, traditional CSAs occupy the opposite end of the spectrum. Customers typically pick up raw ingredients and prepare meals themselves, valuing the experience of supporting their local community and using ingredients with the shortest possible food miles. While many modern CSAs have adapted by offering home delivery and more flexible subscription options, these services often still require advance commitment and less customization than convenience-focused platforms. Consequently, the rising popularity of services like Instacart, Hello Fresh, and DoorDash suggests shifting consumer preferences that pose challenges to the traditional CSA model.
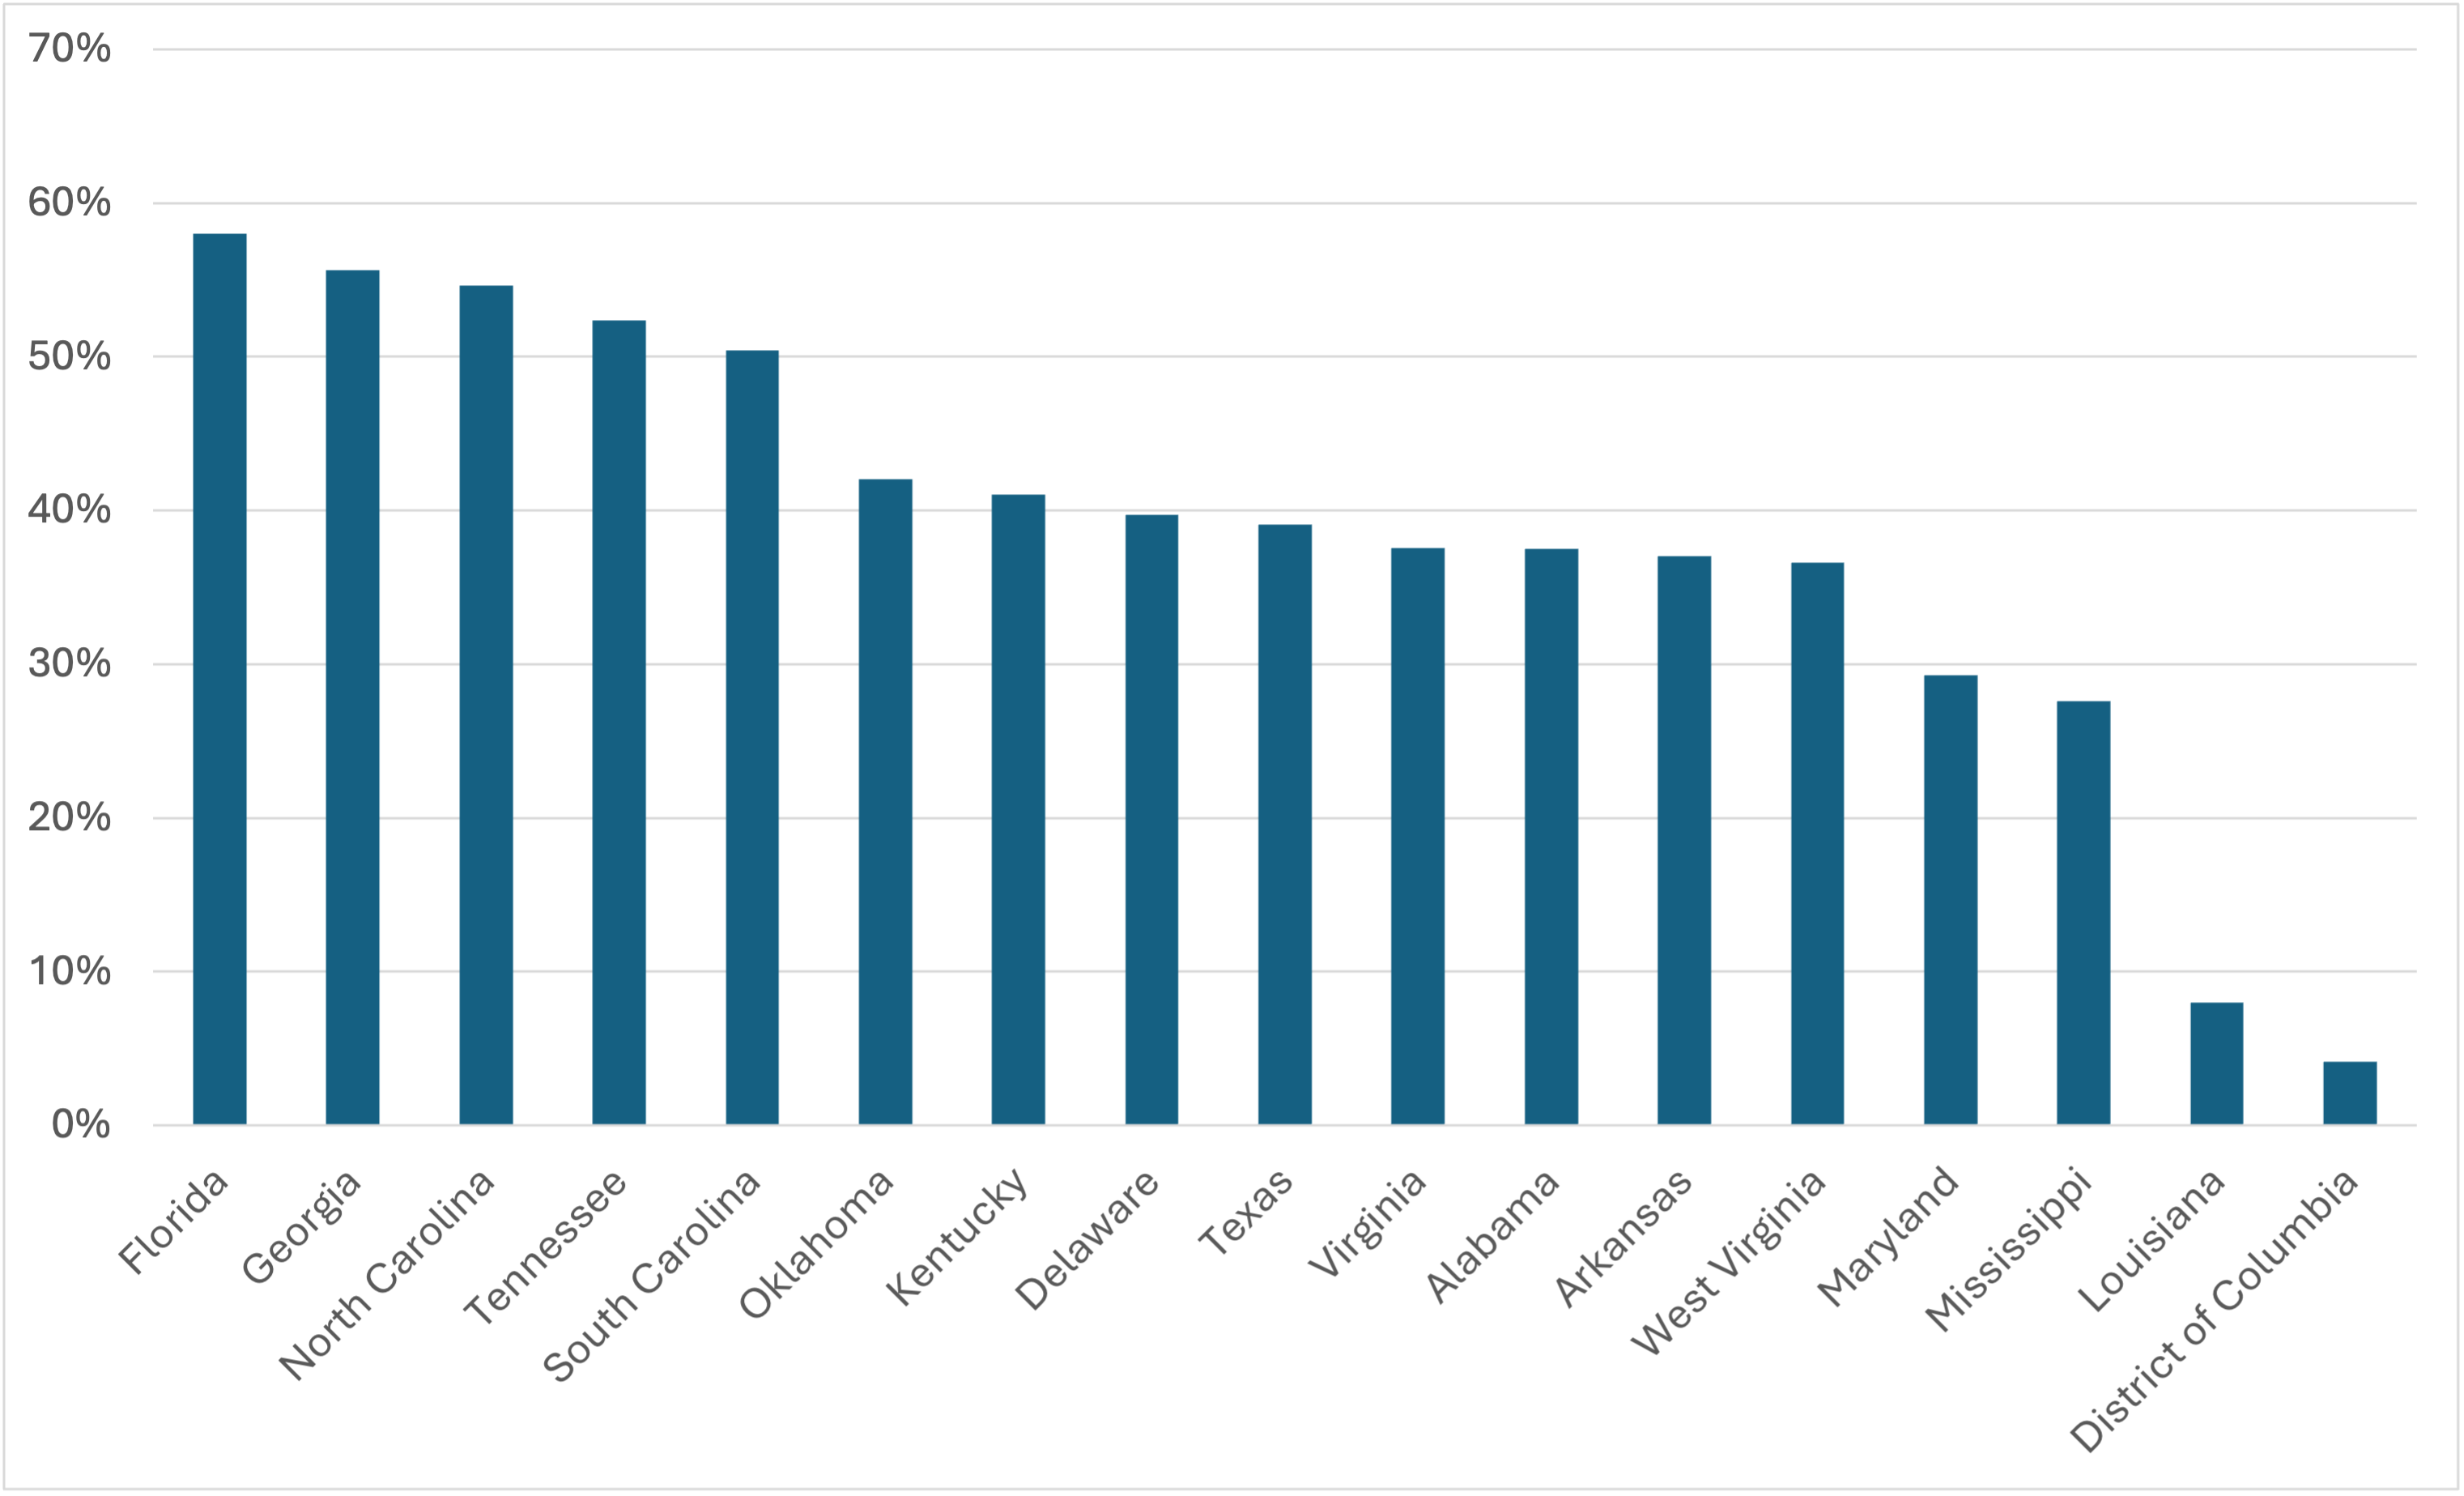
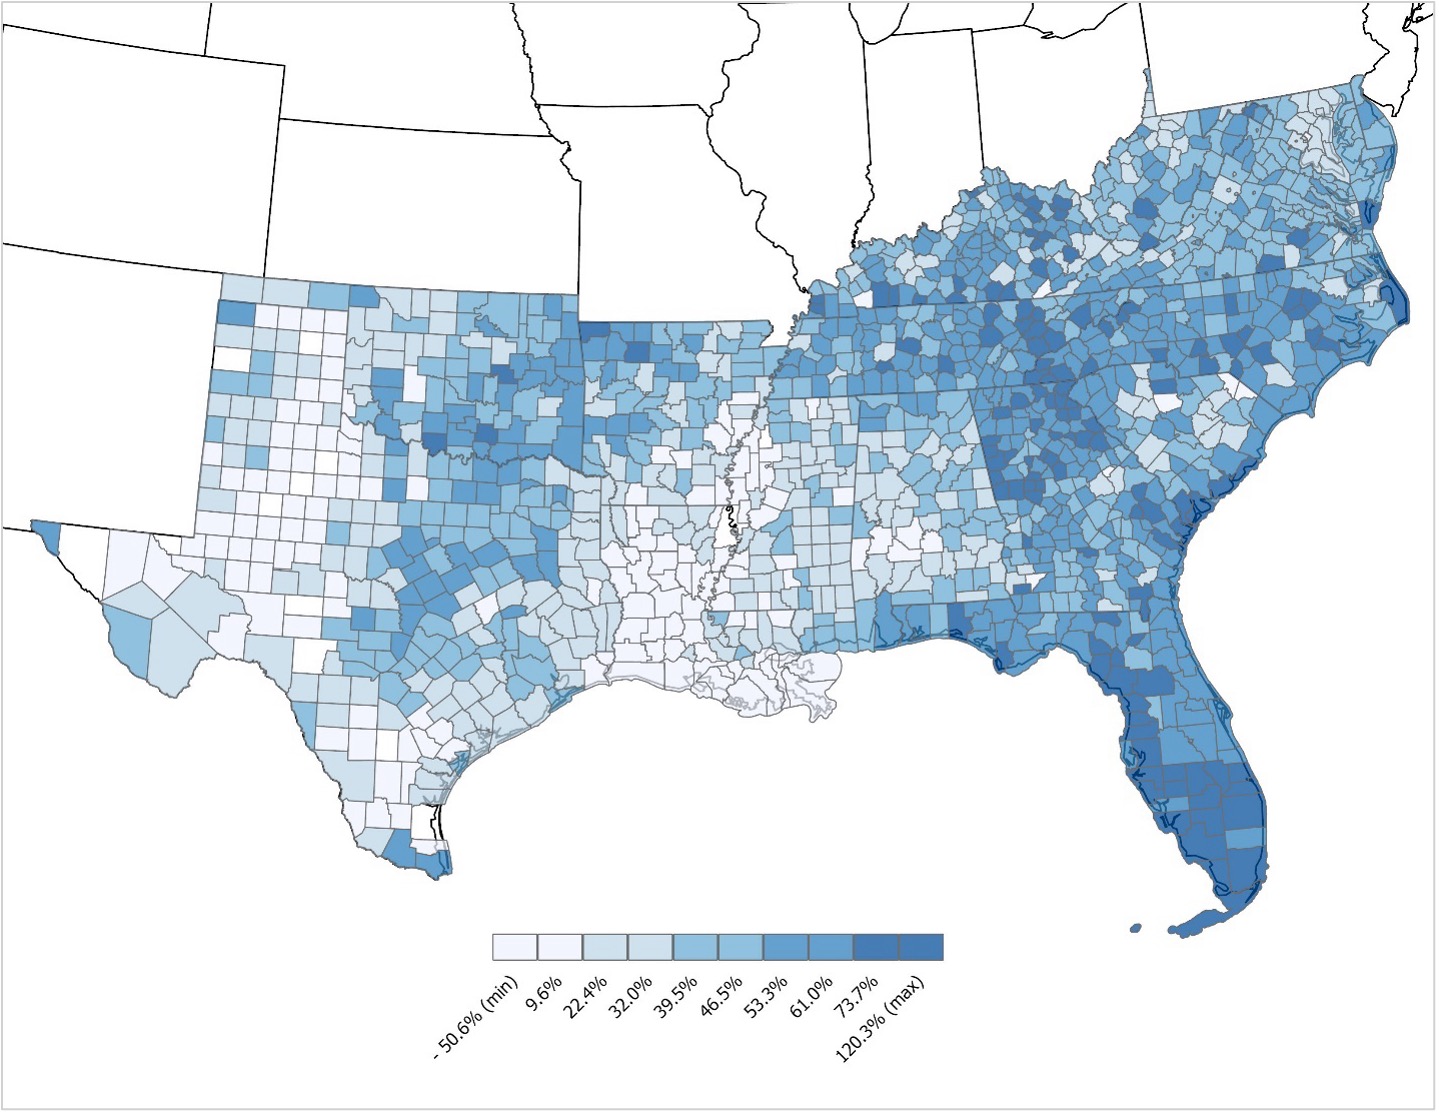
However, the increasing popularity of these services does not mean that demand for local food is shrinking; in fact, it is actually increasing (USDA, 2024). Despite these challenges, CSAs still hold unique advantages that big supermarkets and large food delivery services simply cannot replace: unparalleled freshness due to extremely short food miles and the value of community support with community engagement. Then, what obstacles keep micro-local farmers from sustaining these unique values, and how might they be addressed?
Many small local farmers say their biggest challenge is marketing their produce, yet they often show little interest in joining cooperatives that could help address this issue. This hesitation often comes from concerns about losing independence, mistrust, or simply a lack of awareness about the benefits. While running an independent business may seem more appealing, joining a cooperative does not mean giving up ownership, as cooperatives operate like owners’ clubs. By joining cooperatives, micro-farmers can focus on growing food instead of handling marketing, distribution, and sales alone. Along with gaining stronger bargaining power, cooperatives also help farmers save money by sharing resources, reaching larger markets, learning from each other, and building stronger brands. Working together can make it easier for farmers to stay profitable and succeed in today’s ever-changing food market.
Policy and community support also play a crucial role in creating an environment where cooperatives can thrive and better serve local farmers. Many local organizations, including cooperative extensions, NGOs, and government programs, focus on providing training and technical assistance to new local farmers. While these efforts are valuable, concentrating solely on education without also developing reliable and easily accessible markets limits their effectiveness. To be more effective, policies and community initiatives should prioritize strengthening local cooperatives and developing both offline and online markets with low or no entry barriers for newcomers (Seo, 2024), using cooperatives as a central hub.
Lastly, instead of seeing convenience services only as competitors, farmers might find opportunities to collaborate or integrate with them. For example, CSAs might use delivery platforms to expand their reach while maintaining their core values. Exploring these kinds of innovations could help traditional CSAs adapt to changing consumer preferences without losing their unique strengths.
References
Kaczmarski, M. (2024, April). Which company is winning the restaurant food delivery war? Bloomberg Second Measure. https://secondmeasure.com/datapoints/food-delivery-services-grubhub-uber-eats-doordash-postmates/
Restrepo, B. J., & Zeballos, E. (2024, February). New survey data show online grocery shopping prevalence and frequency in the United States. USDA ERS. https://www.ers.usda.gov/amber-waves/2024/february/new-survey-data-show-online-grocery-shopping-prevalence-and-frequency-in-the-united-states
Seo, F. (2024, July). Is the current CSA model sustainable? A lesson from Korea. Southern Ag Today. https://southernagtoday.org/2024/07/05/is-the-current-csa-model-sustainable-a-lesson-from-korea/
Statista. (n.d.). Meal kit delivery – United States. Statista Market Insights. Retrieved August 1, 2025, https://www.statista.com/outlook/emo/online-food-delivery/grocery-delivery/meal-kit-delivery/united-states
U.S. Department of Agriculture, Economic Research Service. (2024, March). Agricultural Census shows strong growth in direct sales from farms and ranches. Charts of Note. https://www.ers.usda.gov/data-products/charts-of-note/chart-detail?chartId=108821
Seo, Frank. “Instacart, Hello Fresh, DoorDash, and CSA.” Southern Ag Today 5(34.5). August 22, 2025. Permalink