Author: Grant Gardner

  • Does a Big Pro Farmer Crop Tour Gap Mean a Big WASDE Yield Change?

    Does a Big Pro Farmer Crop Tour Gap Mean a Big WASDE Yield Change?

    Recent bullishness in corn and soybean futures has been driven by a tightening balance sheet in both crops. Demand has expanded, and weather in key growing areas has trimmed supply. That weather is now showing up in the USDA crop condition ratings (USDA-NASS, 2026), and the Pro Farmer Crop Tour came in well below USDA on corn (Pro Farmer, 2026), which has set off a good deal of online debate about yield estimation.

    August is the first WASDE of the year in which USDA revises yields using survey data rather than trend, and it is where the largest yield revisions of the season cluster (Gardner, 2026). Those revisions do not stop in August: since 2010, the final corn yield has differed from the August estimate by an average of 3.8 bushels, landing below it in 11 of 16 years, and soybeans have differed by 1.5 bushels. In the August WASDE (USDA-WAOB, 2026), USDA cut corn yield expectations by 2.3 bushels to 180.7 bushels per acre and soybean yields by 0.3 bushels to 52.7 bushels per acre.

    Meanwhile, the Pro Farmer Crop Tour, which samples fields across Ohio, Indiana, Illinois, Iowa, Minnesota, Nebraska, and South Dakota, estimated corn at 173.2 bushels per acre and soybeans at 53.3 bushels per acre. That puts the Tour 7.5 bushels under USDA on corn and 0.6 bushels over USDA on soybeans. Those seven states account for roughly two-thirds of U.S. corn and soybean production, and the Tour does not sample the rest, so the national figure carries an editorial judgment for the remaining third of the crop.

    While the online discussion has focused on the size of that corn gap, the historical record suggests it means less than it appears. Figure 1 shows the average difference between the Pro Farmer Crop Tour estimate and four USDA yield numbers from 2016 through 2025: the August, September, and October WASDE, and the final yield. On corn, the Tour sits below all four, and the gap narrows at every step, from 3.5 bushels against the August number to 2.3 bushels against the final. USDA moves toward the Tour as the season progresses, but never all the way. On soybeans, the same progression appears at a far smaller scale, running from 0.1 bushels below the August number to 0.4 bushels above the final.

    Figure 2 shows how far apart the two yield estimates sit as the season progresses. Crop years from 2016 through 2025 are split into two groups based on how far the Pro Farmer estimate landed from the August WASDE. Blue marks the years the two started close together, red the years they started far apart. The pattern is the same in both crops. Wherever the two estimates start, they end up in a similar place by October. On corn, the gap narrows from 5.2 bushels to 2.8 in the years that started far apart, while the years that started close widen from 2.0 to 2.8. The two groups land on the same number. On soybeans, they go further and trade places entirely, with the wide years closing from 1.6 to 0.6 and the close years opening from 0.6 to 1.4.

    The practical point is that the size of the August disagreement does not tell you much about what follows. A loud year and a quiet year arrive at about the same distance by October. That is worth keeping in mind this fall, because the 7.5 bushel corn gap between the Tour and the August WASDE is the widest in this sample, and the history here does not support reading that width as a forecast of how far USDA has to move.

    The Crop Tour is better read as direction than level. It has come in below the August WASDE on corn in nine of the last ten years by an average of 3.5 bushels, so this year’s 7.5 bushel gap is closer to four bushels of real news, and USDA’s own August number has been the more accurate of the two against the final. On soybeans, there is no yield story at all, since the Tour landed slightly above USDA. The September Crop Production report is the first chance for USDA to move with new survey data behind it. Producers pricing into this rally should know that part of it rests on an estimate history says overstates the corn shortfall.

    Figure 1. Average Pro Farmer Crop Tour August yield estimate minus the USDA yield, 2016 through 2025, measured against the August, September, and October WASDE and the final yield. Negative values indicate the Crop Tour was lower. The October average excludes the 2025 crop year, when the Crop Production and WASDE reports were canceled during the federal government shutdown.

    Source: Pro Farmer; USDA WASDE archive (ESMIS) and USDA NASS.

    Figure 2. Average absolute difference between USDA’s in-season yield estimate and the Pro Farmer Crop Tour’s August estimate, with crop years split at the median August difference. Complete August, September, and October years only, nine per crop.

    Source: Pro Farmer; USDA WASDE archive (ESMIS) and USDA NASS.

    References

    Gardner, Grant. “July 2026 WASDE: Acreage Moves in July, Yields Move in August.” Southern Ag Today, July 15, 2026. https://southernagtoday.org/2026/07/15/july-2026-wasde-acreage-moves-in-july-yields-move-in-august/

    Pro Farmer. “2026 Pro Farmer Crop Tour.” Pro Farmer, August 22, 2026. https://www.profarmer.com/pro-farmer-crop-tour

    U.S. Department of Agriculture, National Agricultural Statistics Service (USDA-NASS). “Crop Progress.” August 24, 2026. https://esmis.nal.usda.gov/publication/crop-progress

    U.S. Department of Agriculture, World Agricultural Outlook Board (USDA-WAOB). “World Agricultural Supply and Demand Estimates.” August 12, 2026. https://esmis.nal.usda.gov/publication/world-agricultural-supply-and-demand-estimates


    Recommended citation format: Gardner, Grant. “Does a Big Pro Farmer Crop Tour Gap Mean a Big WASDE Yield Change?” Southern Ag Today 6(36.3). September 2, 2026. Permalink
  • July 2026 WASDE: Acreage Moves in July, Yields Move in August

    July 2026 WASDE: Acreage Moves in July, Yields Move in August

    The July World Agricultural Supply and Demand Estimates (WASDE) report has a reputation as a quiet one for most crops. The reason is timing: USDA releases the Acreage report at the end of June (Rabinowitz, 2026), and the World Agricultural Outlook Board folds those acreage numbers into the July WASDE while leaving yield projections untouched until the August surveys begin. Wheat is the exception, receiving its largest yield revision of the year in July. Because the acreage numbers are already public, prices tend to move when the Acreage report is released, not when the WASDE repeats it two weeks later.

    Figure 1 shows the average absolute revision to acreage and yield in each monthly WASDE from the 2010/11 marketing year through the most recent report. The pattern is clear: the largest acreage revisions cluster in July with small changes to yield estimates when the Acreage report enters the balance sheet, and the largest yield revisions arrive in August with the first survey-based estimates.    

    On the supply side, the July 2026 WASDE mostly followed the script. Acreage changed for soybeans (+0.8%), wheat (-2.5%), cotton (+2.2%), and rice (-12.9%), while corn acreage was left unchanged. Yield revisions were modest: wheat (+1.9%), cotton (+0.7%), and rice (+0.2%), with corn and soybean yields held at trend. Adding in beginning stocks and imports, total corn supply fell 120 million bushels (-0.7%), soybean supply rose 30 million bushels (+0.6%), wheat supply fell 22 million bushels (-0.8%), cotton supply rose 0.4 million bales (+2.3%), and rice supply fell 20.9 million cwt (-7.6%).

    On the demand side, corn and soybean total use increased 50 million bushels (+0.3%) and 30 million bushels (+0.7%), both on stronger exports. Rice was the opposite: USDA cut total use 9 million cwt (-3.9%), mostly domestic, to absorb part of the smaller crop.

    The net result shows up in ending stocks. Carryout fell 8.7% for corn (moderately bullish), 3.0% for wheat (mildly bullish), and 27.8% for rice (strongly bullish), while cotton carryout rose 10.8% (bearish) and soybean carryout was unchanged (neutral).

    The quiet reputation of the July WASDE is really a statement about yields, not about the balance sheet. The report rarely delivers new information because the June 30 Acreage and Grain Stocks reports have already done the talking, but as this month shows, what they say can be substantial. Rice supplies tightened dramatically, corn carryout fell on stronger old-crop use, and cotton stocks built with no offsetting demand. For Southern producers, the July report is less a market event than a scorecard of how the June Acreage and Grain Stocks reports reshaped the year ahead. The real test arrives in August, when USDA replaces trend yields with its first survey-based estimates and the largest revisions of the season historically follow. With corn and soybean yields still penciled in at trend, August, not July, is the report with the most room to surprise.


    Recommended citation format: Gardner, Grant. “July 2026 WASDE: Acreage Moves in July, Yields Move in August.” Southern Ag Today 6(29.3). July 15, 2026. Permalink

  • Price Seasonality: What the Pattern Shows

    Price Seasonality: What the Pattern Shows

    Commodity prices are influenced by a wide range of factors, but seasonal patterns remain an important consideration for crop marketing decisions. Even in periods of heightened volatility, understanding how prices tend to behave at different points in the marketing year can help producers evaluate timing risk and opportunity. Using soybeans as an example, this article examines historical price seasonality to illustrate how these recurring patterns can inform marketing strategies.

    Seasonality reflects the tendency for prices to follow recurring patterns throughout the marketing year, largely driven by changes in supply availability. Across crops, prices are often weakest near harvest, when supplies are most abundant, and strengthen later in the year as stocks are drawn down. While this pattern is widely understood, it is not universal. In some years, crop prices are stronger at harvest than during the remainder of the marketing year; however, these “harvest-strong” years are relatively rare and tend to behave differently than the typical seasonal pattern.

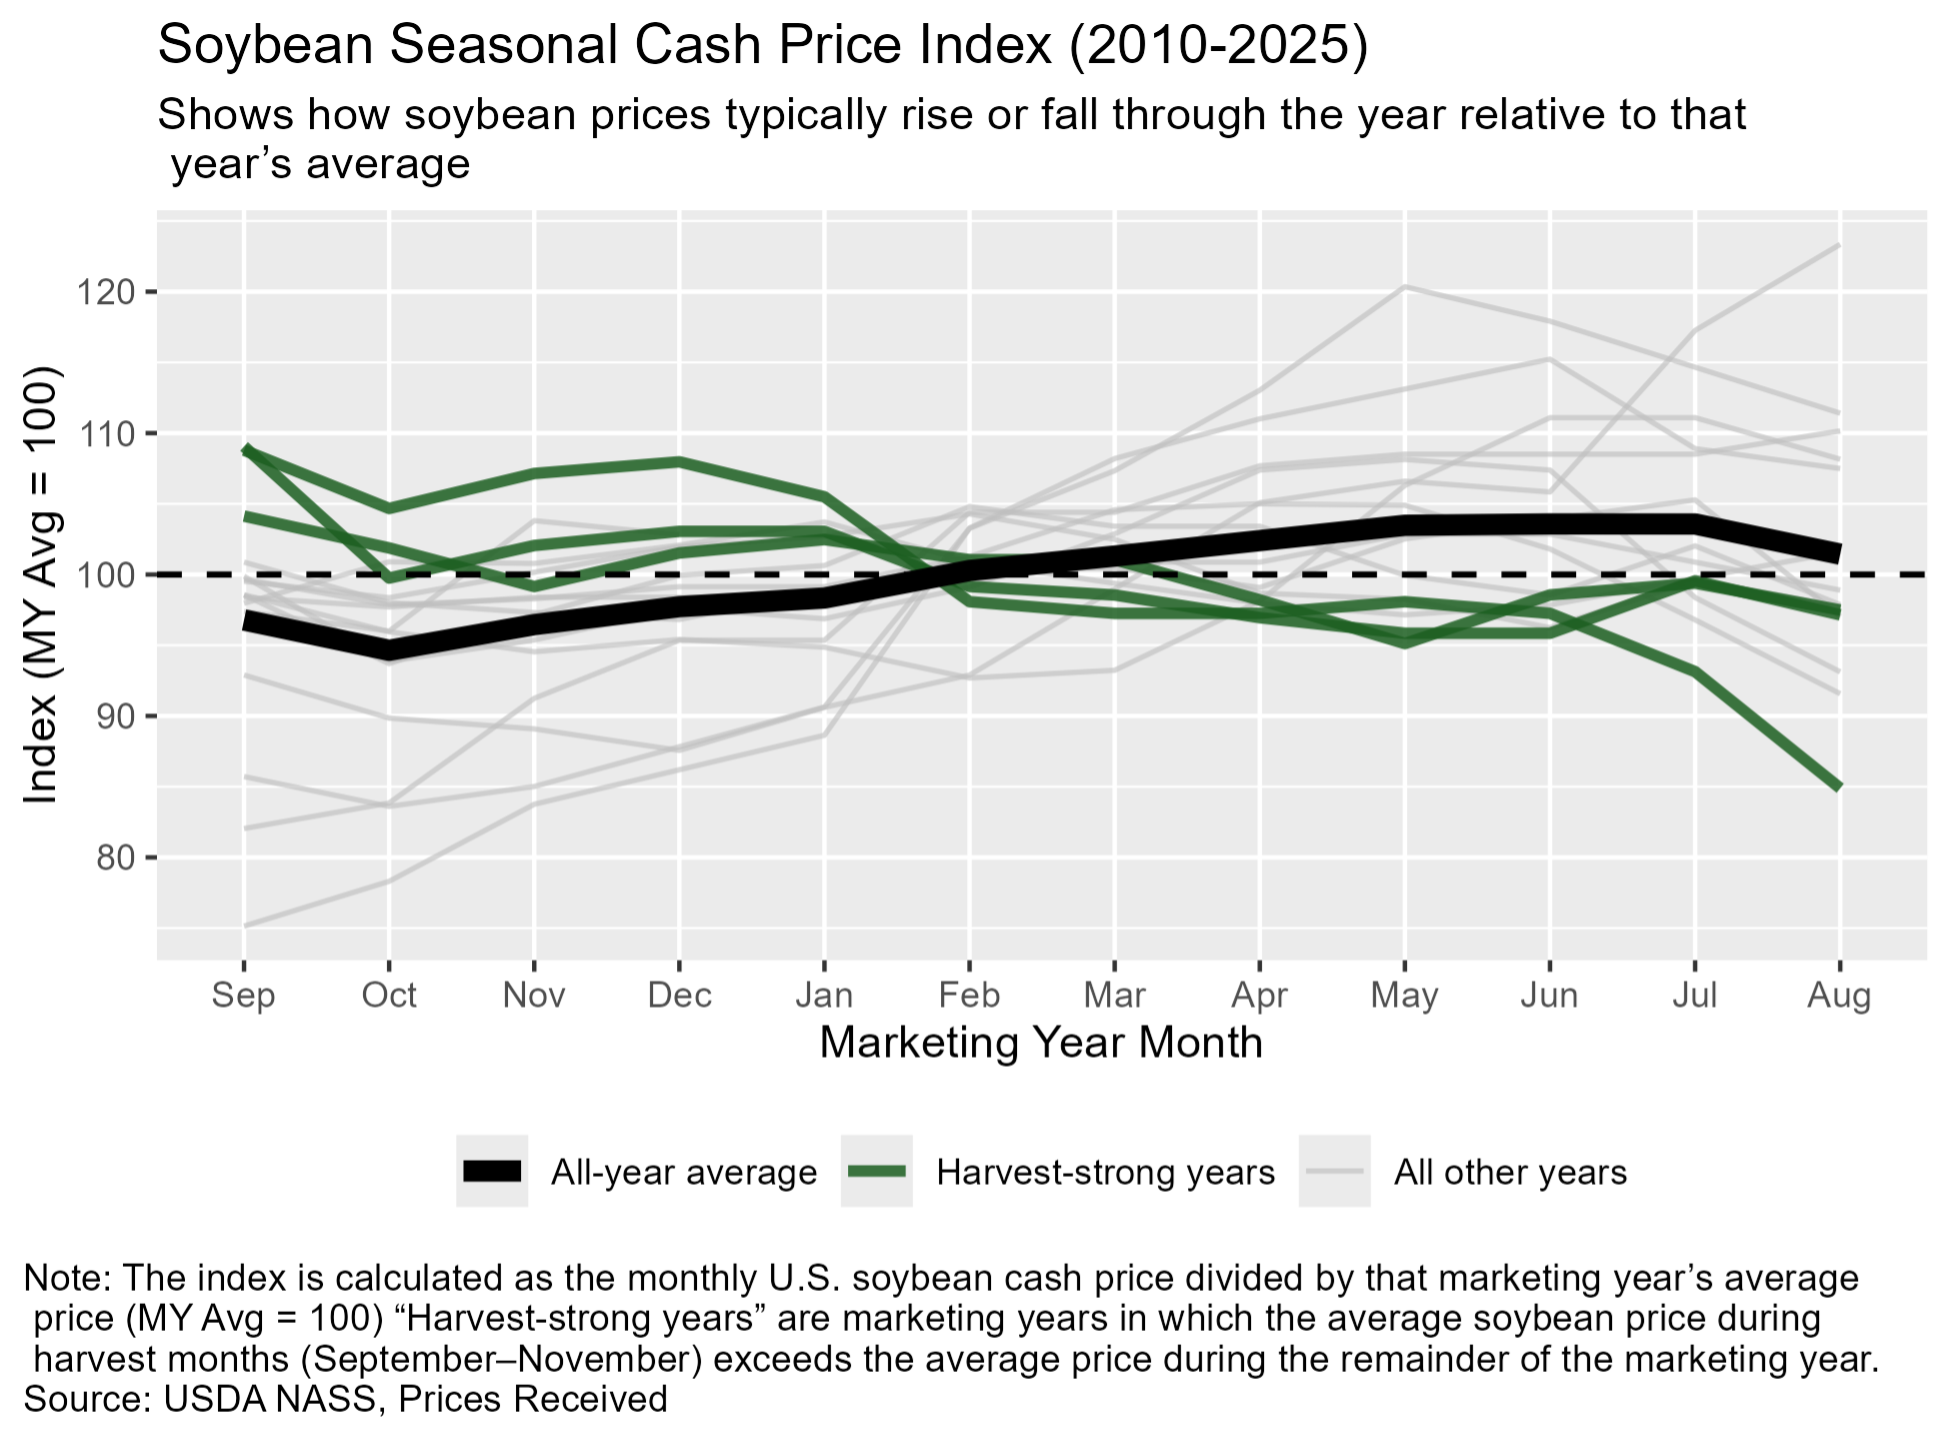
    Figure 1 illustrates soybean cash price seasonality using national monthly prices from 2010–2025. Prices are expressed as an index, calculated by dividing each month’s price by that marketing year’s average price. A value of 100 represents the average price for the year, while values above (below) 100 indicate prices that were higher (lower) than average.

    The thick black line in Figure 1 shows the average seasonal pattern across all years. This long-run average confirms a familiar story: soybean prices tend to be relatively weaker in the early fall, strengthen through winter and spring, and often peak in late spring or early summer before declining as new-crop supplies approach. From a seasonal perspective, this pattern suggests that pre-harvest and late-spring marketing opportunities often outperform harvest-time sales.

    Not all years follow this average path. The green lines in Figure 1 highlight harvest-strong years—marketing years in which average soybean prices during harvest (September–November) were higher than prices during the remainder of the marketing year. The lighter gray lines represent all other years. Over the past 15 years, soybean prices were higher at harvest in only three years: 2015, 2019, and 2024. In 2015, harvest prices were supported by weather risk and relatively tight global balance sheets. In 2019, prices were influenced by trade uncertainty and a delayed supply response. Most recently, in 2024, tight stocks and global supply concerns helped support prices at harvest. In contrast, the remaining years exhibit stronger pricing opportunities outside the harvest window.

    This distinction has practical marketing implications. In most years, weak harvest prices are followed by some degree of seasonal recovery, making post-harvest marketing opportunities more attractive. When prices are unusually strong at harvest, however, the historical record suggests that price upside later in the marketing year may be more limited.

    The key takeaway is not that producers should market at the same time every year, but that seasonality provides a useful baseline expectation. When prices align with typical seasonal patterns, historical averages can help frame marketing decisions. When prices deviate, particularly when harvest prices are strong, it may signal that capturing favorable prices sooner deserves consideration. Incorporating seasonal patterns alongside market fundamentals, risk tolerance, and cash-flow needs can help producers make more disciplined and informed soybean marketing decisions.

    Figure 1.


    Gardner, Grant. “Price Seasonality: What the Pattern Shows.” Southern Ag Today 6(6.3). February 4, 2026. Permalink

  • Soybeans Stage a Comeback: Chinese Demand and Biofuel Growth Lead the Way

    Soybeans Stage a Comeback: Chinese Demand and Biofuel Growth Lead the Way

    Following strong prices in 2022 and 2023, soybean values have fallen sharply from highs above $14 per bushel to current levels near $10.00 across much of the United States. While prices have recently rebounded on news of renewed Chinese buying, soybeans are still projected to generate negative returns during the 2025/26 marketing year. Looking ahead to 2026/27, November 2026 soybean futures are trading near $11.10. Assuming a -$0.50 harvest basis, a trend yield of 55 bushels per acre, and $650 per acre in input costs, estimated returns still imply roughly a $67 per-acre loss.

    While it is still early and profitable prices could emerge, the signal remains clear: soybean supply continues to outpace demand at current production levels, and without stronger and sustained demand growth, profitability will remain elusive.

    Between 2019 and 2022, U.S. soybeans were split roughly between exports (44%) and domestic crush (47%), with the remainder going to seed, feed, residual use, or ending stocks (Oilseed Yearbook, 2025). Recently, crush expansion has boosted domestic demand, but exports have declined, particularly due to reduced Chinese purchases (Gerlt, 2025). The U.S. recently negotiated a trade agreement under which China will purchase 12 million metric tons (MMT) of U.S. soybeans by January 2026, followed by 25 MMT annually from 2027 through 2029. This level would return Chinese buying close to 2024/25 volumes (Clayton, 2025). While the agreement provides some near-term support, questions remain about fulfillment and what happens beyond 2029.

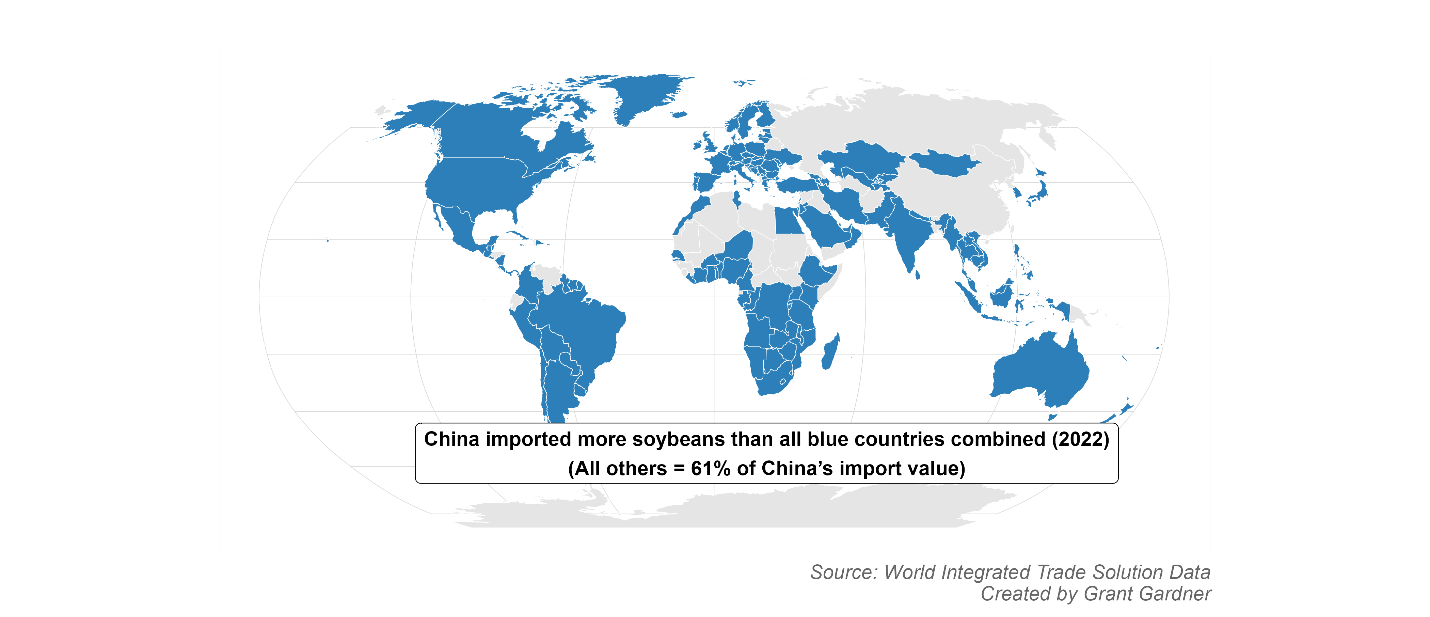
    In the near term, renewed Chinese buying represents the most direct path back to profitability. Crush expansion is important but largely anticipated by markets and will ramp up gradually; it cannot immediately offset recent export weakness. Meanwhile, China remains by far the dominant global buyer: in 2022, China imported more soybeans than all other countries combined, with the rest of the world accounting for just 61% of China’s import value (Figure 1). Over the long run, diversifying export markets can reduce reliance on China and lower price risk, but fully replacing Chinese demand is unrealistic.

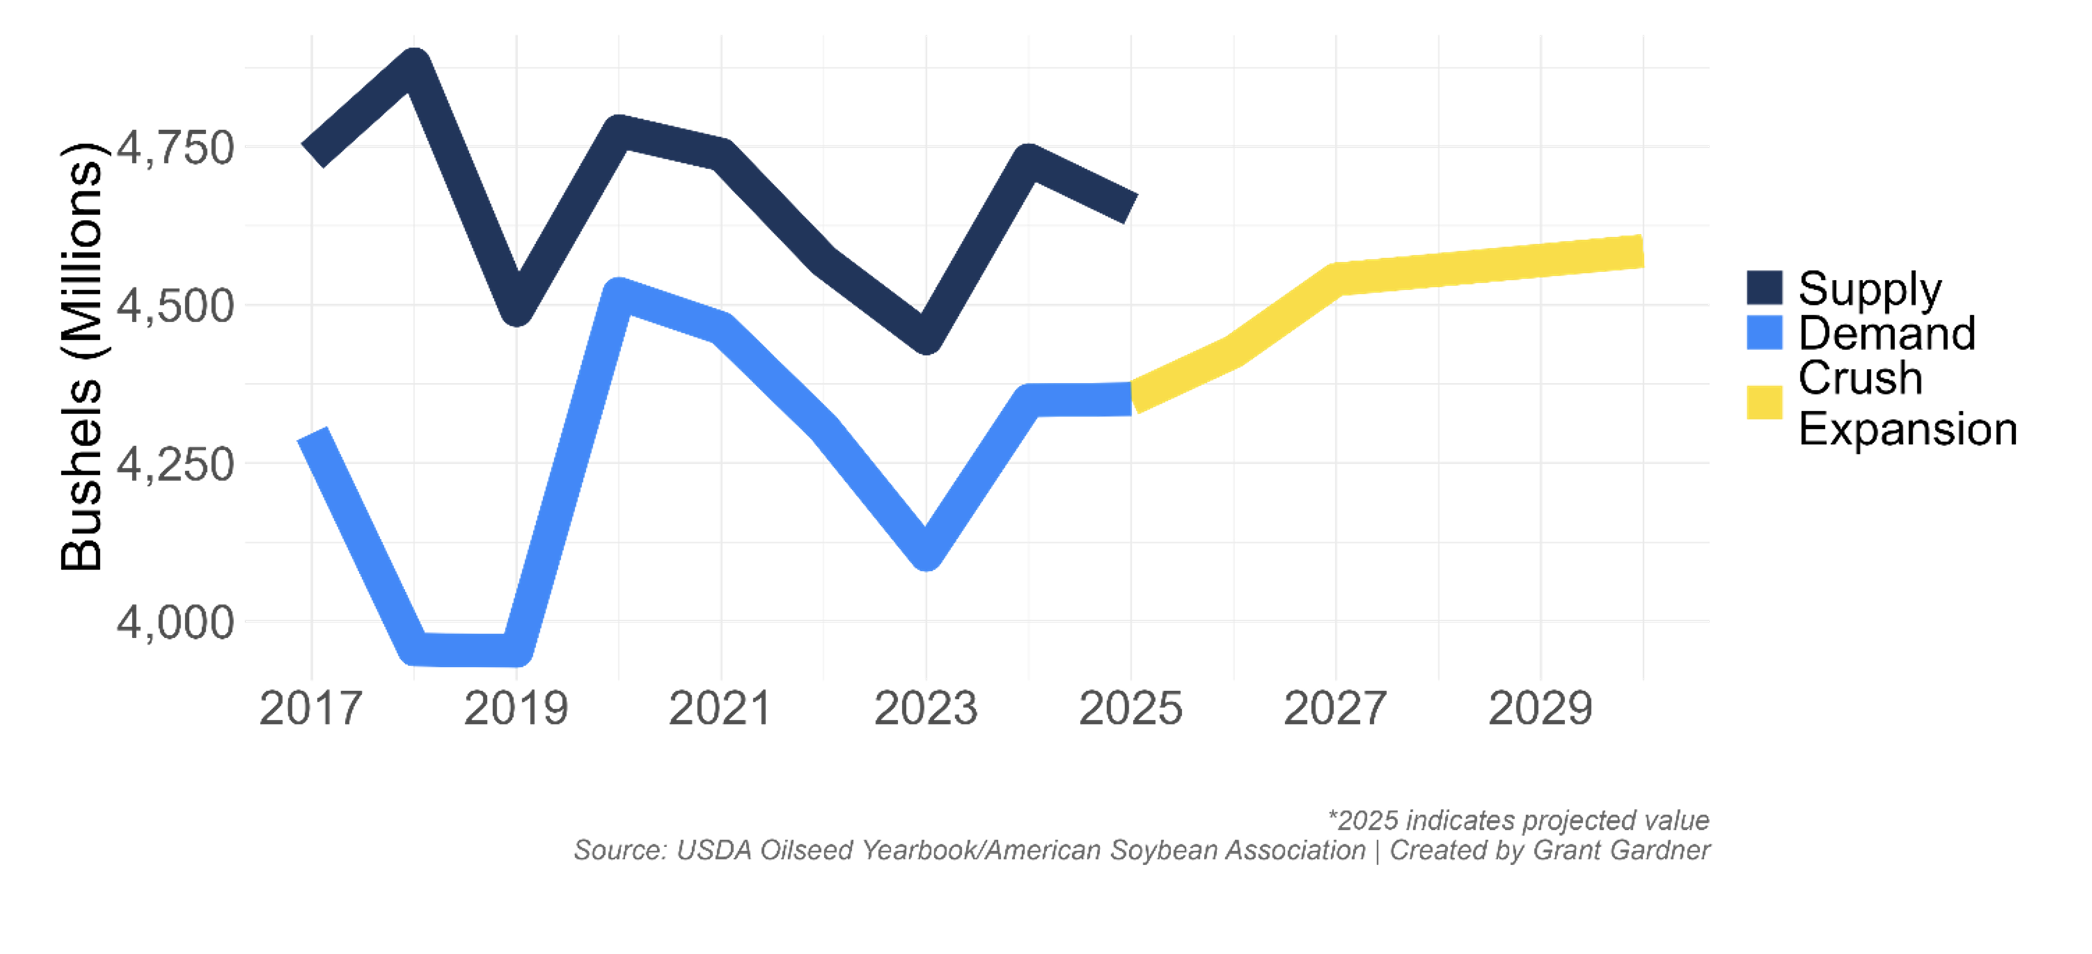
    Longer-term, continued crush growth provides a pathway to tighter balance sheets. Figure 2 illustrates how expanded crush capacity could increase domestic use even if Chinese purchases do not return to prior highs. Projected crush use climbs steadily after 2025 (Gerlt, 2025), supported by renewable diesel and other biofuel investments that may anchor domestic soybean demand going forward. If exports can stabilize near current projections, or strengthen modestly, the combination of incremental trade growth and rising domestic crush could gradually restore profitability. The recent trade agreement may buy time, but building durable demand outside of China will be essential to a more resilient soybean market beyond 2029.

    Figure 1: World Demand for Soybeans Outside of China, 2022

    Figure 2: Soybean Supply, Demand, and Projected Crush Expansion

    Citations: 

    Clayton, Chris. “Trump Champions Soy Deal for Farmers.” Progressive Farmer. October 30, 2025. https://www.dtnpf.com/agriculture/web/ag/news/article/2025/10/30/bessent-china-agrees-buy-nearly-1-us

    Gardner, Grant. “Major Players in US Trade and Grain Market Volatility.” Southern Ag Today 5(15.3). April 9, 2025. Permalink

    Gerlt, Scott. (2025, April 10). Soybean Crush Expansion, 2025 Update. American Soybean Association. Retrieved from https://soygrowers.com/news-releases/soybean-crush-expansion-2025-update/

    U.S. Department of Agriculture, Economic Research Service. (2025). Oil Crops Yearbook [Data set]. U.S. Department of Agriculture.

    World Bank (n.d.). World Integrated Trade Solution (WITS) [Data set]. Accessed via WITS: https://wits.worldbank.org/


    Gardner, Grant. “Soybeans Stage a Comeback: Chinese Demand and Biofuel Growth Lead the Way.” Southern Ag Today 5(45.3). November 5, 2025. Permalink

  • Potential Market Impacts of Missing a WASDE Report During Government Shutdowns

    Potential Market Impacts of Missing a WASDE Report During Government Shutdowns

    The USDA’s World Agricultural Supply and Demand Estimates (WASDE) report is one of the most influential monthly publications in agriculture. It summarizes and updates projections on global crop production, trade, and consumption—information that agricultural markets rely on to set prices. However, the October WASDE report will not be released due to the ongoing government shutdown. Without this update, the effects ripple across the supply chain, impacting farmers, merchandisers, and financial markets that depend on timely market intelligence to guide decisions.

    Previous government shutdowns have interrupted the release of WASDE reports, and research has shown this has introduced heightened uncertainty into the markets during the short term (Adjemian et al. 2017; Goyal and Adjemian, 2021). Without the monthly WASDE, buyers and sellers lose a crucial reference point on where the market stands. While we can only speculate about what the October report would have shown, its absence means missed opportunities. The numbers could have shifted prices positively or negatively, creating advantages for either sellers or buyers of agricultural commodities.

    The disruption is especially significant during harvest. This is the time when actual yields are measured, contracts are delivered, and elevators manage a surge of grain. Typically, the October and November WASDE reports capture updated harvest conditions, painting a near real-time picture of the national balance sheet. Without those updates, elevators are left to alternative sources of information to estimate supply levels—possibly causing basis moves that may be too high or low. Similarly, demand projections lack clarity, which can swing futures prices in either direction.

    In the short term, private forecasts will likely gain influence, but these estimates often vary widely by source, adding to market volatility. In the longer term, multiple months of projections may be bundled into a single release once USDA reporting resumes, creating larger adjustments in supply or demand estimates that markets must digest all at once.

    In sum, whether the October WASDE would have been bullish or bearish for producers would have depended largely on changes to yield estimates. But the absence of a report is significant in itself. The lack of transparent, standardized market information increases the risk of mispriced grain and market inefficiencies, leaving producers and elevators to make large-scale marketing and storage decisions under heightened uncertainty.

    References

    Adjemian, M. K., Johansson, R., McKenzie, A., & Thomsen, M. (2018). Was the missing 2013 WASDE missed?. Applied Economic Perspectives and Policy, 40(4), 653-671.

    Goyal, R., & Adjemian, M. K. (2021). The 2019 government shutdown increased uncertainty in major agricultural commodity markets. Food Policy, 102, 102064.


    Gardner, Grant. “Potential Market Impacts of Missing a WASDE Report During Government Shutdowns.” Southern Ag Today 5(42.3). October 15, 2025. Permalink