Author: Hunter Biram

  • Analyzing the Relationship Between the Yield Ratio and Optimal Crop Insurance Coverage Levels

    Analyzing the Relationship Between the Yield Ratio and Optimal Crop Insurance Coverage Levels

    Authors: Dr. Hunter D. Biram, Assistant Professor and Extension Agricultural Economist, University of Arkansas, Mr. Enil Serrano Puerto, Ph.D. Student, University of Kentucky, Dr. Grant Gardner, Assistant Extension Professor, University of Kentucky

    The Federal Crop Insurance Program (FCIP) has been a standard in farm risk management with nearly 500 million acres insured across row crops, forages, and specialty crops, resulting in up to $192 billion in insured liability in 2024, or 78% of the total value of U.S. crops (USDA-RMA and USDA-ERS, 2026). Despite its popularity as a risk management tool, the question of the best coverage level remains each year. Because premium rates are capped at annual increases of 20%, base premiums tend to change very little from year to year. However, the expected insurance price used to calculate coverage is influenced by futures market prices. As a result, insurance costs can fluctuate based on changes in commodity prices and the mix of crop acres planted by producers. This often leaves farmers with the question of how much insurance to buy or whether to renew with the same coverage from the year before. In response, a large suite of tools has been developed by university extension services. A total of 13 decision aids have been developed by universities from across the U.S., with 9 focusing on farm programs (i.e., Agriculture Risk Coverage and Price Loss Coverage) administered by the Farm Service Agency (FSA), and 4 focusing on federal crop insurance programs administered by the Risk Management Agency (RMA) (Serrano, Gardner, and Biram, Forthcoming). We add a decision aid to this suite of tools that provides analysis for both FSA farm programs and federal crop insurance programs, the Crop Insurance Decision-Maker (CIDM). The CIDM is a free, web-based decision aid that provides expected revenue net of production expenses and insurance premiums paid under scenarios with and without crop insurance. After analyzing multiple scenarios, the CIDM highlights the risk management option with the highest expected net return as a potential optimal coverage choice. The tool further provides analysis of farmer risk preferences by including data for farmers who are risk-averse and are concerned about extreme weather and pest pressure lowering expected net returns.

    In an article published in the latest edition of the Journal of the American Society of Farm Managers and Rural Appraisers (JASMFRA), Serrano, Gardner, and Biram (2026) provide an explanation for CIDM, how to interpret the results in the decision aid, how the results were generated, and where it fits in the greater suite of farmer decision aids. In most instances, results follow those of Biram et al. (2022), who show that even in the presence of ARC and PLC, the optimal decision in most cases is to choose 80-85% coverage. Biram et al. (2022) show that the base premium rate drives the coverage level, with higher base premiums resulting in increasing cost of insurance, and therefore lower optimal coverage levels. 

    We suggest here that another driver of optimal coverage is the ratio of the farm-level yield expectation, measured by the Actual Production History, to the county-level yield expectation measured by the county Reference Yield determined by RMA. Using Arkansas and Kentucky as examples, Figures 1 and 2 plot optimal coverage levels for risk-averse farmers across various yield ratio levels based on Serrano, Gardner, and Biram (2026). We first note that in all instances, except for cotton grown in one county in Arkansas, purchasing some level of crop insurance is always preferred to not purchasing any crop insurance at all (see Figures 1-2). We also find that the optimal coverage level is at least 70% or greater when the farm-level yield expectation is at least half that of the county yield expectation for Arkansas (Figure 1) or the farm yield expectation is at least 60% of the county yield expectation in Kentucky.

    Since these general results are across multiple combinations of states, counties, and coverages, we direct farmers and other users involved in the crop insurance purchase process to consult the CIDM for optimal coverage in a specific county.

    Figure 1. The Relationship Between the Yield Ratio and Optimal Coverage Level in Arkansas

    Figure 2. The Relationship Between the Yield Ratio and Optimal Coverage Level in Kentucky

    References

    Biram, H. D., Coble, K. H., Harri, A., Park, E., & Tack, J. (2022). Mitigating price and yield risk using revenue protection and agriculture risk coverage. Journal of Agricultural and Applied Economics, 54(2), 319-333.

    Serrano, E., Gardner, G., & Biram, H.D. (2026). Enhancing Crop Insurance Decisions with Data-Driven Tools. Journal of the American Society of Farm Managers and Rural Appraisers.

    United States Department of Agriculture, Economic Research Service. (Accessed 2026). Farm income and wealth statistics.

    United States Department of Agriculture, Risk Management Agency. (Accessed 2026). Revised premium ratings for corn and soybeans: Frequently asked questions.

  • The Expanding Access to Risk Protection (EARP) Rule Reduces Farmer Flexibility in Production Risk Management by Eliminating Prevented Planting Buy-up Coverage

    The Expanding Access to Risk Protection (EARP) Rule Reduces Farmer Flexibility in Production Risk Management by Eliminating Prevented Planting Buy-up Coverage

    Authors: Hunter D. Biram, University of Arkansas and Francis Tsiboe, Agricultural Risk and Policy Center at North Dakota State University

    Prevented planting insurance, a component of the Federal Crop Insurance Program (FCIP), provides compensation when adverse weather conditions prevent farmers from planting insured crops. This protection is embedded within standard crop insurance policies and is directly linked to the elected coverage level: higher coverage levels mechanically translate into higher prevented planting payments.

    Historically, farmers could purchase additional prevented planting protection through a “buy-up” option, which increased prevented planting payments without expanding exposure to other types of losses. This structure allowed early-season planting risk to be managed in a targeted manner while keeping overall FCIP risk largely confined to within-season production losses. That adjustment margin was eliminated by the U.S. Department of Agriculture’s Federal Crop Insurance Corporation (FCIC) through the Expanding Access to Risk Protection (EARP) final rule issued on November 28, 2025. Beginning with the 2027 commodity year, producers can no longer purchase prevented planting buy-up coverage. As a result, farmers seeking to maintain similar levels of prevented planting protection must instead increase their overall insurance coverage. While higher coverage can raise prevented planting payments, it also increases premiums and broadens exposure to non-prevented planting losses, limiting farmers’ ability to target planting risk alone and requiring the FCIP to assume greater risk and higher costs across the entire policy for a given producer.

    The earlier removal of the 10 percent prevented planting buy-up option in 2018 provides important context for how producers adjust when targeted prevented planting protection is no longer available. Evidence from recent analyses (Tsiboe, 2026; Biram and Tsiboe, 2026) shows that some farmers responded by gradually increasing their base coverage over time rather than making large or immediate changes, reflecting constraints related to higher premiums, program limits, and farm-specific conditions (Figure 1). When the prevented planting buy-up of 10 percent was removed, insured producers who purchased this coverage shifted out of the 75% coverage level into the 80-85% coverages levels four years after the policy change took effect (Figure 1, top panel). Those producers who had insurance but did not purchase the prevented planting buy-up of 10 percent made essentially no change (Figure 1, bottom panel). 

    One reason why the switch into higher coverage levels took place is to compensate for a lower prevented planting coverage level. For example, a rice producer faces the base prevented planting coverage level of 55% of liability (i.e., the product of the underlying coverage level and expected revenue). Buying 10% more in prevented planting coverage increases the prevented planting coverage level to 65% of liability. Assuming a rice producer purchases the 75% coverage level on their underlying coverage level, their prevented planting coverage would be 48.75% (i.e., the product of 65% and 75%). A rice producer would need to purchase 88% coverage on their underlying insurance policy to maintain their prevented planting coverage, an option that is above the highest available coverage level of 85%. This highlights the limited flexibility of risk protection for those with relatively high coverage levels on their underlying coverage.

    Figure 1: Observed Farm-Level Coverage Adjustment Following the Removal of 10 Percent Prevented Planting Buy-Up in 2018.

    Note: The horizontal axis does not represent calendar time or a balanced panel. Instead, it indexes the chronological order of observed coverage elections within each farm, normalized so that the year in which the buy-up option was removed is coded as zero. Earlier and later observations reflect the sequence of policy elections as they appear in the administrative record. The figure focuses on only the six major commodities (corn, soybeans, wheat, cotton, rice, and sorghum) by insured liabilities in the Federal Crop Insurance Program (FCIP) 
    Source: NDSU Agricultural Risk Policy Center (ARPC), using data from USDA, Risk Management Agency Summary of Business as of June 04, 2025.

    References

    Biram, H.D. and Tsiboe, F., (2026). “Analyzing the Expanding Access to Risk Protection (EARP) USDA Final Rule: Coverage Substitution and Cost Effects of Prevented Planting Buy-Up Elimination in Rice Insurance.” Fryar Price Risk Management Center of Excellence White Paper #FC-2026-002.

    Francis Tsiboe (2026). Prevented Planting After Buy-Up Elimination: Coverage Level Substitution, Producer Costs, and the Role of Enhanced Premium Subsidies Under the One Big Beautiful Bill (OBBB). ARPC White Paper 2026–01. Agricultural Risk Policy Center, North Dakota State University.


    Recommended citation format: Biram, Hunter, and Francis Tsiboe. “The Expanding Access to Risk Protection (EARP) rule reduces farmer flexibility in production risk management by eliminating prevented planting buy-up coverage.“ Southern Ag Today 6(24.4). June 11, 2026. Permalink

  • May 2026 WASDE Highlights for U.S. Supply and Demand and Implications for Price Risk Management

    May 2026 WASDE Highlights for U.S. Supply and Demand and Implications for Price Risk Management

    Authors: Hunter D. Biram and H. Scott Stiles

    The USDA’s World Agricultural Outlook Board (WAOB) released the monthly report of World Agricultural Supply and Demand Estimates (WASDE) on May 12th. That report contained the first forecasts for the 2026-27 marketing year. The following are some of the highlights of that report.

    Soybeans

    New crop, 2026 soybean production is forecast at 4.435 billion bushels, reflecting an average yield of 53 bushels and 83.7 million harvested acres. For its initial production estimates, USDA has traditionally used the March Prospective Plantings acreage estimate and the trend-yield assumption used at the February Ag Outlook Forum.  Total consumption for the 2026 crop is expected to increase 218 million bushels to 4.49 billion on record crush (2.75 billion bu.) and modest improvement in exports (1.63 billion bu.).  This places year-ending stocks at 310 million bushels, down from 340 million in the current year. The marketing year average farm price for the 2026 crop is projected at $11.40 compared to $10.40 in 2025-26.

    Corn

    The 2026-27 corn crop is projected at 16.0 billion bushels, down 6 percent from last year’s record crop on declines in both acreage and yield. Planted acres of 95.3 million acres are projected to be down 3.5 million. The yield projection of 183.0 bushels per acre is based on a weather adjusted trend assuming normal planting progress and summer growing season weather. Total corn supplies are seen declining 2 percent to 18.1 billion bushels. Total U.S. corn use for 2026/27 is forecast to fall 2 percent relative to a year ago on reductions in domestic use and exports. Food, seed, and industrial use is forecast flat at 6.955 billion bushels. Feed and residual use is projected down 100 million bushels to 6.1 billion bushels on lower production and higher prices. U.S. corn exports for 2026/27 are forecast to decline 150 million bushels from a year ago to 3.15 billion bushels. Driven by lower production, 2026-27 ending stocks are expected to decline 185 million bushels to 1.957 billion. The 2026-27 season-average farm price is projected at $4.40 per bushel, up 25 cents from $4.15 in the current marketing year.

    Cotton

    The May U.S. cotton 2026-27 projections include a smaller crop, an increase in exports, unchanged mill use and lower ending stocks compared with the 2025-26 season. New crop production is expected to be 13.3 million bales, 600,000 bales less than in 2025-26. Domestic mill use is expected to be flat year-to-year at 1.6 million. Exports are expected to increase 300,000 bales to 12.3 million bales from 12 million in 2025-26.  Ending stocks are expected to decrease to 3.9 million bales from 4.4 million in 2025-26. That is the least since 3.15 million in 2023-24 and below the 10-year average of 4.25 million bales. The forecast average price of 73 cents for the 2026-27 marketing year is up considerably compared to 63 cents for the 2025-26 crop.

    Long-Grain Rice

    U.S. long-grain production is projected at 122.5 million cwt, down 20 percent from last year on reduced acreage. This would be the smallest long-grain crop since 2011.  Total supply is forecast at 201.1 million cwt, down nearly 12 percent from last year on lower production. Total use is projected at 173.0 million cwt, down from 188 million in the current year. Total exports are projected at 50 million cwt, down 1.0 million cwt from 2025-26, on continued strong global competition and higher U.S. long-grain prices. Domestic use is forecast at 123 million cwt., down 14 million from 2025-26.  Ending stocks are projected at 28.1 million cwt, down 29 percent from last year and the lowest since 2023-24. The 2026-27 season average farm price for long-grain is projected at $12.00 per cwt, up from $10.40 in 2025-26. 

    There and Back Again

    Season-average farm prices (SAFP) for southern crops are projected to increase between 6-16% compared to the 2025/2026 marketing year (Table 1). Notably, corn and soybeans are projected to increase by 6% and 9.6%, respectively, with new crop soybeans projected $1.00 per bushel higher than last marketing year and the highest since 2023/2024 marketing year. Long grain rice and cotton are projected to increase the most at 15.9% and 15.4%, respectively. However, even with year-over-year increases, breakeven yields for the new crop exceed that of the national average projected yield for the 2026/2027 marketing year. National breakeven yields, using the USDA cost of production forecasts, for corn, cotton, and long grain rice are 35%, 53%, and 44% above the current yield expectation while soybeans have a breakeven yield that is 12% above expectation. 

    Historical price movements over the 1996-2025 period suggest that new crop prices tend to fall 5-10% between the release of the May WASDE report and the end of a typical harvest season with some price declines as low as 15% (Figure 1). We note that while prices do tend to move lower into harvest on average, summer markets are often volatile as traders often respond to weather developments and resulting changes to yield expectations (Gardner and Biram, 2023). Often, new crop contracts establish seasonal highs in late June into July before declining into harvest reflecting a weather risk premium (Biram and Loy, 2024; Bhattarai et al., 2026).It is important that farmers consider leveraging appropriate price risk management tools, such as forward contracts, to lock in some price upside prior to harvest (Biram, McKenzie, and Bhattarai, 2025;  Maples, 2026; and Gardner, 2026).

    The complete May 2026 WASDE report can be found at this link.

    Table 1. Year-over-year changes in season-average farm prices and associated breakeven yields
     SAFP (25/26)SAFP (26/27)%Δ in SAFPBreakeven Yield (26/27)National Average Yield (26/27)
    Corn$4.15/bu$4.40/bu+6.0%247.1 bu/acre183 bu/acre
    Cotton$0.63/lb$0.73/lb+15.9%1,322.5 lb/acre866 bu/acre
    Long Grain Rice*$4.69/bu$5.41/bu+15.4%247.1 bu/acre171.8 bu/acre
    Soybeans$10.40/bu$11.40/bu+9.6%59.5 bu/acre53 bu/acre
    *Note: Projected yield for Long Grain Rice is based on the new crop projected yield for All-Rice. The latest estimated Long Grain Rice yield is 163.5 bushels per acre for the 2025/26 marketing year. The SAFP is converted from cwt to bushel by dividing the price per cwt by 2.22.

    Figure 1. Change in Harvest Month Futures Price Relative to Date of May WASDE (1996-2025)

    Source: Barchart.com (2026)

    References

    Bhattarai, Chandan, Andrew McKenzie, Hunter Biram, Jesse Tack, and Alvaro Durand‐Morat. “Risk return of forward contracting corn with crop insurance.” Journal of the Agricultural and Applied Economics Association (2026).

    Biram, Hunter, and Ryan Loy. “May WASDE Projects Higher Supplies and Lower Prices Again in 2024.” Southern Ag Today 4(20.1). May 13, 2024. Permalink

    Biram, Hunter, Andrew M. McKenzie, and Chanda Bhattrai. “How can crop marketing and crop insurance go together?” Southern Ag Today 5(24.3). June 11, 2025. Permalink

    Gardner, Grant. “Price Seasonality: What the Pattern Shows.” Southern Ag Today 6(6.3). February 4, 2026. Permalink

    Gardner, Grant, and Hunter Biram. “USDA Acreage Report Results: Price and Crop Insurance Impacts.” Southern Ag Today. July 3, 2023. Permalink

    Maples, Will. “A New Year, A Better Marketing Plan for the Farm.”Southern Ag Today 6(2.3). January 7, 2026. Permalink


    Biram, Hunter, and H. Scott Stiles. “May 2026 WASDE Highlights for U.S. Supply and Demand and Implications for Price Risk Management.” Southern Ag Today 6(20.3). May 13, 2026. Permalink

  • November 2025 WASDE Report is Relatively Quiet Despite Surprises in Production and Exports

    November 2025 WASDE Report is Relatively Quiet Despite Surprises in Production and Exports

    The November 2025 WASDE report is the first since September to be released due to the government shutdown taking place from October 1, 2025, to November 12, 2025. This month’s report was a relatively quiet one with few significant changes to the balance sheets for southern crops. Season-average farm prices for corn and soybeans were revised upward from the September report, while the prices for rice and cotton were revised downward. Despite the increases in corn and soybeans, futures markets responded with sharp declines in the nearby futures contracts. This was likely driven by production being higher than industry expectations for corn and soybean exports falling short of expectations. We provide a detailed breakdown of the changes to each crop’s respective balance sheet below.

    Long-Grain Rice: 

    This month’s 2025/26 outlook for U.S. long-grain rice includes lower supplies, unchanged domestic use and exports, and decreased ending stocks. Long-grain production was reduced by 1 million hundredweight (cwt.) this month to 152.7 million.  Yields were lowered in all Midsouth states, with Louisiana, Mississippi, and Missouri all seeing average yields reduced by 100 pounds per acre this month.  Arkansas’ average yield was lowered by 50 pounds per acre.  With no adjustments to demand, long-grain ending stocks were lowered by 1.1 million to 36 million cwt., down 3.5 percent from last year. The 2025/26 season-average farm price (SAFP) was lowered by 23 cents per bushel this month to $5.18 per bushel—the lowest since 2018.  This further increases the outlook for sizeable 2025/26 PLC payments, with the current projected payment rate for long-grain at $2.44 per bushel—up 23 cents from September.

    Cotton:

    The November outlook for 2025/26 U.S. cotton supply and demand included higher production, exports, and ending stocks compared to September.  There were no changes to domestic mill use and imports. USDA projected the 2025/26 U.S. crop to reach 14.12 million bales, up roughly 897,000 bales from the September report. The national average yield per acre increased by 58 pounds this month to 919 pounds.  This would be the second-highest yield on record, behind 2022’s 953 pounds.

    U.S. exports were raised 200,000 bales to 12.2 million bales while mill use was unchanged from September at 1.70 million bales. This generates a total 2025/26 offtake of 13.90 million bales. Ending stocks for 2025/26 are projected at 4.30 million bales for an ending stocks-to-use ratio of 30.9%.  This month’s projected average farm price for 2025/26 is 62.00 cents/lb, down 2 cents/lb from September.

    Corn:

    The November report for 2025/26 U.S. corn showed an increase in total supply, exports, and carryover. Production was revised downward 62 million bushels from 16.814 to 16.752 billion bushels based on a reduction of 0.7 bushels per acre in the national yield. On the demand side of the balance sheet, total use is increased 100 million bushels based on an increase in exports of the same amount. Beginning stocks were increased by 207 million bushels from 1.325 to 1.532 billion bushels. Taken together, these changes represent an increase in total supply of 144 million bushels, which is larger than the 44 million bushel increase in total use. Interestingly, this results in a 10-cent increase in the 2025/26 projected season-average price to $4.00/bushel, likely driven by the reduction in national yield and a record large export forecast of 3.075 billion bushels.

    Soybeans:

    The November report for 2025/26 U.S. soybeans showed decreases across the board. Production was revised downward 48 million bushels from 4.301 to 4.253 billion bushels based on a reduction of 0.5 bushels per acre in the national yield. On the demand side of the balance sheet, total use decreased by 51 million bushels based on a decrease in exports of the same amount, driven by lower domestic supplies and increased exports by Brazil and Argentina. While a trade deal between the U.S. and China has been announced, which guarantees soybean purchases through 2028, the announcement also increased the price of U.S. soybeans by 90 cents since October 30th, making the relative price of soybeans lower for Brazil. Beginning stocks decreased by 14 million bushels from 330 to 316 million bushels. Taken together, these changes represent a decrease in total supply of 61 million bushels, which is larger than the 51 million bushel decrease in total use. This 10-million-bushel net reduction in ending stocks results in a 50-cent increase in the 2025/26 projected season-average price to $10.50/bushel.

    Thoughts on USDA’s November Reporting

    Ahead of USDA’s November WASDE and Crop Production reports, concerns arose that NASS might not have sufficient time to conduct an adequate survey of fields and producers, given the recent government shutdown. The November 2025 Crop Production survey had 6,692 participants compared to 5,838 last year. Regarding the field surveys, NASS enumerators visited the fields in October and early November, despite the shutdown. NASS provided the objective corn and soy yield data for November. One might argue there is no reason to believe that the November yield estimates are any less (or more) reliable than in previous years.  

    However, USDA did note “some U.S. data sources that are typically used were not available for the November 2025 WASDE.”  Further noting, USDA mentioned changes to the U.S. balance sheets reflected all U.S. government data available at the time of publication.  Over the past month, information such as the weekly Export Sales and daily export “flash” reporting was unavailable, as well as government reporting on ethanol production and consumption.  

    The next WASDE is scheduled for December 9th.  USDA normally makes no crop production adjustments until the NASS Crop Production Annual Summary is released in January.  In the near term, the major crop markets will be focused on actual Chinese demand for US soybeans and cotton as well as South American weather. These will be primary drivers of price discovery for the balance of 2025.


    Biram, Hunter D., and H. Scott Stiles. “November 2025 WASDE Report is Relatively Quiet Despite Surprises in Production and Exports.” Southern Ag Today 5(47.3). November 19, 2025. Permalink

  • Margin Crop Insurance Available Across the Southern Region 

    Margin Crop Insurance Available Across the Southern Region 

    As harvest progresses and crop prices stay at historical lows, it is difficult to consider risk management for 2026. The federal crop insurance program offers a tool that can currently provide a form of county-level revenue protection. Margin Protection (MP) crop insurance was made available for a variety of crops across the southeast region in 2024. MP is an area-level (i.e., county-level) crop insurance product designed to provide risk protection against the risk of thin margins using a combination of county yields, futures prices, and region-specific input usage. Coverage levels range from 70% to 95% and may be purchased with any individual insurance, such as Yield Protection (YP) or Revenue Protection (RP). It may not be purchased with Supplemental Coverage Option (SCO) or Enhanced Coverage Option (ECO) (see Biram and Connor, 2023). Additionally, there is a new product offering similar to ECO and MP called Margin Coverage Option (MCO), which I will provide more details on below.

    For certain crops/regions the sales closing date (SCD) for MP coverage is similar to other traditional products, However, in some cases there is an early SCD and price discovery window. This early window offers the opportunity to lock in prices sooner if you think that might be an advantage to the normal spring price discovery. Check here for MP SCD’s and price discovery windows. The earlier price discovery window offered by MP (August 15, 2025, to September 14, 2025), provides corn and soybean producers with the option to buy MP and lock in futures prices, if they think that might be an advantage over the normal price discovery window (January 15, 2026, through February 14, 2026). For example, the current USDA, Risk Management Agency (RMA) projected price for MP purchased for corn is $4.55/bushel, which implies a price guarantee of $4.32/bushel assuming county yields and costs remain constant.  The risk of cost of production portion of MP provides protection from price volatility for Urea, Diammonium Phosphate (DAP), Diesel, and the Interest Rate on a farmer’s production loan. These prices also face projected price discovery periods similar to crop futures prices but have different windows of harvest price discovery (see Chattha and Biram, 2024).

    Another decision variable in the MP coverage decision is the Protection Factor (PF). The PF ranges from 80% to 120% and offers higher (lower) protection at a higher (lower) premium cost and largely functions as a farm-level production adjustment. That is, if a farmer perceives their yield to be higher than the county average, they may select a PF higher than 100% at an additional premium cost. Alternatively, if a farmer perceives their yield to be lower than the county average, they may select a PF less than 100% and pay a lower premium.

    The University of Arkansas, Cooperative Extension Service offers a fully web-based Margin Protection decision aid. The decision aid allows the user to input information such as state, county, crop, and irrigation practice to determine Margin Losses (i.e., indemnities) net of producer paid premiums across all coverage levels. Additionally, the tool offers a feature that calculates a breakeven price, which is a harvest time crop futures price that results in a Zero Net Indemnity, or a Margin Loss equal to the producer paid premium. Breakeven prices vary by coverage level and harvest county yields input by the user. 

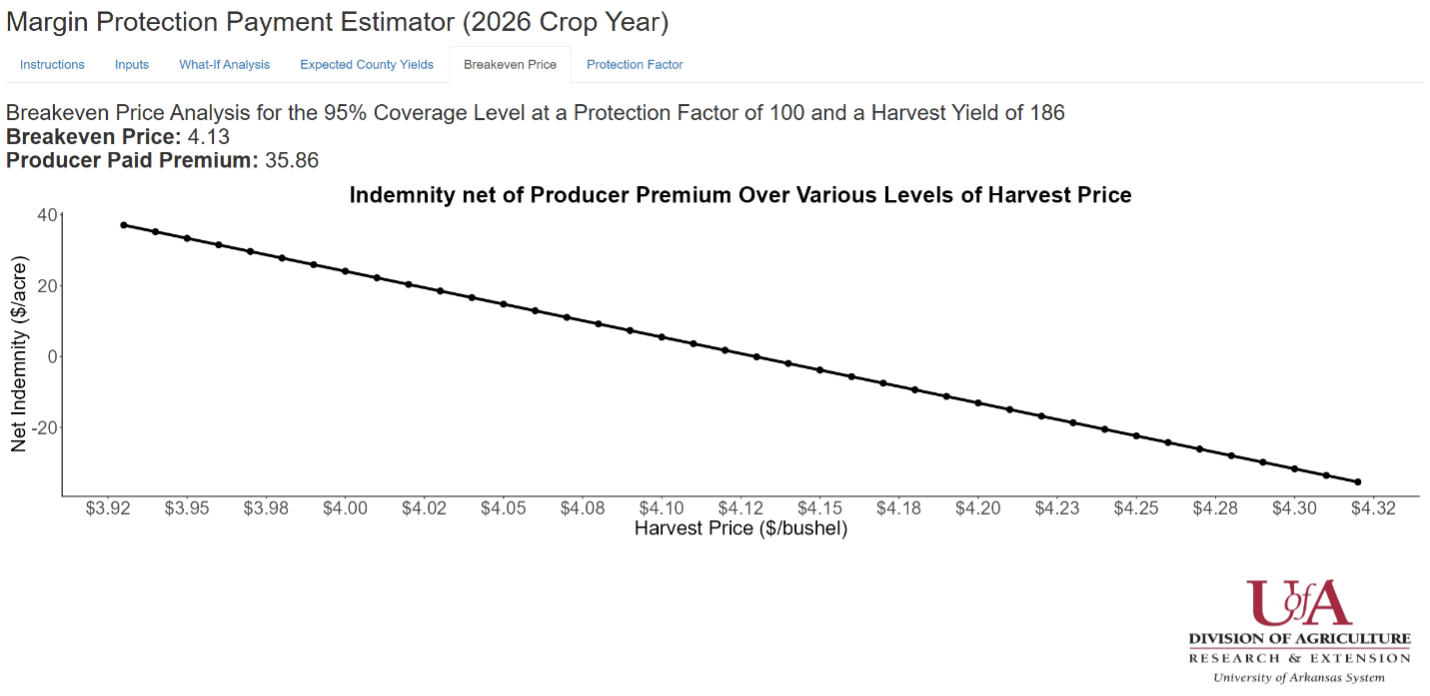
    An example output showing net indemnities across different harvest crop futures prices, including a breakeven price of $4.13/bushel at the 95% coverage level, is provided in Figure 1 below. This figure suggests that Margin Losses at or above the producer paid premium are experienced if the 2026 December corn futures price has a 30-day average below $4.13/bushel at harvest (i.e., from August 15, 2026, through September 14, 2026). You may access the Margin Protection Payment Estimator (2026 Crop Year) at this link. Fact sheets which provide all of the details of MP, including counties eligible for enrollment, may be found at the following links: Margin Protection Crop Insurance and Determining Expected Cost and Premium Rates.

    Figure 1. Example Breakeven Price Figure from Margin Protection Payment Estimator Tool 

    This is an example of net indemnities across various harvest time crop futures prices for corn in Arkansas County, Arkansas assuming county yield remains unchanged. Intuitively, as the harvest price increases the net indemnity decreases.

    Margin Coverage Option (MCO)

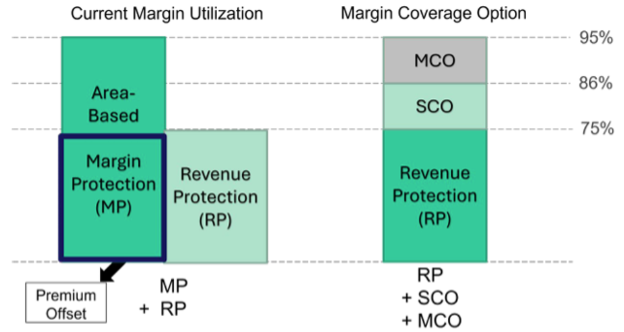
    Like MP, MCO provides area-based coverage against an unexpected fall in operating margin. This could be driven by a fall in the county-level yield average, a fall in the harvest-time futures price, or an increase in the futures prices of select inputs or any combination of these perils. MCO faces the same projected and harvest price discovery periods for crop futures and input future prices as MP. MCO uses the same expected and final county-level yields as SCO and ECO and covers a band from 86% to either 90% or 95% of expected county-level revenue. Figure 2 provides a visual comparison of MP and MCO and their eligibility to be enrolled with other federal crop insurance products.  Currently, the subsidy rate for MCO is the same as the updated subsidy rates for SCO and ECO, which is 80% of the actuarially fair premium, meaning farmers will pay 20% of the total premium expense. For a full list of crops and MCO pilot areas, visit www.margincoverageoption.com. The Sales Closing Date (SCD) for the 2026 crop year for MCO on cotton and sorghum is September 30, 2025, while the SCD for MCO on Rice in Arkansas is February 28, 2026, like MP and other major crop insurance plans (e.g., YP, RP, SCO, and ECO). 

    Figure 2. Comparing Coverage Bands of MP and MCO and Eligible with Other Federal Crop Insurance Products

    Source: www.margincoverageoption.com

    MCO Resources

    USDA, Risk Management Agency Frequently Asked Questions on ECO

    USDA, Risk Management Agency Fact Sheet on MCO

    Watts and Associates Website for MP

    Watts and Associates Website for MCO

    References

    Biram, H.D. and Connor, L. (2023). Types of Federal Crop Insurance Products: Individual and Area Plans. University of Arkansas System Division of Agriculture, Cooperative Extension Service Fact Sheet No. FSA75.

    Biram, H.D. and Stiles, S. (2022). Margin Protection Crop Insurance: A Way to Manage the Risk of High Input Costs. University of Arkansas System Division of Agriculture, Cooperative Extension Service Fact Sheet No. FSA66.Chattha, K.A. and Biram, H.D. (2024). Determining Expected Cost and Premium Rates in Margin Protection Crop Insurance. University of Arkansas System Division of Agriculture, Cooperative Extension Service Fact Sheet No. FSA87.


    Biram, Hunter D. “Margin Crop Insurance Available Across the Southern Region.” Southern Ag Today 5(42.1). October 13, 2025. Permalink