Author: J. Mark Welch

  • Market Impact of the June 30 Acreage and Grain Stocks Reports

    Market Impact of the June 30 Acreage and Grain Stocks Reports

    For its first official production estimates of the new crop year, published in the May World Agricultural Supply and Demand Estimates (WASDE), USDA relies on the planted acreage number from the Prospective Plantingssurvey conducted in late February to mid-March and reported at the end of March. Compared to those March survey numbers, the annual Acreage and quarterly Grain Stocks reports released by USDA at the end of June can change those numbers significantly, thus having the potential to be a major market mover.  

    In the May WASDE (and carried forward unchanged in the June WASDE), USDA estimated 95.3 million acres of corn for 2025 (Table 1) and harvested acres of 87.4 million (91.7% harvest rate).  That compares to 90.6 million acres planted in 2024 and 82.9 million harvested (91.5% harvest rate).  The average guess by traders ahead of the June Acreage report was 95.2 million corn acres planted.  The Acreage report also showed U.S. farmers planted 95.2 million acres of corn for 2025, 100,000 acres below the March survey, but right on the average trade guess. 

    Also revised in the Acreage report was estimated acres harvested for corn.  While acres planted were down only 100,000 from previous estimates, acres harvested were down 600,000. The harvested percentage dropped from 91.7% to 91.1%.  

    Plugging those numbers into the supply and demand balance sheet from the June WASDE, and leaving all other supply and demand factors unchanged, these new acreage numbers lower corn production for 2025 (and ending stocks) by 114 million bushels (Table 2). With use held steady and a reduction in ending stocks, days of use on hand at the end of the marketing year (a representation of the stocks-to-use ratio) decreases from a 41.3-day supply in the June WASDE down to a relatively tight 38.6-day supply.  

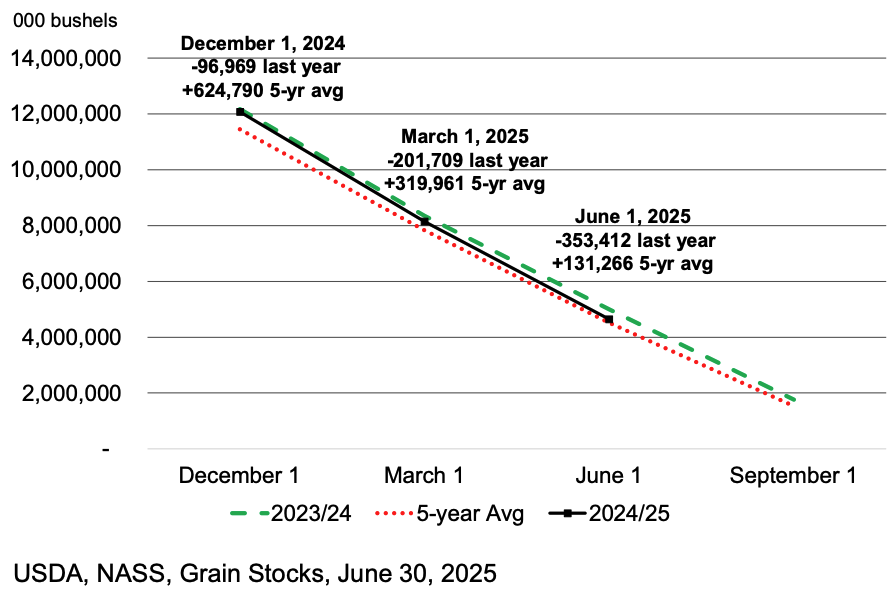
    June 1 Grain Stocks were estimated at 4.64 billion bushels of corn, 1.01 billion bushels of soybeans, and 851 million bushels of wheat. Corn stocks are down compared to a year ago while soybeans and wheat stocks are higher. Corn disappearance in the period from December 1 to June 1 was a record 7.432 billion bushels, as depicted in Figure 1 as the difference from the December 1 stock to the June 1 stock. Last year, use in that period was 7.174 billion bushels compared to the five-year average 6.937 billion bushels. 

    Other items in the June USDA reports focused on Soybeans and Wheat.  Soybeans came in at 83.4 million acres planted, 100,000 below the March Prospective Plantings and 200,000 below average trader expectations. Soybean acres harvested were revised from 82.7 million to 82.5 million, a 200,000-acre decrease.  All wheat at 45.5 million acres was up 100,000 compared to Prospective Plantings and trader expectations.  All wheat harvested acres were revised downward by 600,000 acres from 37.2 million to 36.6 million. 

    Given the numbers reported by USDA in the 2025 Acreage report, production estimates for U.S. corn, soybeans, and wheat will likely be revised lower on fewer harvested acres. However, the Grain Stocks report shows a small decrease in corn carryover and increased carryover of soybeans and wheat relative to trade expectations, implying forthcoming changes in old crop use estimates.  Adding old crop ending stock adjustments to new crop production estimates, it looks like the new crop supply numbers got a little tighter for corn and wheat, and a small increase for soybeans.  

    Table 1. Planted Acreage and Grain Stocks from USDA and Industry Reports

    June 30th Acreage and Grain Stocks
    2025 Planted Acres (millions)
     PlantedAverage from ExpertsRange from ExpertsMarch Intentions2024
    Corn95.295.293.8-96.095.390.6
    Soybeans 83.483.683.0-85.083.587.1
    All Wheat 45.545.445.0-46.045.446.1
    Winter Wheat33.333.333.0-33.433.333.4
    Spring Wheat 10.010.19.8-10.210.010.6
    Durum 2.12.02.0-2.12.02.1
    June 1st Grain Stocks (million bushels)
     June 1, 2025Average From ExpertsRange from ExpertsMar 1, 2025Jun 1, 2024
    Corn4,6444,6484,459-4,9558,1514,997
    Soybeans1,008971936-1,0201,910970 
    Wheat851835805-8521,237696
    Source: USDA and DTN

    Table 2. U.S. Corn Supply and Demand Balance Sheet

    U.S. Corn2024/25June WASDE2025/26June Acreage2025/26
    Planted Acreage (Mil. Acs.)90.695.395.2
    Harvested Acreage (Mil. Acs.) 82.987.486.8
    Yield (Bushels)179.3*181.0*181.0*
    Supply                                                     —Million Bushels—
    Beginning Stocks1,7631,3651,365
    Production14,86715,820*15,706*
    Imports252525
    Total Supply16,65517,210*17,096*
    Disappearance    
    Domestic Use12,64012,785*12,785*
    Exports2,6502,6752,675
    Total Use15,290*15,460*15,460*
    Ending Stocks1,3651,7501,636
    Carryover/Use (days on hand) 32.641.338.6
    Average Farm Price ($/Bu.)4.354.204.20
    *Record High
    Source: USDA World Agricultural Supply and demand Estimates and Acreage 2025

    Figure 1. U.S. Corn Stocks, All Positions

    References:

    DTN/Progressive Farmer. “USDA Reports Preview”, June 26, 2025 https://www.dtnpf.com/agriculture/web/ag/news/article/2025/06/26/acreage-stocks-reports-set-tone-us.

    USDA, NASS. Acreage, https://usda.library.cornell.edu/concern/publications/j098zb09z.

    USDA, NASS. Grain Stocks, https://usda.library.cornell.edu/concern/publications/xg94hp534.

    USDA, Office of the Chief Economist. World Agricultural Supply and Demand Estimates (WASDE), https://www.usda.gov/about-usda/general-information/staff-offices/office-chief-economist/commodity-markets/wasde-report.

  • Recap of the May WASDE for U.S. Grains

    Recap of the May WASDE for U.S. Grains

    The May 2025 World Agricultural Supply and Demand Estimates (WASDE) is a highly anticipated report as it offers the first official USDA estimates of the new crop marketing year (USDA, 2025).  For 2025/2026, the estimates show a divergence of fundamental factors in the U.S. grain markets.   Estimated days of use on hand at the end of the marketing year (a stocks-to-use ratio calculated by dividing ending stocks by average daily use) are projected to increase in 2025/2026 compared to 2024/2025 for corn, wheat, and rice. Conjointly, the season average farm price is projected lower for these three grains. For soybeans, days of use on hand are forecast to decrease and the farm price is forecast to increase compared to last year. 

    Based on the Prospective Plantings report back in March, corn acres for 2025 are projected at 95.3 million, up from 90.6 million in 2024. USDA’s yield estimate for 2025 is a record high 181.0 bushels per acre. This combines for a record corn crop of 15.820 billion bushels.  Add in 1.415 billion bushels of beginning stocks and the corn supply in the 2025/2026 marketing year is a record 17.206 billion bushels, up 3.6% from last year.

    U.S. corn use is projected at record levels as well with increases in feed and exports.  However, the increase in corn supply exceeds the increase in use, resulting in an increase in ending stocks. Days on hand increased by an 8.6-day supply, and the season average farm price is down from $4.35/bu last year to $4.20/bu. With a PLC reference price in 2025 of $4.26/bu, that would earn a 6-cent-per-bushel payment. 

    Soybean acres for 2025 are estimated at 83.5 million, down from 87.1 million in 2024.  But with a record forecast yield of 52.5 bushels per acre, production in 2025 is down only 26 million bushels from 2024.  Soybean use is forecast to increase by 31 million bushels on increased domestic crushings. Ending stocks are expected to decrease by 55 million bushels, and days of use on hand are expected to decline by 4.8 days. The season average farm price is projected to increase by 30 cents per bushel to $10.25.

    U.S. wheat production is estimated to be little changed from the 2024 crop with the decrease in acres mostly offset by a higher yield estimate.  Impacting the wheat supply for 2025/2026 is an increase in beginning stocks and a decrease in projected imports (-30 million bushels).  Wheat use is projected lower on a decrease in exports of 20 million bushels. This raises the wheat ending stock estimate by 82 million bushels, increases carryover to a 172-day supply, and lowers the season average farm price from $5.50/bu last year to $5.30/bu. With a $5.56/bu reference price, this would generate a PLC payment of 26 cents per bushel. 

    The U.S. rice supply in 2025/2026 is projected higher, as an increase in beginning stocks offsets a small decline in production. Use is up 1 million hundredweight with an increase in domestic use and a decrease in exports.  This leaves ending stocks up 3.5 million hundredweight and days on hand higher by 3.2. The farm price is down $2 per hundredweight to $13.20, below the PLC reference price of $14.00. 

    Of course, much can change between these early season estimates and final crop production and use numbers.  Weather, trade policies, the economy, global grain fundamentals, and other factors foreseen and unforeseen, will evolve and emerge to shape grain prices. The May WASDE is an important benchmark to assess and estimate the impact of these changes and forces as the season unfolds. 

    Table 1.    May 2025 WASDE Numbers for U.S. Grains (corn, soybeans, and wheat in millions of bushels; rice million hundredweight) and 2025 PLC Reference Prices and Estimated Payment Rate.

    CropCornSoybeansWheatRice
     mil buchange*mil buchange*mil buchange*mil cwtchange*
    Beginning Stocks1,415-348350+8841+14545.0+5.2
    Production15,820**+9534,340-261,921-50219.3-2.8
    Total Supply17,260**+6054,710-242,882+64313.5**+3.5
    Total Use15,460**+2204,415+311,959-18266.0**+1.0
    Ending Stocks1,800+385295-55923+8247.5+2.5
    Days on Hand42.5+8.624.4-4.8172.0+16.765.2+3.2
    Price $/bu or $/cwt
    Farm Price$4.20-$0.15$10.25$0.30$5.30-$0.20$13.20-$2.00
    PLC Reference Price$4.26 $9.26 $5.56 $14.00 
    PLC payment rate$0.06 $0.00 $0.26 $0.80 

    *change 2025/26 marketing year compared 2024/25 marketing year.

    **record high

    Reference

    USDA, Office of the Chief Economist. World Agricultural Supply and Demand Estimates, May 12, 2025. Available online at https://www.usda.gov/about-usda/general-information/staff-offices/office-chief-economist/commodity-markets/wasde-report.


    Welch, J. Mark. “Recap of the May WASDE for U.S. Grains.” Southern Ag Today 5(20.3). May 14, 2025. Permalink

  • Estimating Corn Planted Acres for 2025

    Estimating Corn Planted Acres for 2025

    With planting season underway across much of the South, and soon across the Corn Belt, one of the major questions that will impact price direction is planted acreage.  At the Agricultural Outlook Forum (AOF) in late February, USDA projected corn area planted at 94.0 million acres, up from 90.6 million in 2024 (Figure 1). The increase in acres from 2024 to 2025 was not a surprise given recent strength in corn prices relative to that of soybeans. But, the magnitude of the increase relative to trade expectations can have an impact on futures prices. 

    Additional information on farmer planting intentions will be released in the March 31 Prospective Plantingsreport. This survey is administered by the National Agricultural Statistics Service (NASS) during the first two weeks in March. The next official report of planted acres is the Acreage report of June 30, an additional farmer survey of actual crop acres planted (and remaining intended). 

    Acres planted is a fluid variable with estimates moving from USDA’s model-based projections (February Outlook) to late-winter farmer intentions (March Prospective Plantings) to area actually planted (June Acreage).  Shifts in futures prices as we move from winter to spring offer some indication of what to expect in forthcoming reports. 

    First, is the relationship between the numbers of the Outlook forum and the prospective plantings survey. In the 29 years since 1996 (the Freedom to Farm era, which moved away from acreage restrictions to greater flexibility in farmer planting decisions), farmer planting intentions were lower than the acreage number presented at the Outlook Forum 17 times (59%); while 12 years were higher (41%). The average for all years is 184,000 acres less of actual planted acreage compared to the Outlook forecast. Balanced against trade expectations, this would generally be seen as bullish for corn prices. 

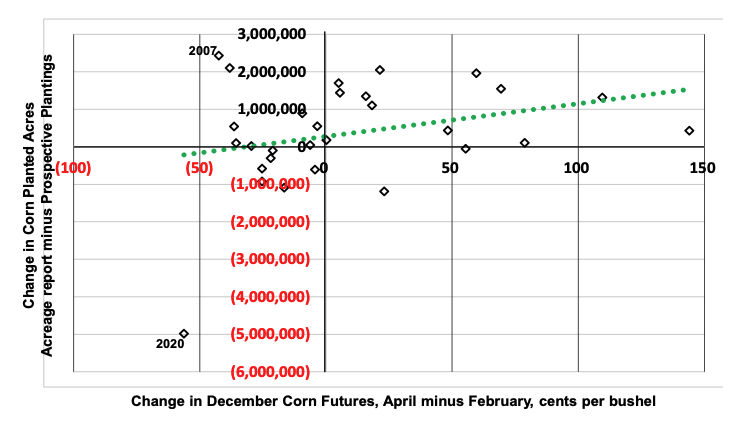
    Second, do changes in futures prices affect farmer planting decisions as we move from late winter to spring? Using monthly average inflation adjusted prices of the December corn contract, there is a positive relationship between price changes and acres planted (Figure 2). Years in which the December futures contract increased from February to April tend to be correlated with an increase in acres planted relative to intended. A decline in prices from February to April is associated with fewer acres planted than intended. A rough estimate of that relationship is that a one-cent change in price changes area planted by about 9,000 acres.[1]

    How does this information position us for the release of 2025 acreage numbers? First, the greatest likelihood is for corn acres intended to come in lower than the projections of the Outlook Forum (bullish). Next, at the time of this writing, the average 2025 December corn futures closing price in March is 451.77 compared to 469.67 in February. If this relationship holds, that is, if the average price in April is still below the February price, that suggests a further reduction in acres from intended to actual (bullish). 

    Of course, a multitude of other supply and demand variables will ultimately influence the harvest price of corn. Extremes in the change in corn acres planted in response to price came in years of dramatic shifts in demand: 2007 (+2.4 million acres at the beginning of the biofuel era) and 2020 (-5.0 million acres, Covid). Developments related to tariffs and trade may be the catalyst for magnified response in the dynamics of price and acreage in 2025.  

    Figure 1. U.S. Corn Acres: Agricultural Outlook Forum (AOF), Prospective Plantings (PP), and Acreage

    Figure 2. Corn planted acres in response to a change in price

    [1] For more on farmers’ response to price shocks on planting decisions, see “Estimating Supply Elasticities for Corn in the United States: Accounting for Prospective Plantings”, Raghav Goyal, Michael K. Adjemian, and William Secor, AAEA, 2022.


    References:

    USDA, NASS, Acreage. Available online at https://usda.library.cornell.edu/concern/publications/j098zb09z.

    USDA, Agricultural Outlook Forum. Available online at https://www.usda.gov/about-usda/general-information/staff-offices/office-chief-economist/agricultural-outlook-forum

    USDA, NASS, Prospective Plantings. Available online at https://usda.library.cornell.edu/concern/publications/x633f100h


    Welch, J. Mark. “Estimating Corn Planted Acres for 2025.Southern Ag Today 5(13.3). March 26, 2025. Permalink

  • Recap of the October WASDE for Grains and Soybeans

    Recap of the October WASDE for Grains and Soybeans

    Updates in the October 2024 WASDE continued the overall fundamental market conditions in grains and soybeans (Table 1). Compared to the 2023/2024 marketing year, the factors of supply are increasing more than the factors of demand in 2024/2025. That results in an increase in the stocks-to-use ratio, measured here as estimated days of use on hand at the end of the marketing year [= ending stocks divided by (total use divided by 365)].  The days of use on hand measures how long we could get by next year on the crop that is left over from this year.  An increase in the number of days of use on hand indicates a larger supply cushion in case of a production shortfall, which puts downward pressure on prices. 

      Table 1. WASDE: U.S. Supply and Demand

    Focusing more specifically on each commodity:

    Corn. USDA increased the national average corn yield this month from 183.6 bushels per acre in September to 183.8, an all-time record high. The biggest changes to the supply and demand balance sheet came from increases in use in old crop, lowering the beginning stock number for the 2024/25 marketing year by 52 million bushels. Domestic use categories in new crop corn were unchanged, but USDA increased exports by 25 million bushels. 

    World corn ending stocks were down slightly as the 1.6 million metric ton (mmt) increase in supply was exceeded by a 3.5 mmt increase in use. 

    While the supply and demand numbers for corn were mostly neutral, the increase in use is a bullish sign. 

    Wheat. The numbers for wheat in the October WASDE reflect crop information in the September Small Grains Summary: a small decrease in planted acres and yield. These changes lowered production slightly but were largely offset by an increase in imports.  The only change in use was an increase of 10 million bushels for feed.  

    Only minor changes were made to estimates of world wheat supply and demand: supply down 1.9 mmt; use down 2.4 mmt; and ending stocks up 0.5 mmt.  

    The report was slightly bullish for U.S. wheat with a small decrease in estimated ending stocks and a reduction in the days of use on hand at the end of the marketing year, down from a 154-day supply last month to 150. But the U.S. only accounts for 7% of the world wheat supply. The stocks-to-use ratio for world wheat this month was higher.   

    Rice. Rice numbers were little changed this month, with a small increase in yield increasing supply and ending stocks. 

    World rice production is up 3.1 mmt this month primarily due to an increase in India. The largest rice exporter in the world, India’s rice exports increased from 18.0 mmt last month to 21.0 mmt. This is the second highest rice export number for India, just below the record 22.0 mmt in 2021/2022.  

    The report was neutral for U.S. rice supply and demand but bearish overall given the increase in foreign rice production with little change in use. 

    Soybeans. The national average soybean yield was lowered by 1/10th of a bushel to 53.1, still a record high. Along with this small change in production was a small increase in beginning stocks and small decrease in use. Ending stocks were unchanged. 

    The world soybean balance sheet was mostly unchanged: supply down 0.2 mmt; use down 0.3 mmt; and ending stocks up 0.1 mmt.

    With virtually no changes to U.S. or world supply and demand numbers, the October WASDE was fundamentally neutral for soybeans. 


    Welch, J. Mark. “Recap of the October WASDE for Grains and Soybeans.
    Southern Ag Today 4(42.3). October 16, 2024. Permalink

  • GDP and the Farm Economy

    GDP and the Farm Economy

    Gross Domestic Product (GDP) is likely the most closely watched and commonly cited economic indicator. GDP is “…the market value of all goods and services produced within a country in a given period of time” and is “…the best single measure of a society’s economic well-being” (Mankiw, 2007). While tracking and forecasting GDP is important for businesses, labor, investors, policymakers, and economists, it has important implications for the farm economy as well.  GDP can be thought of as how well off your customers are to buy the things you produce. 

    The International Monetary Fund uses GDP to track global economic growth by country and country groups. Real GDP growth (adjusted for inflation) has exhibited interesting trends since 1980 that have implications for grain markets (Figure 1).  From 1980 to 2000, there was very little difference between growth rates of GDP between advanced economies (e.g., U.S., Japan, most of Europe, Canada, Australia, U.K), and emerging market and developing economies (e.g., Brazil, Russia, India, China, Mexico). Advanced economies grew at an average rate of 2.9%, with emerging market and developing economies growing by 3.5%. 

    Figure 1. Global Economic Growth, real GDP, 1980-2029

    In the early 2000s, world economic growth rates began to be driven by emerging economies. Gains in productivity, rising per capita incomes, and a growing middle class have made many emerging economies more competitive as suppliers to world export markets and increased the size of their domestic markets (Kose and Prassad, 2010). From 2000 to 2019, the growth rate of advanced economies was 1.9%, with emerging and developing economies growing by an average of 5.5%. 

    Since 2020, economic growth rates in emerging economies have slowed. Global conflicts, trade tensions, inflation, and rising interest rates are a few of the factors cited for a slowdown in economic growth, factors that hit emerging and developing economies especially hard (IMF, 2024).  Estimates for 2020-2024 show advanced economies growing by an average of 1.5% and emerging and developing economies by 3.6%. Including forecasts by the IMF for the next five years, average GDP growth from 2020-2029 is projected to be 1.7% for advanced economies and 3.8% for emerging and developing. 

    Figure 2. Real GDP growth in emerging and developing economies and world per capita grain consumption   

    Trends in world grain consumption have shown significant changes since 1980 as well (Figure 2; blue line).  In 1980, consumption of barley, corn, millet, mixed grains, oats, rice, rye, sorghum, soybeans, and wheat was 348 kg per person.  By the end of the 1999/2000 marketing year, that number was down to 340 kg. Then, per capita consumption began to grow, reaching over 400 kg by 2019.  With increasing protein in diets and grain for fuel, the most recent estimate of world per capita grain consumption in 2024 is 410 kg. 

    An overlay of GDP growth in emerging and developing economies and world per capita grain consumption shows the relationship between these factors (Figure 2). From 1980-1999, a period with little difference between growth in advance economies and emerging economies, GDP grew by 3.5% while grain use per capita fell by 7 kg (-0.4 kg/yr).  From 2000-2019, an era of globalization and expanding economic impact in emerging economies with GDP on the rise, grain use increased by 62 kg (+3.1 kg/yr). Since 2019, post-pandemic, with slower rates of growth in GDP, grain use has increased by 8 kg (1.6 kg/yr), about half the rate of growth of the previous 20 years. 

    Per capita grain consumption is one measure of global grain demand. Even if per capita consumption is unchanged, growth in the population base would still mean an increase in grain consumption. In 1980, the world population was increasing by 1.6% per year. In 2000, population growth was 1.3%. That growth rate is down to 0.9% in 2024 and forecast to be 0.8% by 2030, half the rate of growth in 1980 (USDA, ERS, 2024).  

    Important to levels of grain use are patterns of global economic growth, especially GDP growth in emerging and developing economies. As growth rates in this region slow down over the next decade, per capita grain use may yet increase, but at a slowing rate. 

    The combination of slowing population growth and a slowdown in economic growth may alter recent patterns in world grain use.  That means gains in productivity (weather permitting) have a higher likelihood of exceeding gains in use. When that happens, that is a recipe for lower prices. 

    References:

    International Monetary Fund (IMF). World Economic Outlook, July 2024, http://www.imf.org.

    Kose, M.A. and E. Prassad. “Emerging Markets Come of Age”, Finance and Development, Vol. 47, No 4, December 2010.

    Mankiw, Gregory. Brief Principles of Macroeconomics, Fourth Edition, Thompson South-Western, Mason, Ohio, 2007.

    USDA, Economic Research Service. “International Macroeconomic Data Set”, https://www.ers.usda.gov/data-products/international-macroeconomic-data-set/.

    USDA, Foreign Agriculture Service. “Production, Supply, and Distribution (PSD) database”. https://apps.fas.usda.gov/psdonline/app/index.html#/app/home.


    Welch, J. Mark. “GDP and the Farm Economy.Southern Ag Today 4(32.1). August 5, 2024. Permalink