With planting season underway across much of the South, and soon across the Corn Belt, one of the major questions that will impact price direction is planted acreage. At the Agricultural Outlook Forum (AOF) in late February, USDA projected corn area planted at 94.0 million acres, up from 90.6 million in 2024 (Figure 1). The increase in acres from 2024 to 2025 was not a surprise given recent strength in corn prices relative to that of soybeans. But, the magnitude of the increase relative to trade expectations can have an impact on futures prices.
Additional information on farmer planting intentions will be released in the March 31 Prospective Plantingsreport. This survey is administered by the National Agricultural Statistics Service (NASS) during the first two weeks in March. The next official report of planted acres is the Acreage report of June 30, an additional farmer survey of actual crop acres planted (and remaining intended).
Acres planted is a fluid variable with estimates moving from USDA’s model-based projections (February Outlook) to late-winter farmer intentions (March Prospective Plantings) to area actually planted (June Acreage). Shifts in futures prices as we move from winter to spring offer some indication of what to expect in forthcoming reports.
First, is the relationship between the numbers of the Outlook forum and the prospective plantings survey. In the 29 years since 1996 (the Freedom to Farm era, which moved away from acreage restrictions to greater flexibility in farmer planting decisions), farmer planting intentions were lower than the acreage number presented at the Outlook Forum 17 times (59%); while 12 years were higher (41%). The average for all years is 184,000 acres less of actual planted acreage compared to the Outlook forecast. Balanced against trade expectations, this would generally be seen as bullish for corn prices.
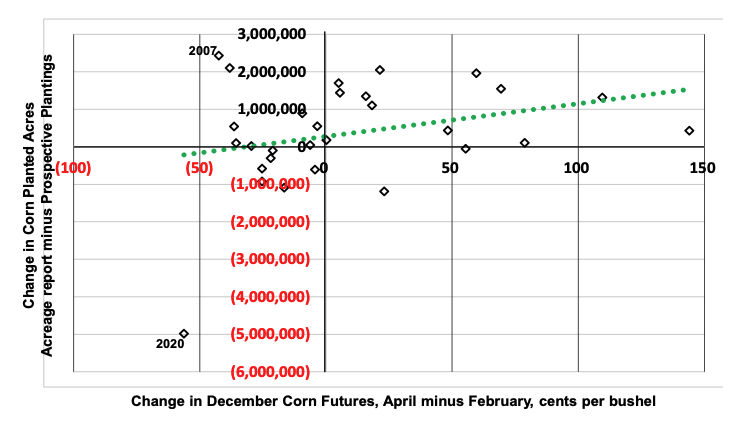
Second, do changes in futures prices affect farmer planting decisions as we move from late winter to spring? Using monthly average inflation adjusted prices of the December corn contract, there is a positive relationship between price changes and acres planted (Figure 2). Years in which the December futures contract increased from February to April tend to be correlated with an increase in acres planted relative to intended. A decline in prices from February to April is associated with fewer acres planted than intended. A rough estimate of that relationship is that a one-cent change in price changes area planted by about 9,000 acres.[1]
How does this information position us for the release of 2025 acreage numbers? First, the greatest likelihood is for corn acres intended to come in lower than the projections of the Outlook Forum (bullish). Next, at the time of this writing, the average 2025 December corn futures closing price in March is 451.77 compared to 469.67 in February. If this relationship holds, that is, if the average price in April is still below the February price, that suggests a further reduction in acres from intended to actual (bullish).
Of course, a multitude of other supply and demand variables will ultimately influence the harvest price of corn. Extremes in the change in corn acres planted in response to price came in years of dramatic shifts in demand: 2007 (+2.4 million acres at the beginning of the biofuel era) and 2020 (-5.0 million acres, Covid). Developments related to tariffs and trade may be the catalyst for magnified response in the dynamics of price and acreage in 2025.
Figure 1. U.S. Corn Acres: Agricultural Outlook Forum (AOF), Prospective Plantings (PP), and Acreage

Figure 2. Corn planted acres in response to a change in price
[1] For more on farmers’ response to price shocks on planting decisions, see “Estimating Supply Elasticities for Corn in the United States: Accounting for Prospective Plantings”, Raghav Goyal, Michael K. Adjemian, and William Secor, AAEA, 2022.
References:
USDA, NASS, Acreage. Available online at https://usda.library.cornell.edu/concern/publications/j098zb09z.
USDA, Agricultural Outlook Forum. Available online at https://www.usda.gov/about-usda/general-information/staff-offices/office-chief-economist/agricultural-outlook-forum
USDA, NASS, Prospective Plantings. Available online at https://usda.library.cornell.edu/concern/publications/x633f100h
Welch, J. Mark. “Estimating Corn Planted Acres for 2025.” Southern Ag Today 5(13.3). March 26, 2025. Permalink