Author: Joe Outlaw

  • If You are Following the Conversation about Reference Prices… Here are a Few Facts 

    If You are Following the Conversation about Reference Prices… Here are a Few Facts 

    There was a time when agricultural economists who focus on farm policy didn’t take a position on a farm bill proposal.  At least the authors of this article were taught by our mentors…just describe what’s in a policy proposal and don’t take a position…that’s not your job.  Good and bad was for others to decide…primarily elected officials since it is, in fact, their job.  Those days are over.  In the last two weeks since the House Agriculture Committee majority released details of their bill, there has been a steady stream of articles talking about the proposal’s reference price increases as being tilted to the South and Southern crops. 

     We thought we would instead try to provide facts and information that you can use to help decide whether any proposed bill—House or Senate—is providing a safety net for all U.S. farmers.

    Fact #1 

    During the development of every farm bill, there are people who say unequivocally that one or more commodities are advantaged relative to others.  In the current environment – with ARC and PLC as the Title I safety net programs – since they are both countercyclical, producing a map that shows payments are higher in one area really means very little.  It very likely means that prices for those crops are lower and triggering payments, not that the farm bill was titled toward producers of those crops.

    Fact #2 

    While farm bills encompass a broad range of topics, producers rely on the programs in Title I and Title XI to provide a minimal safety net so they can endure economic downturns like we are currently in.  Without meaningfully bolstering the safety net provided in Title I and Title XI, the producers we encounter all over the country see little benefit in passing a new farm bill.    

    Fact #3

    Statutory reference prices were established in the 2014 Farm Bill and have not kept up with increases in the cost of production.  Using USDA cost of production data, the average increase in costs from 2014 to 2023 (the most current) for corn, cotton, grain sorghum, peanuts, rice, soybeans, and wheat was 31 percent.

    Fact #4 

    The effective reference price (ERP) provisions included in the 2018 Farm Bill allow individual crop reference prices to increase based on the 5-year Olympic average of market prices (lagged one year) multiplied by 85%.  ERPs are capped at 115% of statutory reference prices.  Of the 23 covered commodities with reference prices, only 10 (corn, oats, soybeans, grain sorghum, large chickpeas, small chickpeas, mustard seed, crambe, sesame seed and temperate japonica rice) had market prices increase enough to result in a 2024 ERP greater than the statutory reference prices in the 2018 Farm Bill.   Of these 10, only corn, soybeans and grain sorghum represent significant base acreages.  Based on realized market prices and CBO projections, corn and soybean ERPs are expected to increase each year and hit the 115% cap in each year through 2027.  Based on hearing testimony in both the House and Senate, commodities not in that position were seeking reference price increases in the next farm bill.

    Fact #5

    Statutory reference prices are set by Congress.  In past farm bills, at least since the 1970s, reference prices and their predecessor (i.e., target prices) have been established with the commodity’s cost of production in mind.  Looking at major crop cost of production for 2023 indicates that current reference prices are not covering much of major commodity costs (Table 1).   This happens for two reasons: (1) costs are higher than reference prices and (2) the payment calculations use an 85% payment factor to reduce payments.  Based on USDA data, wheat and grain sorghum appear to have the strongest case for significant reference price increases, but USDA data is just one resource the Committees use in establishing support levels.

    Table 1.  Major Crop Cost of Production, Effective Reference Prices and Percent of Costs Covered by the Effective Reference Price.

    1The 85% payment factor is included in this calculation.  2The majority of rice acres are planted to medium or long grain.  The reference price for these rice types was included in the table.

    Outlaw, Joe, Nathan Smith, and Bart L. Fischer. “If You are Following the Conversation about Reference Prices… Here are a Few Facts.Southern Ag Today 4(21.4). May 23, 2024. Permalink

  • Higher Reference Prices Are Critical… But So Is Increasing Payment Limits

    Higher Reference Prices Are Critical… But So Is Increasing Payment Limits

    In a recent Southern Ag Today article we highlighted the overwhelming need to increase commodity reference prices in the next farm bill based on hearing testimony from the commodity groups.  While we continue to believe that this is the first and most important step in making meaningful changes to our country’s farm safety net, a very close second would be to increase the payment limit to account for the impact of inflation.  Actually, we would argue that payment limits should be eliminated completely because they are implemented for social engineering not economic reasons…but that is a discussion for another day.

    Why do we think payment limits should be increased?  Using data from the Agricultural and Food Policy Center’s (AFPC) database of representative farms—and illustrated for crop year 2025—the 3,400-acre Iowa corn/soybean farm is projected to be facing much lower commodity prices.  In 2025, market receipts are projected to be $2.5 million with corn and soybean prices at $4.30 and $10.46/bu.  Costs in 2025 are projected to be lower at $2.7 million, resulting in a $200,000 loss without government assistance (of course, the loss could also be much larger if prices fall more than expected).  Assuming ARC and/or PLC are improved to the point that they would trigger assistance in 2025, the support would be limited to $125,000, leaving the farm with a loss of $75,000.  Even though Congress will have spent hundreds of hours conducting hearings and debating how to help farmers stay in business… payment limits will reduce the effectiveness of the improved safety net.  Said another way, the producer puts $2.7 million at risk through borrowing or self-financing, and if there is a price or production problem, the Federal government will help with up to $125,000, or 4.6% of what the producer has at risk in this example. 

    How much payment limits should be raised tends to be almost as contentious as whether we should have them.  As a frame of reference, modern-day payment limits trace their roots to the 1970 Farm Bill with a $55,000 payment limit for each of the annual programs for wheat, feed grains, and cotton in crop years 1971, 1972, and 1973.  The figure below illustrates the magnitude of that payment limit ($55,000 for a single program/crop) were it in place today and indexed for inflation. That $55,000 payment limit would have been $413,247 in 2023, more than three times larger than the current combined payment limit of $125,000 applying to all covered commodities eligible for ARC and PLC.  If the limits from the 1970 Farm Bill were combined for a producer growing all three crops (i.e., $165,000), the payment limit today would be just over $1.2 million. Again, this doesn’t mean a producer is entitled to a payment of $1.2 million; it simply means that any losses up to $1.2 million could be covered. Instead, under current law, any losses beyond $125,000 are borne entirely by the producer.

    Figure 1. Initial 1970 Farm Bill Limit ($55,000) Indexed for Inflation.


    Outlaw, Joe, and Bart L. Fischer. “Higher Reference Prices Are Critical… But So Is Increasing Payment Limits.” Southern Ag Today 4(13.4). March 28, 2024. Permalink

  • Demand for Raising Reference Prices Not Hidden Very Well

    Demand for Raising Reference Prices Not Hidden Very Well

    Recently we were emailed a publication regarding the lack of progress on the farm bill that really gave us pause.  As is normally the case, we agree with much of the article; however, one specific sentence (below) in the conclusions cannot go unaddressed.   

    “Farm Bill reauthorization has failed to launch; it is the hidden demand for increasing reference prices, not matched by any actual proposals and shielded from public scrutiny, that blocks any potential for progress.”

    There are two problems with this sentence.  First, the demand for higher reference prices isn’t really “hidden.”  Last year the House and Senate Agriculture Committees held multiple hearings and listening sessions regarding what producers want in the next farm bill.  The hearings that focused on Title I of the farm bill were on April 26th in the House of Representatives and May 2nd in the Senate.  

    In the House hearing, of the nine witnesses representing covered commodities that receive safety net protection from ARC (Agriculture Risk Coverage) and PLC (Price Loss Coverage) for their crops, only three didn’t explicitly ask for higher statutory reference prices in the next farm bill (USA Dry Pea and Lentil Council, U.S. Canola Association and National Corn Growers Association (NCGA)).  However, the NCGA witness asked to “strengthen the Price Loss Coverage (PLC) effective reference price ‘escalator’” which would cost money and result in higher reference prices for corn.  Thus 7 out of 9 wanted higher reference prices.

    In the Senate hearing, there were seven witnesses representing covered commodities that receive safety net protection from ARC and PLC.  Six of the seven explicitly asked for higher reference prices with the NCGA witness again asking to strengthen the PLC effective reference price escalator. In other words, seven out of seven witnesses from national groups asked to increase the reference price for their commodity.

    The second problem with the statement is this notion that the demand for higher reference prices is “not matched by any proposals and shielded from public scrutiny.”  At this point, the agricultural committees are at the mercy of House and Senate leadership who have provided little to no additional funds for developing the next farm bill.  Committee leadership and staff have been left to “find” savings from other areas of the farm bill to fund higher reference prices.  Thus far, it appears none of the sources of funds found to fund reference price increases have been acceptable to their counterparts across the aisle.  If anything is responsible for the failure of farm bill reauthorization to launch, it is that impasse. As for higher reference prices, the demand is abundantly apparent. Once the impasse is broken, only then will the stage be set for fulsome discussions on the extent to which the reference prices can be raised.


    Outlaw, Joe, Bart L. Fischer, and Katelyn Klawinsky. “Demand for Raising Reference Prices Not Hidden Very Well.Southern Ag Today 4(9.4). February 29, 2024. Permalink

  • Proposed Safety Net Choice Could Add Risk to Farmers

    Proposed Safety Net Choice Could Add Risk to Farmers

    In a January 17th Dear Colleague letter, Senator Debbie Stabenow (D-MI), Chairwoman of the Senate Committee on Agriculture, Nutrition, and Forestry, outlined her proposal for strengthening the farm safety net in the 2024 Farm Bill (found here). The proposal centered around five key principles:

    • programs must be targeted to active farmers;
    • we need to provide farmers choices and flexibility;
    • assistance should be timely;
    • we need to expand the reach of programs to help more farmers; and
    • we need to address the emerging risks farmers face.

    Since the letter was released, considerable attention has been paid to the comments she offered about crop insurance and providing producers expanded safety net choices.  Part of the proposal reads as follows: 

    “The 2018 Farm Bill provided cotton farmers with a choice between the traditional base acre programs and a highly-subsidized and streamlined area-based crop insurance policy. The next Farm Bill should give a similar option to all commodities.”

    There is a considerable amount of detail about the evolution of the cotton program – from removing lint as a covered commodity to adding seed cotton as a covered commodity – that is not contained in the letter.  In this article, I walk through the history to provide more context.  

    First, to resolve the decade-long WTO Brazil cotton dispute (which involved, among other things, the U.S. Government having to pay the Brazilians $147 million per year in cash to fend off retaliation), cotton industry leadership suggested removing cotton as a covered commodity for Title I commodity programs (PLC and ARC) and modifying the marketing assistance loan.  Second, in lieu of ARC/PLC, the 2014 Farm Bill provided cotton producers an industry-proposed area-wide insurance program, the Stacked Income Protection Plan (STAX).  The premium subsidy for STAX was 80%, higher than the 65% subsidy authorized for the Supplemental Coverage Option (SCO) that is available for all crops. Third, upland cotton producers were provided Cotton Transition Assistance Payments (CTAP) for 2014 to aid in the transition to STAX.  

    STAX protection was deemed insufficient to protect cotton producers from collapsing prices, so cotton ginning cost share (CGCS) payments were provided for the 2015 and 2016 crop years. Ultimately, the Bipartisan Budget Act of 2018 restored ARC and PLC protection to cotton producers by adding seed cotton as a covered commodity.  While STAX was still available to seed cotton producers, they could not enroll their seed cotton base in ARC/PLC and still purchase STAX on the farm in the same year – they were required to decide between the two options.  

    Requiring producers to make the choice between ARC/PLC and STAX was a political compromise required at the time to get cotton added back to the farm bill.  While there is certainly merit to expanding STAX to other crops – or simply improving SCO and the Enhanced Coverage Option (ECO) that are already available to all crops – I would argue that now is the time to eliminate the requirement altogether (rather than expanding it to other crops).  While there has long been a prohibition between the purchase of SCO and ARC – because both offer area-wide coverage and they are very similar in design – there is little justification for requiring producers to choose between PLC and area-wide coverage, both of which serve vastly different safety net functions.

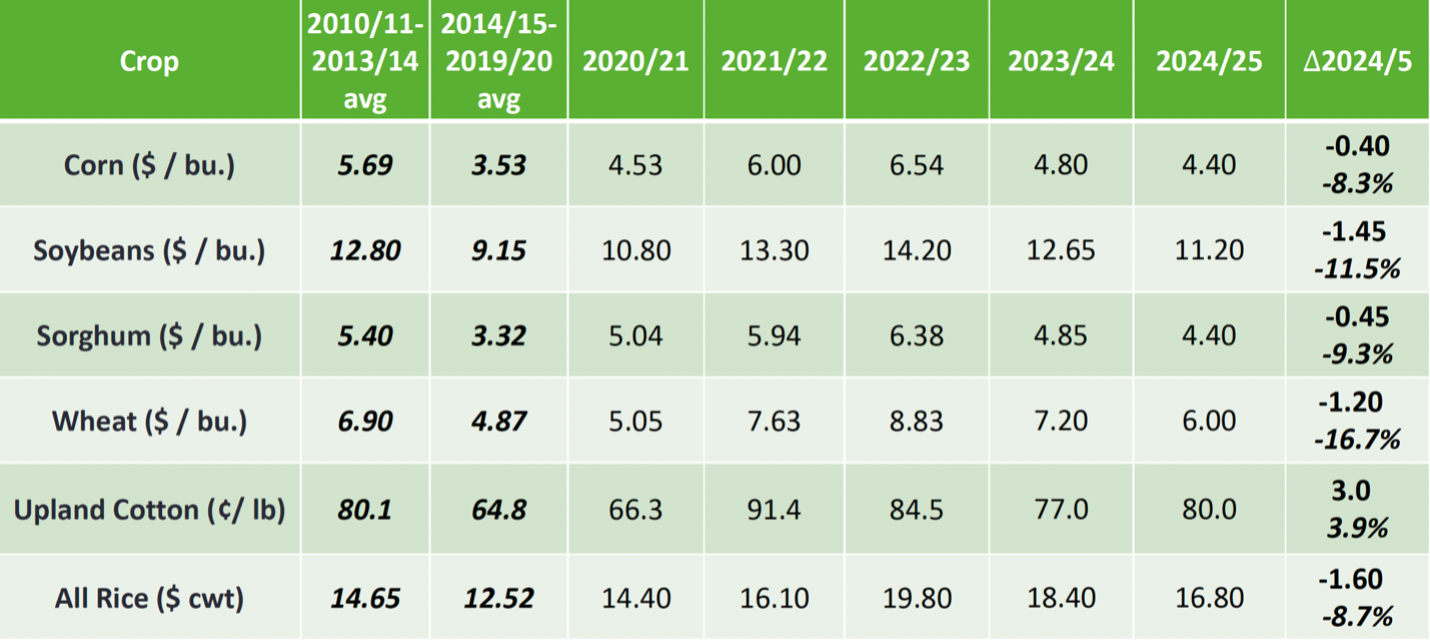
    To illustrate the challenges presented by such a choice, consider the following for cotton.  Figure 1 indicates the share of annual upland cotton insurance liability covered by STAX and the share of policies sold.  Producers initially utilized STAX; however, after a few years of unsatisfactory results, the share of liability covered and policies sold declined.  In 2019, when producers actually began a crop year with a choice of ARC/PLC or STAX, the percent of liability covered by STAX, as well as the share of upland cotton policies sold, was relatively low as marketing year average prices (MYAP) were low (Figure 2).  After that, due to Reference Prices not keeping up with input costs (and due to a relatively higher initial insurance price), seed cotton producers moved back to STAX in 2021, 2022 and 2023, with STAX still accounting for just 20% of the policies sold. 

    As for the 2024 growing season – with futures prices currently below the cost of production for most growers – growers must now choose between (1) an ineffective ARC/PLC with Reference Prices that have not kept up with inflation or (2) STAX, which can certainly help, but at most will partially offset significant losses they are almost guaranteed to face (absent well-above-expected prices or yields). In other words, growers are faced with two poor options.

    After nearly 40 years of working on farm policy, it seems clear to me that there is a need for both (1) improving Reference Prices in Title 1 and (2) improving area-wide coverage in crop insurance, particularly since the two were designed to work in tandem.  It certainly isn’t clear that expanding the choice that was forced on cotton producers to everyone else without higher reference prices is much of a choice.

    Figure 1.  STAX Share of Cotton Crop Insurance Liability and Policies Sold.

    Figure 2.  Historic Cotton Prices.


    Outlaw, Joe L. “Proposed Safety Net Choice Could Add Risk to Farmers.Southern Ag Today 4(5.4). February 1, 2024. Permalink

  • Shouldn’t the Farm Safety Net Target Those Feeding the Country?

    Shouldn’t the Farm Safety Net Target Those Feeding the Country?

    In remarks during a March 16, 2023, hearing before the Senate Committee on Agriculture, Nutrition, and Forestry, Secretary Vilsack testified that while “our policies have ensured an increasingly abundant food supply, growth in farm size and consolidation has put extreme economic pressure on small and medium sized farms and our rural communities…. We must ask ourselves: do we want a system that continues to force the big to get bigger and the small and underserved to get out or do we want a build a more innovative system?”

    The United States has grappled with this small-farm versus large-farm debate for decades.

    While many claim that the safety net is targeted toward large farms, it should be noted that (1) the safety net is provided to producers on a per-acre basis regardless of size and (2) Congress has invested a significant amount of resources in helping small, beginning, socially disadvantaged, limited resource, and veteran producers get started in production agriculture. Congress has also significantly curtailed access to the farm safety net for larger farm operations via means testing, actively engaged determinations, and payment limits.

    The U.S. has been on this path of fewer but larger farms since the beginning of the last century.  Data from the 1920 Census indicated there were 6,448,343 farms with an average farm size of 148.2 acres.[1]  According to the 2017 Census of Agriculture, in 2017 there were 2,042,220 farms with an average farm size of 441 acres.[2]  Not only has average farm size been growing, it is also resulting in a shift in the composition of farms.  Figure 1 illustrates that about one-half of U.S. production comes from large-scale family farms that only make up 3.2 percent of farms, versus 94.7 percent (small and moderate size farms) accounting for 26.2 percent of production.  The USDA Economic Research Service (ERS) also noted that small-scale operators depend on off-farm income while large-scale farms derive almost all of their income from the farm. 

    These results have significant policy implications: namely, who is the farm bill – and the farm safety net in particular – intended to benefit?  Washington think tanks argue that Title I benefits in the farm bill should be redirected to smaller farms. This ignores economic reality on the ground, where full-time family operations are putting enormous amounts of capital at risk. We applaud Congress for continuing to focus on full-time family producers who are actually trying to make a living from their operation – all while doing the most to feed the country. 

    Figure 1. Median income of farm households, by income source and farm type, 2021.


    This paper summarizes the farm size part of a paper by these authors entitled “Examining Farm Size & Payment Limits” commissioned by the Southwest Council of Agribusiness.

    [1] 1920 Census of Agriculture. Accessed at h#ps://agcensus.library.cornell.edu/census_year/1920-census/

    [2] 2017 Census of Agriculture. Accessed at

    https://www.nass.usda.gov/PublicaKons/AgCensus/2017/Full_Report/Volume_1,_Chapter_1_US/usv1.pdf


    Outlaw, Joe, and Bart L. Fischer. “Shouldn’t the Farm Safety Net Target Those Feeding the Country?Southern Ag Today 4(1.4). January 4, 2024. Permalink