Author: John Robinson

  • The Market Outlook for New Crop Cotton

    The Market Outlook for New Crop Cotton

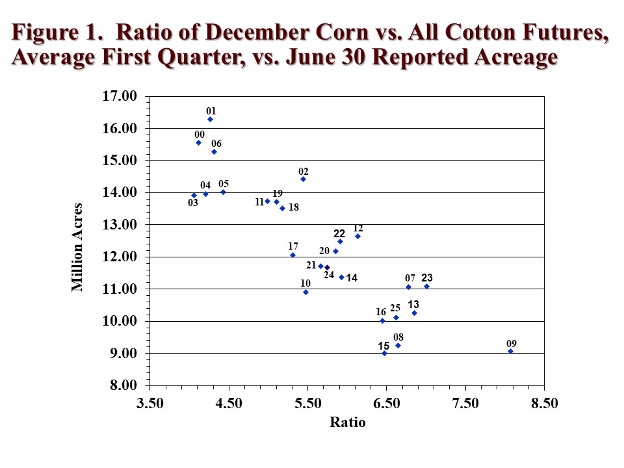
    The market outlook for cotton is similar to other commodities in that it is influenced by expectations of supply and demand. Cotton’s “new crop” outlook specifically refers to the 2027/28 marketing year, when the 2027 crop will be produced, processed, stored, and sold.  A major supply-related question is how much 2027 acreage will be planted to cotton.  The price of competing crops, relative to cotton prices, is an important consideration to the level of planted cotton acreage. Figure 1 shows a fairly strong relationship between the level of U.S. upland and pima cotton planted (as measured on June 30) and the ratio of December CBOT corn futures and ICE cotton futures during the first quarter of the year.  The higher the ratio, the less cotton is planted. 

    Of course, there are other important competing crops as well, e.g., sorghum, soybeans, and peanuts.  There are various other influences, including how dry it is in Texas, the insurance base price, fixed cost influences, and the psychological influence of the preceding growing season.  But the price ratio of corn to cotton appears to capture a lot of these other influences in explaining variations in cotton plantings.

    What does Figure 1 imply for 2027?  As of September 21, the Dec’27 CBOT corn/Dec’27 ICE cotton price ratio was 6.77 (i.e., $5.37 corn divided by 79-cent cotton). Assuming this ratio prevails during Q1 of 2027, it is historically associated with between 10.0 and 11.0 million acres of all cotton.  A simple univariate regression, based on the data underlying Figure 1 and the prices as of September 21, projects a point estimate of 10.3 million acres planted.

    Under what conditions will the 2027 crop be planted? The National Oceanic and Atmospheric Administration’s Climate Prediction Center forecasts a 90% chance of strengthening El Niño conditions during the fall and winter. The latter is associated with wetter weather patterns in some of the drier portions of the Cotton Belt. This increases the possibility of harvesting more planted acreage, particularly dryland acreage in the southern plains region. This has implications for the 2027 production and supply.

    Assuming 10.3 million planted acres of all cotton in 2027, and further assuming modestly below average abandonment (14%) and yield per harvested acre (800 lbs), the result is a healthy crop of 14.76 million bales (Table 1). This combines with NASS’s September 11, 2026, projection of 3.60 million bales of carry-in for an 18.37 million bale supply. Matching this supply against a possible 14.5 million bales of total use, which assumes a modest increase in exports simply from having more exportable surpluses, results in 3.87 million bales of ending stocks of U.S. cotton in 2027/28. That outcome is neutral for prices as it represents static year-over-year ending stocks. 

    Caveats.  Obviously, the analysis above depends on price ratios which may change between now and early 2027.  Furthermore, the price ratio approach to forecasting planted acreage will be replaced by grower survey results, beginning at the Beltwide Conference (January 6) and continuing with the National Cotton Council’s survey release (February 8) and the United States Department of Agriculture’s Prospective Plantings report (March 31) and Acreage report (June 30).

    The other major caveat is the outcome for abandonment.  The 2007 and 2010 crops are examples of unexpectedly low abandonment (e.g., 5%) following El Niño winters. This poses a risk of greater supply and perhaps weaker prices.

    Figure 1. Ratio of Dec Corn:Dec Cotton Futures, 1st Quarter average, vs, June30 Reported Acreage of All Cotton with Linear Trend Line

    Table 1. U.S. All Cotton Balance Sheets for 2025/26, 2026/27, and 2027/28 Marketing Years.

    2025/262026/272027/28
    Area Million Acres
    Planted9.2810.4510.30
    Harvested7.838.168.86
    Pounds
    Yield/Harvested Acre852776800
    Million 480 Pound Bales
    Beginning Stocks4.004.153.60
    Production13.9013.2014.76
    Imports0.000.010.01
         Supply, Total17.9017.3618.37
    Domestic Use1.501.501.50
    Exports, Total12.3012.3013.00
         Use, Total13.8013.8014.50
    Unaccounted-0.05-0.040.00
    Ending Stocks4.153.603.87
    Stocks-to-Use29.4%26.1%26.7%
    Sources: USDA OCE for 2025/26 and 2026/27; 
    Author’s Forecast of 2027/28.
  • Speculative Long Positioning Coincides with Rising Cotton Prices

    Speculative Long Positioning Coincides with Rising Cotton Prices

    The Commodity Futures Trading Commission (CFTC) publishes weekly “Commitment of Traders” (COT) data on the positions of index funds and hedge funds in agricultural futures markets (Figure 1).  The changes in these speculative futures positions have near term value in explaining fluctuations in ICE cotton futures.  

    For roughly two years, the hedge fund (or “non-commercial” or “managed money”) speculative position has been net short, meaning there is an excess of outright short sellers over longs.  This position has been associated with a low level and relatively flat pattern of ICE cotton nearby futures settlements.

    In April of 2026, the hedge fund short position in ICE cotton flipped to net long (see the thin upward green spike on the right-hand side of Figure 1).  This move was associated with initial buying to cover open short positions, followed by outright new buying.  This move is also associated with a twenty-cent rally in nearby ICE cotton futures.

    What other market implications are there from this speculative positioning?  Judging from the narrowness of many of the green spikes in Figure 1, we observe that the bullish or bearish influence of hedge fund positioning can sometimes be short lived. In the present case, hedge fund buying can act like a catalyst for higher prices, perhaps influencing prices to trend higher and move more quickly than fundamentals might justify.  The same can happen in reverse, i.e., liquidation of long speculative positions can contribute to volatility.  This has implications for the need for pre-harvest pricing strategies.

    The current price outlook for U.S. cotton in 2026 is fundamentally neutral in terms of the year-over-year comparison of ending stocks. The 2026/27 projection of ending stocks is within 500,000 bales of the 2025/26 estimate of ending stocks.  But in the near term, speculators and commercials are likely waiting for the unfolding of a so-called “weather market”, i.e., the effect of early dryness and forecasted El Niño moisture on the supply outcome.  The hedge funds will play their speculative role in this outcome, and likely contribute to seasonal price volatility.

    Figure 1. ICE Cotton Net Position of Index funds and Hedge Funds vs. Nearby ICE Cotton Futures Settlement

    January 3, 2006 Through May 12, 2026


    Robinson, John. “Speculative Long Positioning Coincides with Rising Cotton Prices.” Southern Ag Today 6(21.3). May 20, 2026. Permalink

  • An End to the Disruption of Two Key Weekly Federal Crop Reports

    An End to the Disruption of Two Key Weekly Federal Crop Reports

    From October 1, 2025, to November 12, 2025, the U.S. federal government was largely shut down until a congressional stalemate was resolved involving appropriations legislation. The 43-day duration of this shutdown was unprecedented, but some of its effects are taking even longer to resolve.

    The agricultural marketing implications of the federal shutdown included the suspension of important public agricultural data, especially near term (i.e., weekly) data.  Such data are important for characterizing near term influences on cotton prices.  For example, the USDA Foreign Agricultural Service (FAS) publishes a weekly export sales report for cotton (and other row crops) which serves as a useful indicator of export demand.  As displayed in Figure 1, cotton weekly export sales in relation to nearby ICE cotton futures are helpful in explaining or predicting export quantities demanded.  

    USDA FAS weekly export sales reports resumed on November 13, but export data picked up where it left off (i.e., for September 18).  Even with issuing semi-weekly reports to catch up, the normal one-week lag schedule won’t be achieved until January 8, 2026.  The one-week lag schedule has the most value as a current demand indicator.  But instead of a 43-day delay, we are really dealing with a 112-day delay (September 18 to January 8) until a full return to normal reporting.  Thus for over a hundred days, the only market participants with knowledge of the current export demand picture were the merchandizers.

     For another example, the Commodity Futures Trading Commission (CFTC) publishes weekly “Commitment of Traders” (COT) data on the positions of index funds and hedge funds in agricultural futures markets (Figure 2).  The changes in these speculative futures positions have near term value in explaining fluctuations in ICE cotton futures.  Like the cotton export sales data, the COT data have little explanatory power outside of a week old.

    The 2025 Commitment of Traders (COT) report schedule saw significant revisions due to the federal funding lapse, leading to catch-up publications throughout the end of 2025.  Reports for late October and November 2025 were pushed to December 2025, with the CFTC increasing frequency until a return to the normal reporting schedule on December 29, 2025.  Beyond the direct shutdown (7 to 8 weeks) the CFTC near term publication schedule won’t be fully restored until after a 17-week period.

    Thus, the disruption of valuable near-term cotton marketing data flow has been quite long, but as we enter the new year, we are finally back to a normal reporting period.


    Robinson, John. “An End to the Disruption of Two Key Weekly Federal Crop Reports.” Southern Ag Today 5(53.3). December 31, 2025. Permalink

  • Next Year’s Cotton Market Possibilities

    Next Year’s Cotton Market Possibilities

    Longer run price outcomes for the 2026 crop will be influenced by expectations of supply and demand.  A major supply-related question is how much 2026 acreage will be planted to cotton.  The price of competing crops, relative to cotton prices, is an important consideration to the level of planted cotton acreage. Figure 1 shows a fairly strong relationship between the level of U.S. upland and pima cotton planted (as measured on June 30) and the ratio of December CBOT corn futures and ICE cotton futures during the first quarter of the year.  The higher the ratio, the less cotton is planted. 

    Of course, there are other important competing crops as well, e.g., sorghum, soybeans, and peanuts.  There are non-price influences, including how dry it is in Texas, the insurance base price, fixed cost influences, and the psychological influence of the preceding growing season.  But the price ratio of corn to cotton appears to capture a lot of these other influences in explaining variations in cotton plantings.

    What does Figure 1 imply for 2026?  As of early August, the Dec’26 CBOT corn/Dec’26 ICE cotton price ratio is roughly 6.5 (i.e., $4.50 corn divided by 69-cent cotton).   Assuming this ratio prevails during Q1 of 2026, it is historically associated with between 10.0 and 10.5 million acres of all cotton.

    Assuming 10.0 million acres of all cotton in 2026, and further assuming ten-year Olympic averages of U.S. all cotton abandonment (21%) and yield (869 lbs) per harvested acre, the result is a healthy crop of 14.3 million bales. This combines with NASS’s August 12, 2025 projection of 3.6 million bales of carry-in for a 17.9 million bale supply. Further assuming 14.2 million bales of total use, the result is under four million bales of ending stocks of U.S. cotton in 2026/27.  That outcome is neutral for prices as it represents static year-over-year ending stocks. 

    Caveats.  Obviously, the analysis above depends on price ratios which may change between now and early 2026.  Furthermore, the price ratio approach to forecasting planted acreage will be replaced by grower survey results, beginning at the Beltwide Conference (January 7) and continuing with the National Cotton Council’s survey release (February 9) and United States Department of Agriculture’s Prospective Plantings report (March 31) and Acreage report (June 30).

    The National Oceanic and Atmospheric Administration’s Climate Prediction Center forecasts equal chances for continuing ENSO-neutral conditions or the development of La Niña conditions during the winter.  The latter would imply more dryness and higher abandonment during 2026. 

    Data Sources: 
    Historical June 30 planted all cotton acreage data from https://www.nass.usda.gov/Quick_Stats/
    CBOT Dec corn and ICE Dec cotton futures settlements compiled from www.barchart.com

    Robinson, John. “Next Year’s Cotton Market Possibilities.” Southern Ag Today 5(34.3). August 20, 2025. Permalink

  • Scope of Chinese Retaliatory Tariffs on U.S. Cotton Exports

    Scope of Chinese Retaliatory Tariffs on U.S. Cotton Exports

    The 2025 trade war between the U.S. and China has been an evolving phenomenon.  The U.S. implemented tariffs on Chinese imports effective February 4, which were then increased March 4.  China responded with a variety of tariffs, including 15% additional tariffs on U.S. raw cotton, effective March 10.  

    The above situation continued to change, with the U.S. and China effectively embargoing their mutual trade in April with extreme tariff levels and then adjusting these extreme levels lower in May.  As of May 12, and for 90 days, the Chinese tariff rate on U.S. cotton is 10%.

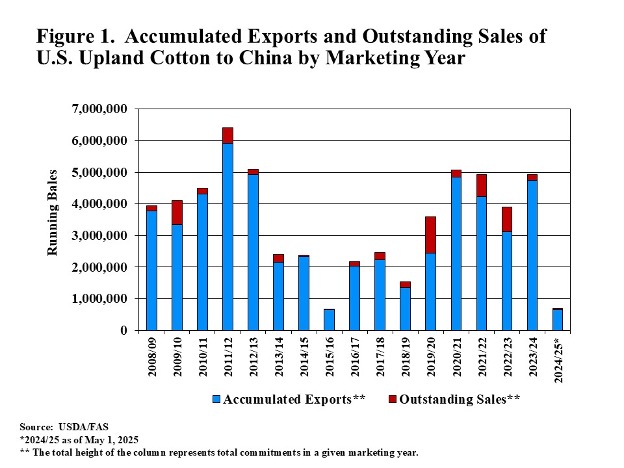
    With all the policy variation, the direct impact on U.S. cotton has probably been lower in the current 24/25 marketing year than it would have been in previous years.  The reason is that 2024/25 has seen an historically low level of U.S. export commitments to China of upland cotton (Figure 1). Thus, there is relatively little volume of U.S. cotton to be directly impacted by the initial, extreme, or current levels of Chinese tariffs.

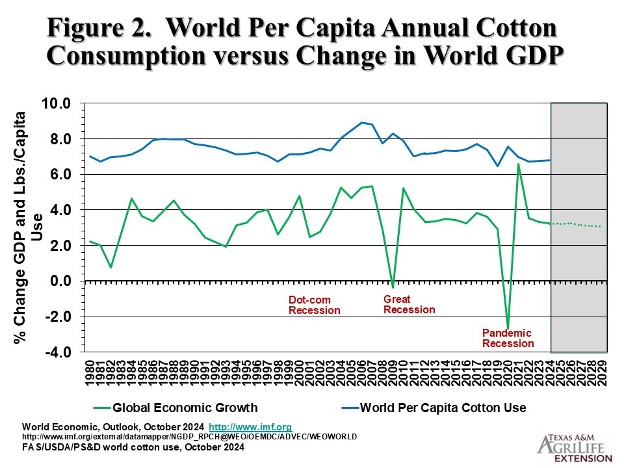
    The remaining tariff risk to cotton demand is more likely an indirect influence.  To the extent that tariffs imposed by the U.S. and its trading partners depress GDP, it follows that demand for semi-durable discretionary textile products could be reduced.  This possibility is suggested in Figure 2, where the percentage change in world GDP appears to move directly with annual per capita cotton consumption.


    Robinson, John. “Scope of Chinese Retaliatory Tariffs on U.S. Cotton Exports.” Southern Ag Today 5(21.3). May 21, 2025. Permalink