Author: K. Aleks Schaefer

  • 2025 U.S. Agricultural Trade Outlook: Navigating Uncertainty Amid Policy Shifts

    2025 U.S. Agricultural Trade Outlook: Navigating Uncertainty Amid Policy Shifts

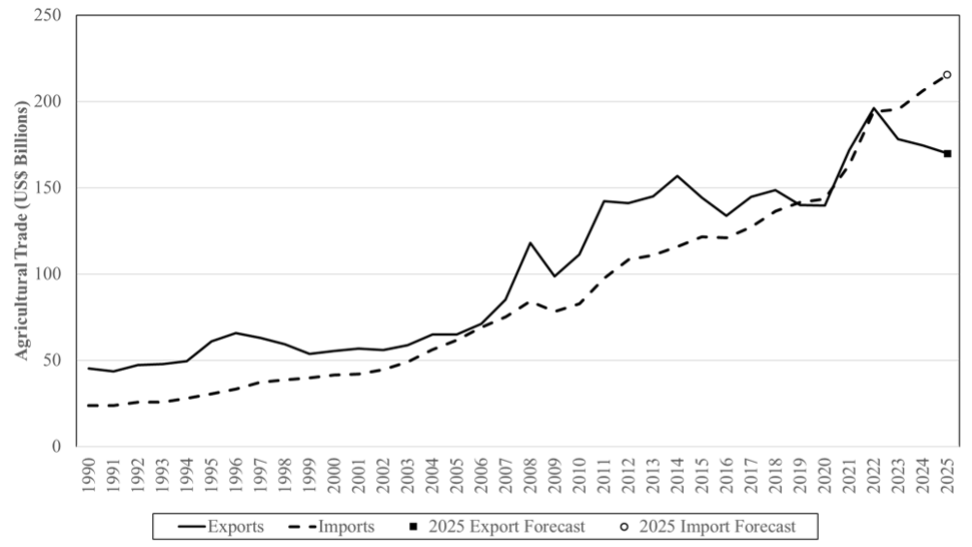
    The U.S. agricultural trade outlook for 2025 is clouded with uncertainty driven by both global economic dynamics and domestic policy shifts. As shown in Figure 1 below, the USDA projects that agricultural exports could reach $170 billion—a slight decrease from the 2024 calendar year. Imports are expected to reach a record $215.5 billion. If both projections are accurate, these trade patterns would result in a record $45.5 billion agricultural trade deficit.

    Figure 1: USDA Outlook for Agricultural Trade

    Source: USDA Economic Research Service (2024) “Outlook for U.S. Agricultural Trade,” available at https://www.ers.usda.gov/topics/international-markets-u-s-trade/u-s-agricultural-trade/outlook-for-u-s-agricultural-trade/

    However, prospective changes in domestic trade policy loom large over these projections. The incoming Trump administration has signaled plans for sweeping tariffs, including a proposed 60% tariff on Chinese goods and a 10% tariff on all other imports. These measures aim to protect domestic industries, but they risk triggering retaliatory tariffs from key trade partners. A resurgent trade war could severely restrict access to critical export markets, particularly China, the largest buyer of U.S. soybeans prior to the previous trade war. Retaliatory actions could further depress already struggling commodity prices and deepen challenges for U.S. farmers.

    The USDA’s outlook underscores that exports to traditional markets such as Mexico and Canada are forecasted to remain strong, driven by demand for corn, beef, and dairy. However, exports to China are expected to decline further, exacerbated by weakened soybean demand and competition from Brazilian suppliers. At the same time, the anticipated tariffs could raise costs for imported agricultural inputs, further squeezing U.S. producers. 

    The broader economic context offers mixed signals. Easing inflation and steady global GDP growth may support international demand for U.S. agricultural products. However, a strong dollar continues to challenge U.S. export competitiveness, particularly as other nations’ currencies depreciate. Another main contributor to the loss of competitiveness of U.S. agricultural products in the international arena is the increase of cost of production in recent years. In 2018, U.S. farmers spent a total of $354 billion on inputs, however, by 2023 farmers spent $481.9 billion, an increase of 36 percent.

    The long-term impact of the Trump administration’s trade policies remains to be seen, but the path forward will require balancing protectionist strategies with the need to maintain and grow critical trade relationships to support the agricultural sector.


    Schaefer, K. Aleks, and Luis Ribera. “2025 U.S. Agricultural Trade Outlook: Navigating Uncertainty Amid Policy Shifts.Southern Ag Today 5(2.4). January 9, 2025. Permalink

  • Confronting Legal Deserts in Rural America

    Confronting Legal Deserts in Rural America

    Unlike urban areas with a plethora of law offices and legal aid organizations, rural communities often lack the necessary infrastructure to provide essential legal support. This gap can leave individuals without the means to address crucial legal issues, ranging from family matters to property disputes. A “rural legal desert” refers to areas where residents face significant challenges in accessing legal services and representation. 

    We recently collected firm-level data from 2014-2021 from more than 350,000 law offices (Figure 1), together with socio-demographic data for 3,108 counties in the continental U.S., to statistically quantify the scope of the rural legal desert problem and shed light on potential solutions. Additionally, we examined the implications of limited rural legal representation on various societal factors, including rural poverty, economic development, and social equity. 

    Figure 1: Legal Employees Per 1,000 Individuals (2021)

    Notes: Figure shows the number of legal employees per 1,000 residents for each U.S. county as of calendar year 2021. Data underlying this figure are obtained from Data Axle (2022).
     

    Assessing the Problem: We found that—when evaluated on the basis of legal employees per capita—urban communities have approximately 150% greater access to legal services than those in rural areas (Figure 2). According to our data, Arkansas, Mississippi, and New Mexico are among the states where the problem is most severe. Worsening the situation, this trend is escalating over time: legal practices are becoming more concentrated in densely populated cities rather than being dispersed across both urban and rural areas.

    Figure 2: Access to Legal Services Across the Rural-Urban Continuum (2021)

    Notes: Figure shows the average (mean) number of legal employees per 1,000 residents for counties at each point along the USDA Rural-Urban Continuum Code. As shown in the Figure, the most urban U.S. counties have approximately 4.89 legal employees per 1,000 residents, whereas counties in the four most-rural categories have (respectively) 1.82, 2.36, 1.48, and 2.14 legal employees per 1,000 residents. Legal employee data for this figure are obtained from Data Axle (2022), and county Rural-Urban Continuum Codes are obtained from the USDA Atlas for Rural and Small-Town America.

    Even among rural communities, our analysis highlights a stark inequality with respect to legal access. We found that poorer rural communities have significantly less access to legal services than comparable rural areas with higher per capita incomes. Further, communities with larger shares of minority ethnic groups also experience statistically inferior coverage of legal services compared to areas with predominantly white, non-Hispanic populations. This social-inequality barrier to rural legal access is most substantial for Native and Black Americans, but also exists for Latinos.

    Bridging the Justice Gap: Our findings highlight the need for targeted policy interventions and innovative solutions to address the rural lawyer shortage. One policy intervention that appears to have been successful is Project Rural Practice (PRP) established by the South Dakota Legislature in 2013. The PRP program provides incentive payments to attorneys who commit to serving five continuous years of practice in an eligible rural county. This program improved legal representation in rural South Dakota, both relative to rural areas of Iowa and relative to urban areas of South Dakota evaluated over the same time period. 

    Final Thoughts: Recognizing the unique legal challenges faced by rural areas is a necessary step in the move towards a more equitable and inclusive justice system that ensures equal access to justice for all individuals, regardless of their geographic location.


    Schaefer, K. Aleks, and Andrew Van Leuven. “Confronting Legal Deserts in Rural America.” Southern Ag Today 4(8.5). February 23, 2024. Permalink

  • Expanded U.S.-Mexico Trade in Avocados Benefits U.S. Consumers

    Expanded U.S.-Mexico Trade in Avocados Benefits U.S. Consumers

    Approximately 90% of the avocados consumed in the U.S. are imported from Mexico. However, before last year, the U.S. only allowed the importation of avocados from one Mexican state—Michoacán—due to phytosanitary concerns about seed weevils and fruit flies. The Michoacán avocado industry is heavily controlled by the cartel, which has sometimes led to shaky trade relations with Mexico

    In late 2021, the U.S. Animal and Plant Health Inspection Service (APHIS) and the Association of Avocado Exporting Producers and Packers of Mexico (APEAM) reached an agreement to allow avocado imports from an additional Mexican state—Jalisco (see Figure 1). The first shipments of avocados from Jalisco entered the U.S. in August 2022. 

    This regulatory change is the focus of some of my current research with co-author Irvin Rojas at the Centro de Investigación y Docencia Económicas (CIDE) in Mexico City. We investigate the economic impacts of expanding this phytosanitary exclusion zone to include Jalisco on U.S.-Mexico avocado trade. We have also collected price information from 37 markets around Mexico to see the impacts of the policy change on local Mexican markets. 

    What did we find? 

    We find that this policy change was unequivocally beneficial from the perspective of U.S. avocado users and consumers. Authorization of avocado imports from Jalisco led to about a 10% reduction in the border price for Mexican avocados (see Figure 2), relative to what prices would have been had we continued to source only from Michoacán. The policy change also had a dramatic effect on U.S. access to Mexican avocados. The volume of avocado imports increased by almost 35% relative to a scenario in which the U.S. continued to source exclusively from Michoacán. In total, we estimate that the policy change leads to an economic welfare gain of approximately $229.5 million per year for U.S. avocado users and consumers. 

    Economic outcomes in the Mexican domestic market are slightly more nuanced. We find that—among the 37 markets studied—the policy led to a price increase for avocados sourced from Jalisco, but only for the range of avocados that were already being priced highest in the market. We did not detect a price impact for the “average” avocado sourced from Jalisco. Mexican domestic prices fell for avocados sourced from Michoacán. This result held across all ranges of avocado price tiers. 

    The trade and domestic market impacts we measure certainly change the incentive structure within (and outside) the Mexican avocado industry. Time will tell what these shifting incentives mean for cartel activity in Michoacán and Jalisco. 

    Figure 1: Location of Michoacán and Jalisco in Mexico

    Figure 2: Avocado Imports from Jalisco and U.S.-Mexico Trade Outcomes


    Schaefer, K. Aleks. “Expanded U.S.-Mexico Trade in Avocados Benefits U.S. Consumers.Southern Ag Today 3(14.4). April 4, 2023. Permalink

  • U.S. Agricultural Trade Deficit Projected for 2023

    U.S. Agricultural Trade Deficit Projected for 2023

    According to the USDA, U.S. agricultural exports are projected to decline by $2.5 billion from $196 billion in Fiscal Year (FY) 2022 (forecasted) to 193.5 billion in FY 2023. At the same time, agricultural imports are projected to expand by $5 billion from $192 billion in FY 2022 (forecasted) to $197 billion in FY 2023. The result is an agricultural trade deficit of $3.5 billion—the second largest deficit since 1990.

    The primary macroeconomic factors driving these trade relationships are the persistent strength of the U.S. dollar relative to other major currencies, like the Euro and the Yen, and the sluggish economic performance in many parts of the world. In the short-term, poor economic growth will likely be exacerbated as central banks around the world tighten monetary policy to fight rising inflation rates. Moreover, while global supply chain crises have gradually faded this year, freight and shipping costs remain heightened as a result of hefty energy prices driven by the ongoing Russian invasion of Ukraine. 

    Alongside these macroeconomic factors, the drop in U.S. agricultural exports is also the result of tight domestic supplies of cotton, beef, and sorghum. The largest trade losses are expected to be with major trading partners, including the European Union (EU), South Korea, and Egypt, each of whom is expected to lose approximately $300 million in trade. The projected increase in agricultural imports is primarily driven by grain and feed imports (up by $0.9 billion), as well as increased imports of horticultural products (up by $2.9 billion) and sugar and tropical products (up by $1.8 billion).  


    Schaefer, K. Aleks, and Luis Ribera. “U.S. Agricultural Trade Deficit Projected for 2023.Southern Ag Today 2(53.4). December 29, 2022. Permalink

  • The Economic Costs of Canadian Dairy Quota Restrictions Under USMCA

    The Economic Costs of Canadian Dairy Quota Restrictions Under USMCA

    Under the USMCA, Canada established tariff rate quotas (TRQs) for 13 categories of U.S. dairy products.[i] Up to the defined quota amount, these products were to receive tariff-free access to the Canadian market. However, last year, Canada reserved between 85 and 100% of the TRQs for many of the product categories exclusively for Canadian dairy processors. As a result, TRQs were substantially under-filled for many of the products (Figure 1a).[ii]

    In May 2021, the U.S. filed the first official grievance under the USMCA, claiming that Canadian dairy quota administration procedures were in violation of USMCA trade obligations. In a decision publicly released on January 4, 2022, the dispute settlement panel found that, “The current Canadian system, which sets aside significant TRQ volumes only for processors, does not pass muster under the Treaty.”[iii] Canada is now required to reach agreements with the U.S. on the allocations process or face retaliatory trade sanctions.

    In an upcoming working paper, Chris Wolf and I calculate the economic costs of these Canadian dairy quota restrictions for the U.S. dairy industry. We find that the effective trade barrier created by Canadian quota allocation practices was as much as 71% to 94% more restrictive than the negotiated quota for some products.

    Figure 2 plots the total TRQ value versus actual imports under USMCA holding current prices and quota fill rates constant. The administrative trade barrier created by Canada dairy quota allocation practices equates to approximately $1.27B in lost trade, or 67% of the total TRQ value, between now and 2030. 

    Figure 1: USMCA Dairy Quota Fill Rates (2021)

    Figure 2: Total TRQ Value versus Actual Imports


    [i] Canadian Dairy Quotas are defined in Chapter 2 “National Treatment and Market Access” of the United States-Mexico-Canada Agreement (USMCA). 

    [ii] Data for this figure are obtained from the Canadian Government Supply-Managed Tariff Rate Quota Utilization Tables (https://www.international.gc.ca/trade-commerce/controls-controles/supply_managed-gestion_offre.aspx?lang=eng&type=Utilization%20Tables#data)

    [iii] USMCA Arbitral Panel (2021). Final Report. Canada – Dairy TRQ Allocation Measures (CDA-USA-2021-31-010). 

    Schaefer, K. Aleks. “The Economic Costs of Canadian Dairy Quota Restrictions under USMCA“. Southern Ag Today 2(25.4). June 16, 2022. Permalink