The January Cattle on Feed report was released on Friday afternoon. Total on-feed inventory to start the year was estimated at a little over 11.8 million head, which is down by just under 1% from January of 2024. Even though feeder cattle supplies have been lower, feedlot inventories ran above year-ago levels for eight of twelve months in 2024 as lower feed prices encouraged longer feeding times. While I don’t want to read too much into it, this was the largest year-over-year decline since May.
Placements were once again the headliner of the report as they came in below, and outside the range of pre-report estimates. December 2024 placements were estimated at 1.64 million, which was 3.3% below December 2023. On the surface, this seemed logical as December represented a full month of not receiving live cattle imports from Mexico. This also marked the second month in a row with placement levels being more than 3% below year-ago.
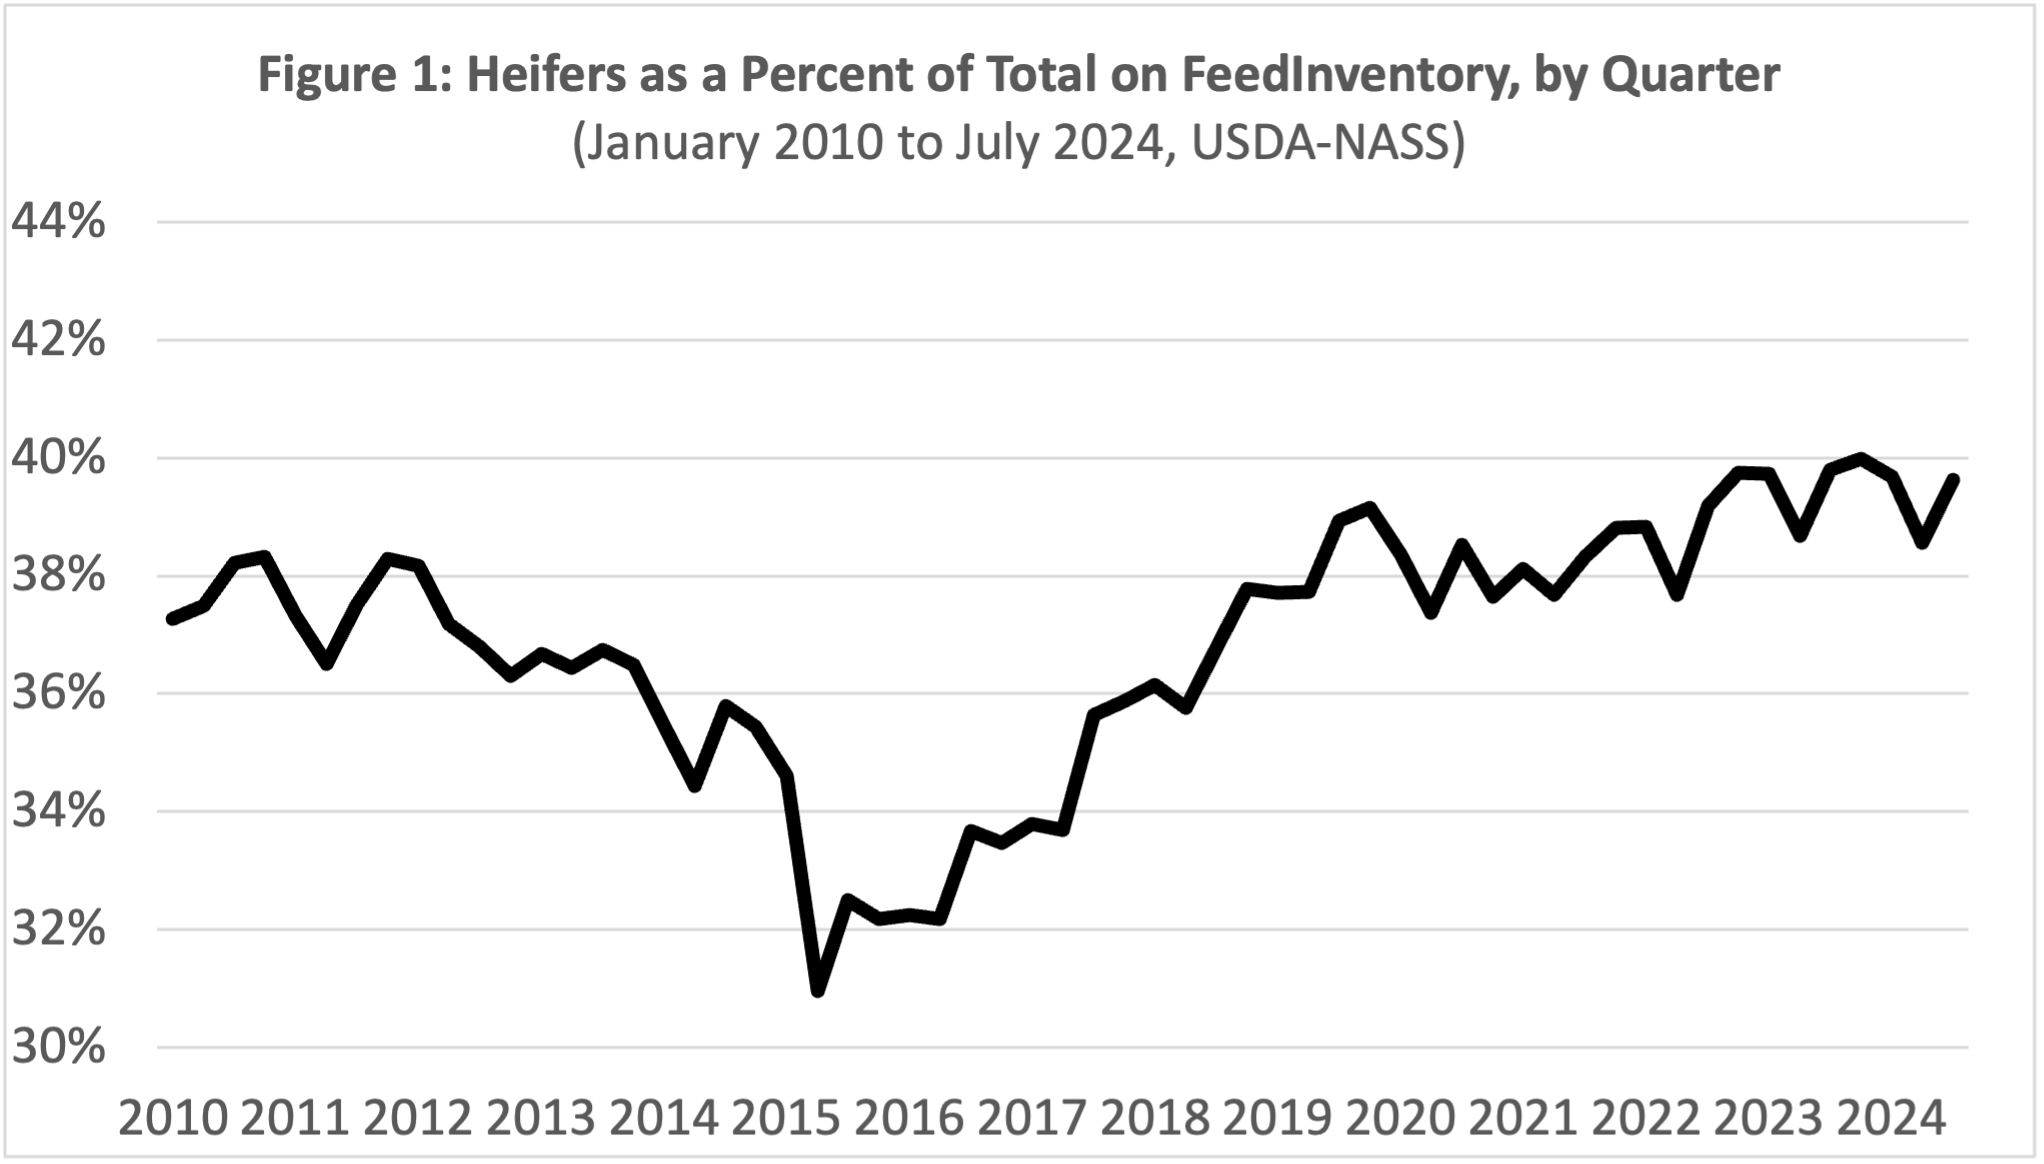
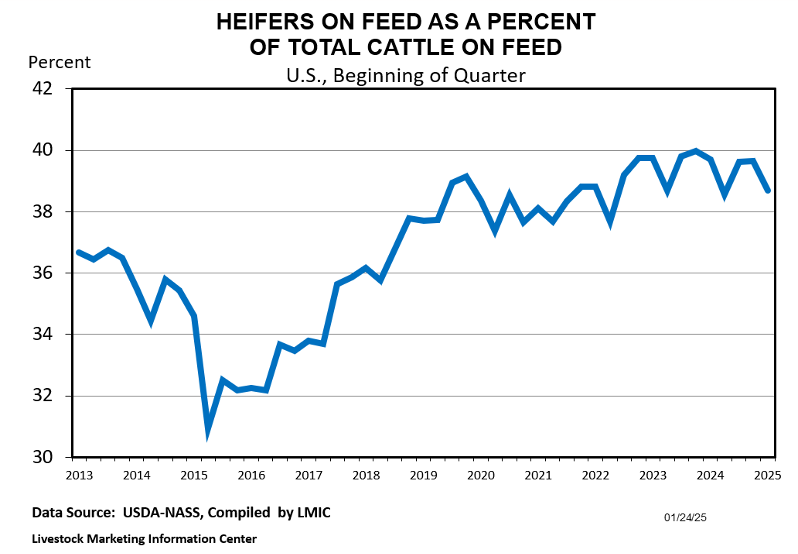
Friday’s report was also a quarterly cattle-on-feed report, which means it included an estimate of the steer/heifer breakdown. In the absence of a July cattle inventory report, this has been one of the main indicators economists have been tracking for evidence of heifer retention. Heifers accounted for 38.7% of the total on-feed inventory on January 1, 2025. While this doesn’t speak to retention, it is worth noting that this is about 1% lower than last January and 1% lower than October 2024. So, it does bear watching as we move further into 2025. Again, I think imports from Mexico had some impact here as heifers had represented a higher than usual share of imports prior to the ban in late November.
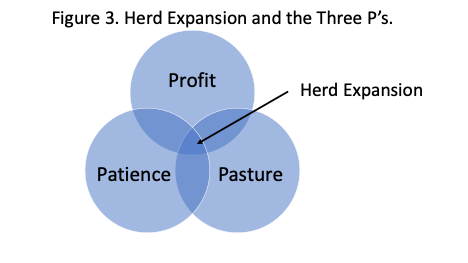
Last week’s cattle on feed report will be overshadowed later this week as USDA-NASS will release their annual inventory estimates on the afternoon of January 31st. While beef cow slaughter was down sharply for 2024, most are still expecting continued decreases in beef cattle numbers at the national level. It will be interesting to see the state-by-state numbers and specifically to look at areas where heifer retention may have already begun. Given the favorable price outlook for calves, I think heifer retention is very possible in 2025 if weather is cooperative. But I also think this will be a relatively slow cow-herd expansion once retention does begin.


Burdine, Kenny. “Placements Lower Than Expected in January Cattle-On-Feed Report.” Southern Ag Today 5(5.2). January 28, 2025. Permalink