Author: Kevin Kim

  • 2026 Mid-Year Farm Financial Condition Update

    2026 Mid-Year Farm Financial Condition Update

    2026 Mid-Year Farm Financial Condition Update

    Entering the second half of 2026, a new farm financial snapshot points to the continued financial challenges facing Southern agriculture, particularly among crop producers. The findings are based on a semi-annual survey conducted by the Mississippi State University Extension. Survey respondents included producers, professional farm managers, land appraisers, commercial bankers, Farm Credit System lenders, and USDA Farm Service Agency personnel operating in Mississippi, Arkansas, Louisiana, Tennessee, and neighboring states. 

    Figure 1: Agricultural Financial Indicators 

    Source: 2026 Mid-Year MSU Agricultural Credit & Farmland Survey. Data compiled and analyzed by the author.

    As shown in Figure 1, overall farm income remained weaker than during the same period last year. Approximately 46% of respondents reported lower farm income in their region, while 31% indicated that farm income was about the same as in the same period of 2025. Survey comments suggested that significantly higher fuel prices have further increased production costs. Consistent with these responses, the USDA Economic Research Service’s May 2026 Farm Income Forecast projects that lower cash receipts, combined with higher production costs, will place additional downward pressure on farm profitability. Only about 23% of respondents reported higher farm income in their region.

    Crop producers’ liquidity and solvency worsened again in 2026. 73% of respondents reported worsening liquidity and solvency for crop producers, while less than 10% of respondents reported improvements in these financial health measures. Several respondents noted that consecutive years of weak crop returns have substantially eroded producers’ financial positions. In contrast, livestock producers continued to experience improving liquidity and solvency for a second consecutive survey period, largely supported by stronger cattle prices.

    Figure 2: Agricultural Credit Conditions

    Source: 2026 Mid-Year MSU Agricultural Credit & Farmland Survey. Data compiled and analyzed by the author. 

    The survey also collected agricultural loan interest rates from a range of lenders, including commercial banks, the Farm Credit System, and insurance companies. Average interest rates for operating, intermediate-term, and farmland loans all remained around 7.5%, generally consistent with rates reported in the Federal Reserve Bank of Dallas’s quarterly agricultural credit survey. Interest rates were modestly higher than those reported in the survey conducted six months earlier.

    Agricultural credit conditions also weakened slightly during the first half of 2026. As shown in Figure 2, more than half of lenders reported that loan demand remained at about the same level as last year, while 33% of respondents reported lower loan demand. Respondents attributed the slight increase in loan demand observed in some regions to producers experiencing lower farm income. At the same time, most respondents indicated that loan repayment rates and loan renewals remained about the same as last year. However, among those reporting a change, more respondents reported worsening rather than improving conditions, suggesting growing cash flow stress among borrowers and increasing financial pressure across the region.

    Figure 3: Agricultural Land Value Expectation

    Source: 2026 Mid-Year MSU Agricultural Credit & Farmland Survey. Data compiled and analyzed by the author. 

    Despite increasing financial pressure on crop producers, farmland values remained resilient. Both cropland and pastureland values increased in 2026 compared to 2025. When asked about farmland value expectations for the next six months, respondents generally expected cropland and pastureland values to either remain stable or increase, as shown in Figure 3. While 18% and 9% of respondents expected increases in irrigated and non-irrigated cropland values, respectively, 44% anticipated another increase in pastureland values over the next six months. Survey comments suggest that continued demand from non-agricultural investors and alternative land uses has helped support farmland prices despite weaker farm profitability.

    Overall, although farmland values have remained strong, declining crop returns and rising production costs continue to place significant financial pressure on producers. Many respondents expressed frustration and concern about the deteriorating liquidity of crop operations, with several describing the first half of 2026 as one of the most challenging financial periods in recent years. Many emphasized the need for greater attention from policymakers to address the financial challenges facing the agricultural sector.


    Recommended citation format: Kim, Kevin. “2026 Mid-Year Farm Financial Condition Update.” Southern Ag Today 6(37.1). September 7, 2026. Permalink

  • 2026 Agricultural Credit and Farmland Conditions Update

    2026 Agricultural Credit and Farmland Conditions Update

    Authors Kevin Kim and Brian Mills

    According to the latest forecast from USDA ERS, net farm income in 2026 is expected to decline modestly, even after factoring in substantial government payments. If realized, this would represent several consecutive years of compressed profitability, particularly for row crop producers. In this context, what do current indicators reveal about emerging farm financial stress?

    A recent survey conducted by Mississippi State University Extension offers additional insight into agricultural credit conditions in Mississippi and Alabama. Because these states are not included in the agricultural credit surveys published by the Federal Reserve Banks of Dallas or Kansas City, this regional data provides a valuable perspective. The survey gathered responses from commercial banks, Farm Credit System institutions, agricultural consulting firms, and insurance companies operating across the region.

    Source: 2025 Mississippi State University Agricultural Credit Survey

    Farm loan repayment performance worsened in 2025, with none of the respondents reporting that the loan repayment rates had improved when compared to the previous year. Farm loan renewals generally showed signs of stability to modest softening relative to 2024. Compared to the most recent agricultural surveys conducted by the Federal Reserve Banks of Dallas and Kansas City, there were more respondents who answered that the loan repayment rates were worse than the year before. 

    Source: 2025 Mississippi State University Agricultural Credit Survey

    Liquidity and solvency measures provide indicators of short- and long-term financial stress. Several respondents reported that liquidity and solvency positions for crop producers weakened in 2025 relative to the previous year, whereas livestock producers were more often characterized as stable or slightly improved. These differences reflect the commodity-specific price trends observed over the past year.

    Source: 2025 Mississippi State University Agricultural Credit Survey

    Despite lower crop receipts, farmland values remain resilient. Most respondents reported that irrigated and non-irrigated cropland values either increased or held steady in 2025 relative to 2024, and there was no reporting of decreased cropland value. Expectations for the next six months are largely neutral to slightly positive despite the expected low price outlook in 2026. Pasture values followed a similar pattern.

    Overall, the newly conducted survey shows that the agricultural credit environment reflects tighter margins and growing financial stress, but not widespread financial disaster. Continued monitoring of repayment trends, working capital positions, and interest rate movements will be essential as producers and lenders navigate the production cycle.


    Kim, Kevin, and Brian Mills. “2026 Agricultural Credit and Farmland Conditions Update.Southern Ag Today 6(10.1). March 2, 2026. Permalink

  • Who’s Buying Farmland? A Look at Mississippi’s Agricultural Land Market

    Who’s Buying Farmland? A Look at Mississippi’s Agricultural Land Market

    Farmland is one of the most important assets for agricultural producers, serving as both a source of income and a foundation for their livelihood. With continued strong demand for agricultural land, farmland values in the Southern U.S. have steadily increased over time. According to the USDA Economic Research Service, the compound annual growth rate of farmland values between 2018 and 2024 was around 5 percent. 

    However, in recent years, there has been growing discussion that demand for farmland isn’t coming solely from producers. From media reports and even casual conversations with neighbors, we often hear about billionaires purchasing large tracts of farmland or significant parcels being sold to developers. Yet despite these stories and the concerns they raise, there is little concrete information about how frequently non-producer buyers are participating in the farmland market. This leads us to an important question: How active are non-agricultural buyers in today’s agricultural land market?

    Using transaction-level data from lending institutions in Mississippi covering the period from 2019 through the first half of 2023, we can begin to understand the different types of buyers in the agricultural land market. Buyers are categorized into four groups: (1) individuals and general partnerships (GPs), likely involved in agricultural production; (2) financial and real estate businesses; (3) non-individual/non-GP agricultural businesses; and (4) other industries. Other than the first group (individuals and GPs), the rest are limited partnerships, limited liability companies, and corporations, and they are grouped based on the North American Industry Classification System (NAICS) codes. 

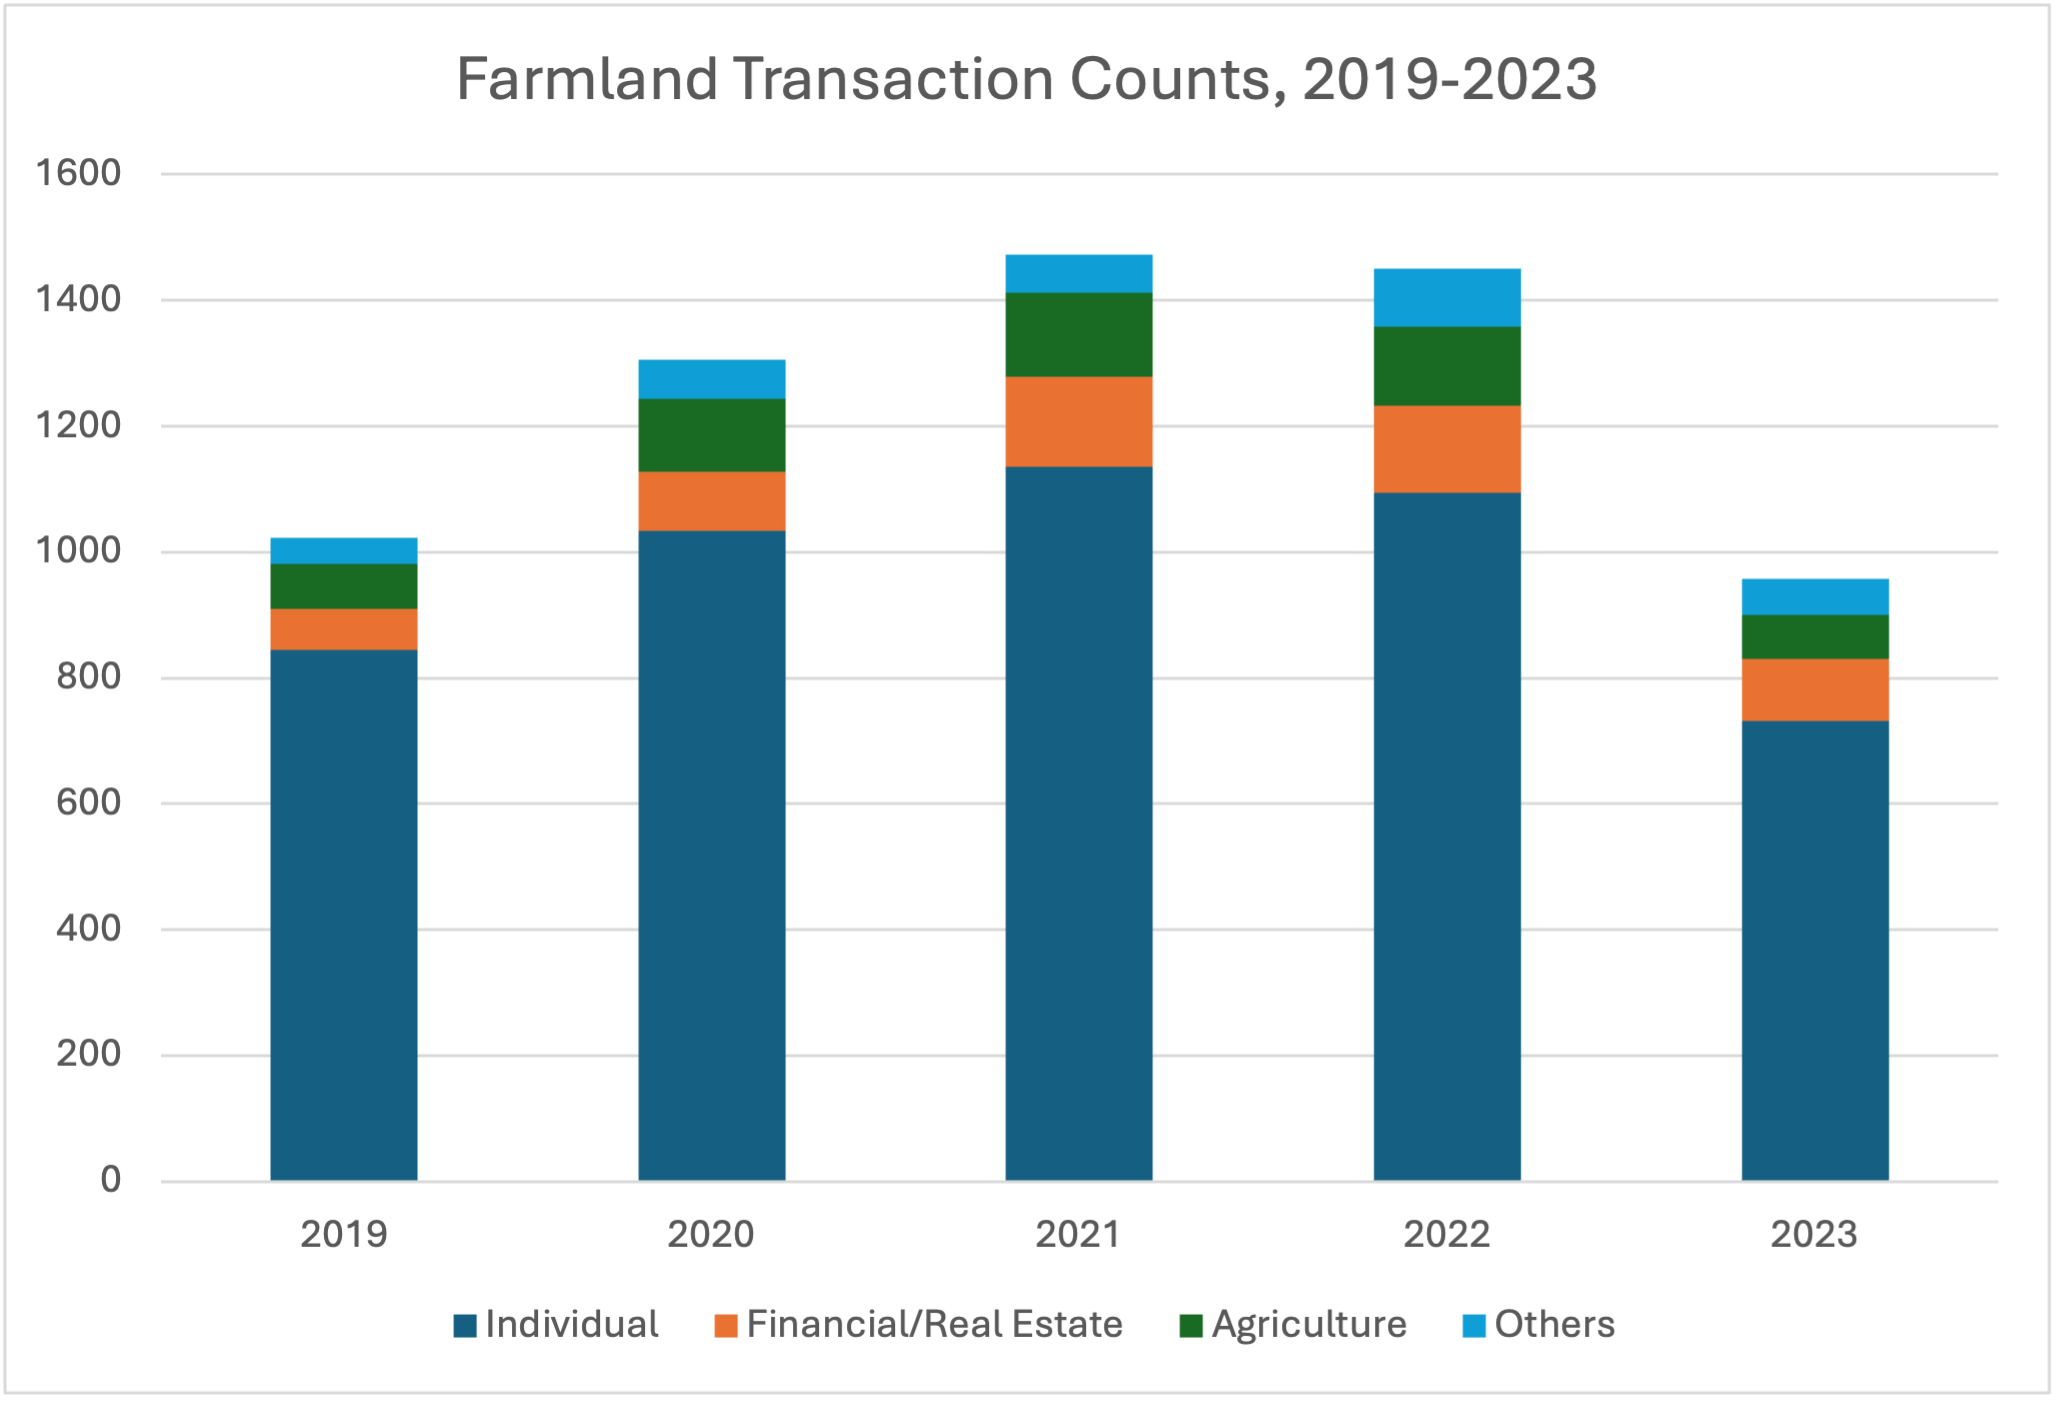
    Figure 1: Number of Agricultural Land Transactions by Buyer Type

    Figure 1 shows the number of farmland transactions completed by four groups between 2019 and the first half of 2023: (1) individuals and general partnerships (GPs), (2) financial and real estate businesses, (3) non-individual/non-GP agricultural businesses, and (4) all other business entities.

    What we find is that the majority of farmland transactions in Mississippi are predominantly carried out by individuals and GPs. Between 75% and 83% of all transactions during this period involved buyers from this group. The presence of financial and real estate businesses in the market has grown over time, even though their overall share still remains somewhat small. Their share of total farmland transactions ranges between 6.36% in 2019 and 10.42% in the first half of 2023—surpassing the share of non-individual/non-GP agricultural businesses, which ranged from 7% to 9% during the same period. The final group—comprised of other businesses such as those in construction, warehousing, and unrelated industries—accounted for approximately 4% to 6% of total transactions.

    In summary, individuals and general partnerships (GPs) remain the most active participants in the farmland market in terms of transaction frequency. However, there is an increase in the number of non-individual/non-GP buyers, particularly financial and real estate developers. While this external demand may help support farmland values, it can also contribute to upward pressure on land prices—bringing both potential benefits and challenges for agricultural producers. Moreover, this shift in ownership patterns coincides with a long-term decline in U.S. farmland acreage, but identifying the actual relationship will require more rigorous examination. As the farmland market continues to evolve, understanding who is buying agricultural land—and why—becomes increasingly important. Continued monitoring of buyer trends can help inform policy discussions, land use planning, and long-term strategies.


    Kim, Kevin, Hudu Abukari, Ayoung Kim, and Brian E. Mills. “Who’s Buying Farmland? A Look at Mississippi’s Agricultural Land Market.Southern Ag Today 5(31.1). July 28, 2025. Permalink

  • 2024 Agricultural Lending Condition Update

    2024 Agricultural Lending Condition Update

    According to the most recent estimates from the USDA ERS, the US agricultural sector is projected to experience a significant decline in profitability. Overall, current estimates indicate that net farm income in 2024 will be 6.8% lower than in 2023, a year that already saw a substantial drop compared to 2022. Expected cash receipts are anticipated to decline most sharply for corn, soybean, and cotton producers, with decreases ranging from 14% to 22% relative to last year. This suggests that some commodity producers will face increased financial pressure for the remainder of 2024 and possibly into early 2025.

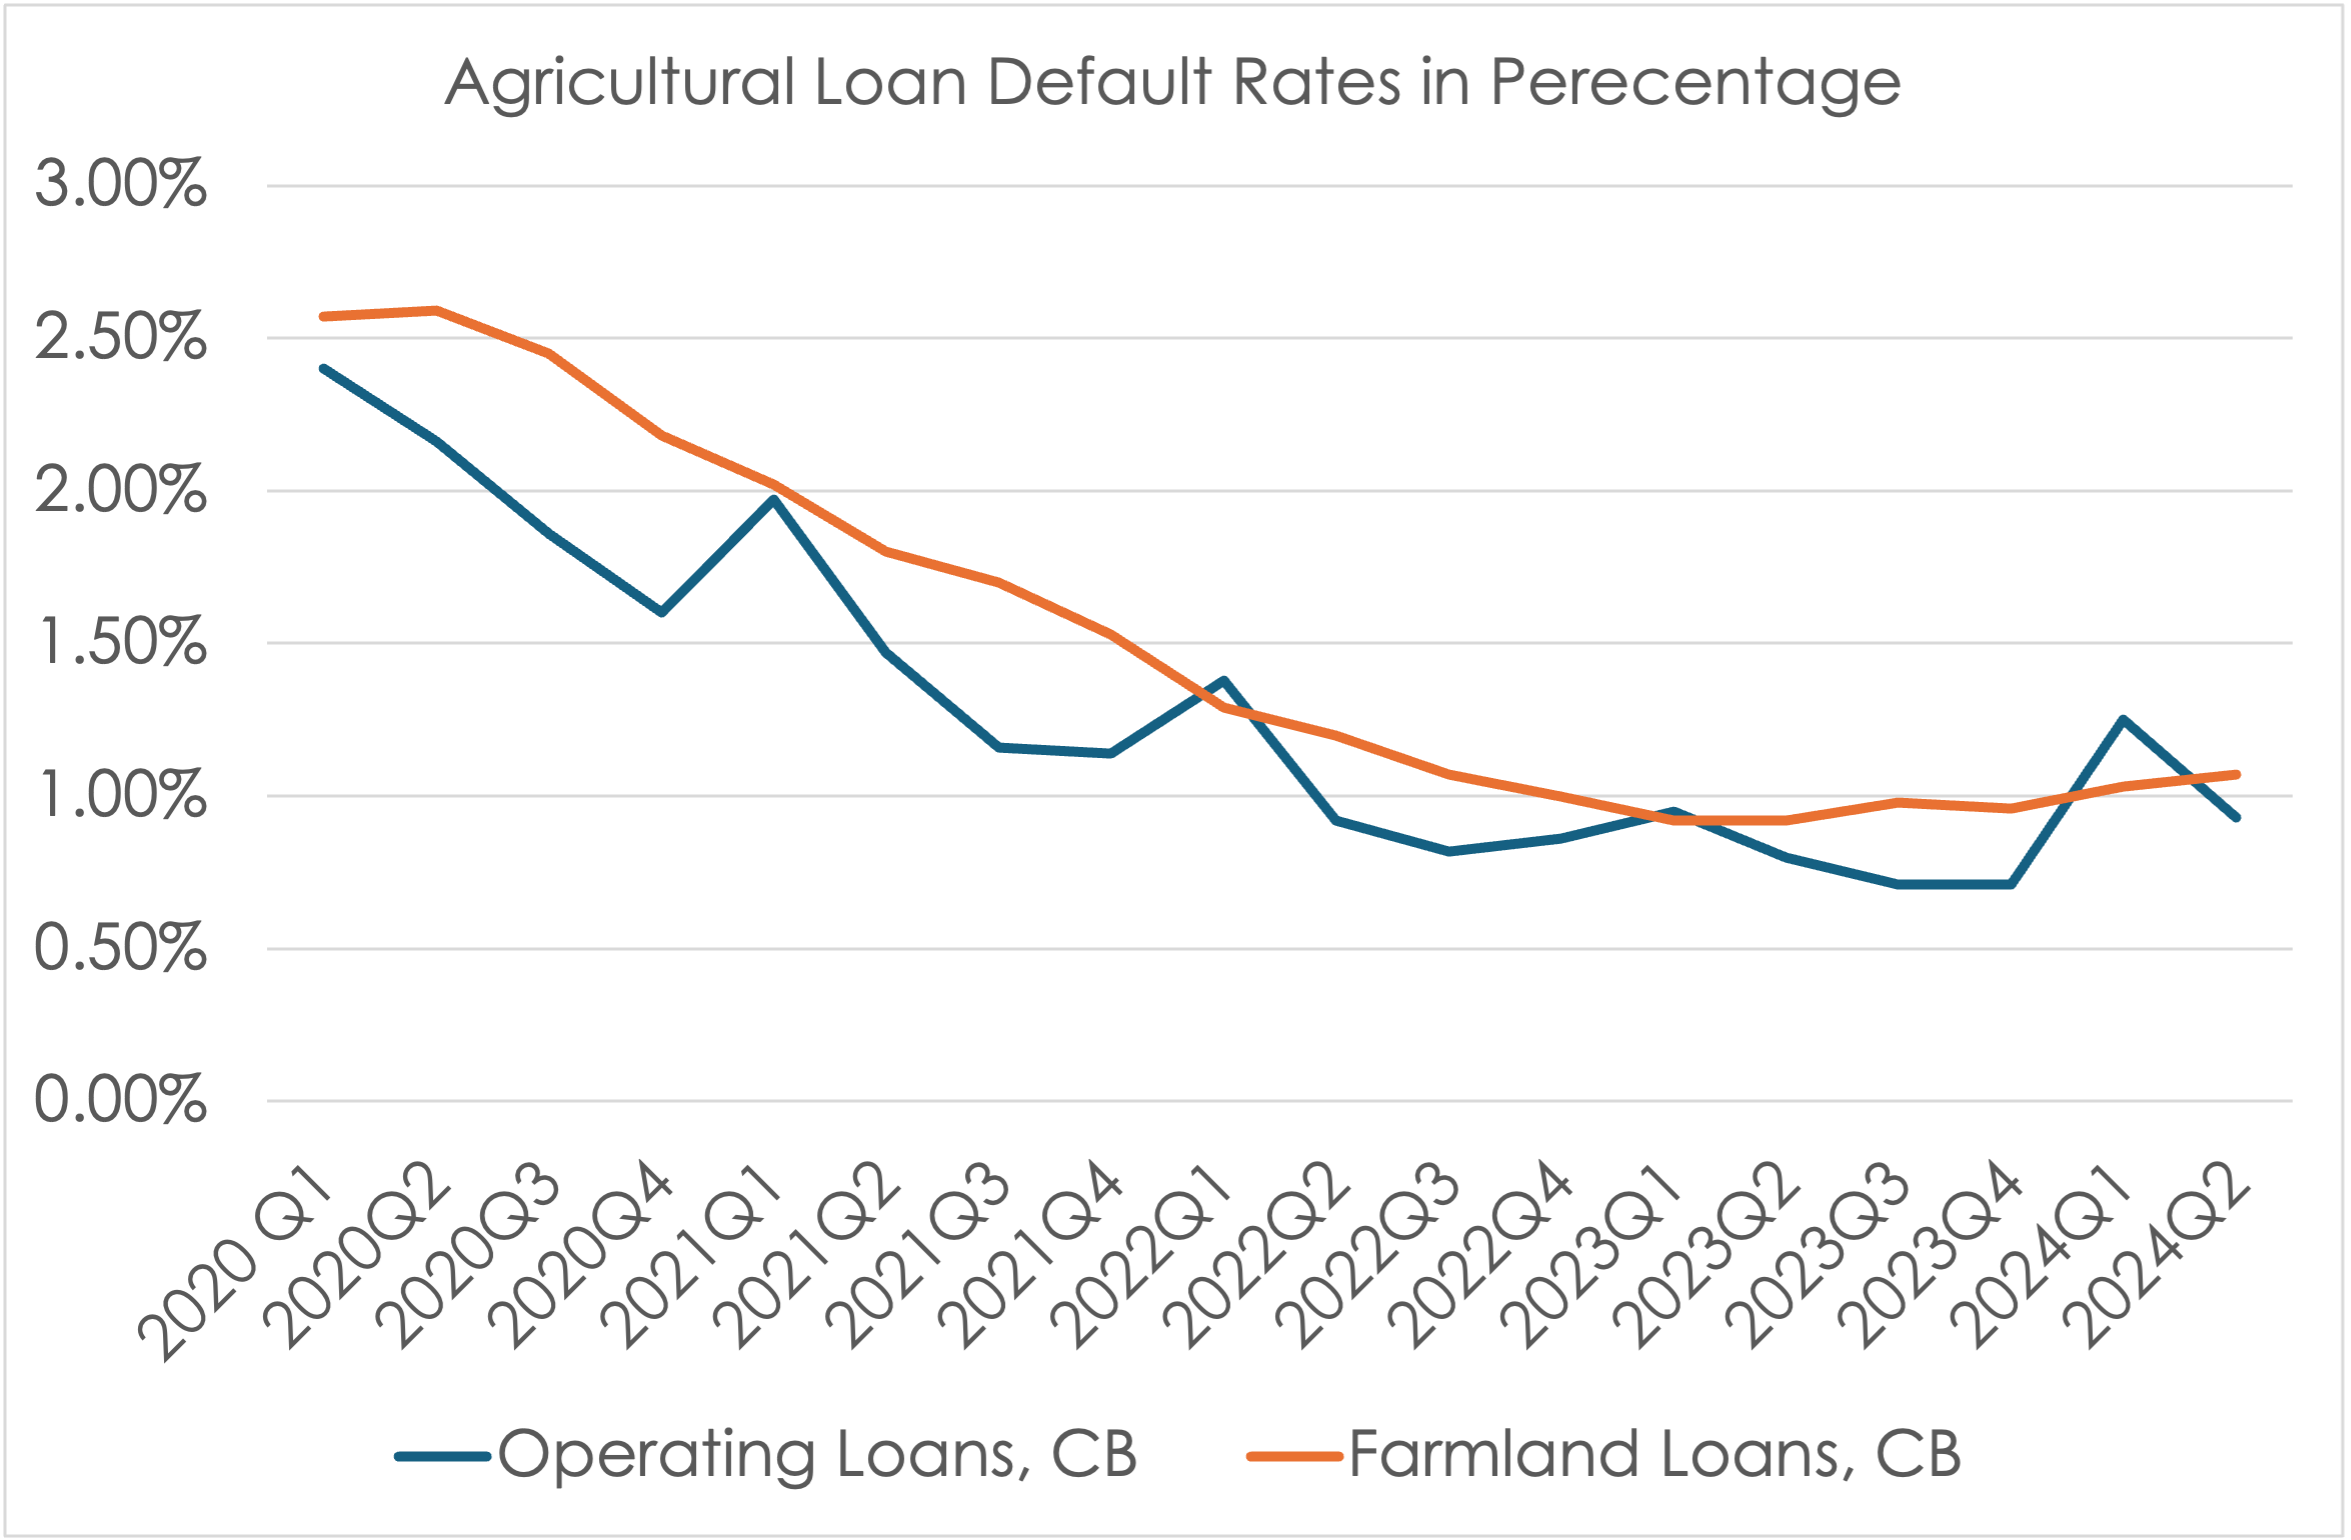
    A recent survey of agricultural bankers supports this observation, indicating rising financial stress among agricultural producers. The Agricultural Credit Survey conducted by the Kansas City Fed reveals that more agricultural lenders are receiving requests for loan renewals and extensions, a sign that producers are struggling to meet loan interest and principal payments. However, beyond these requests, there is currently no clear evidence that financial pressures are translating into widespread farm financial distress. According to the Federal Reserve Economic Data (FRED), default rates on agricultural production loans and farmland loans have not shown significant increases in the latest survey.

    Source: FRED

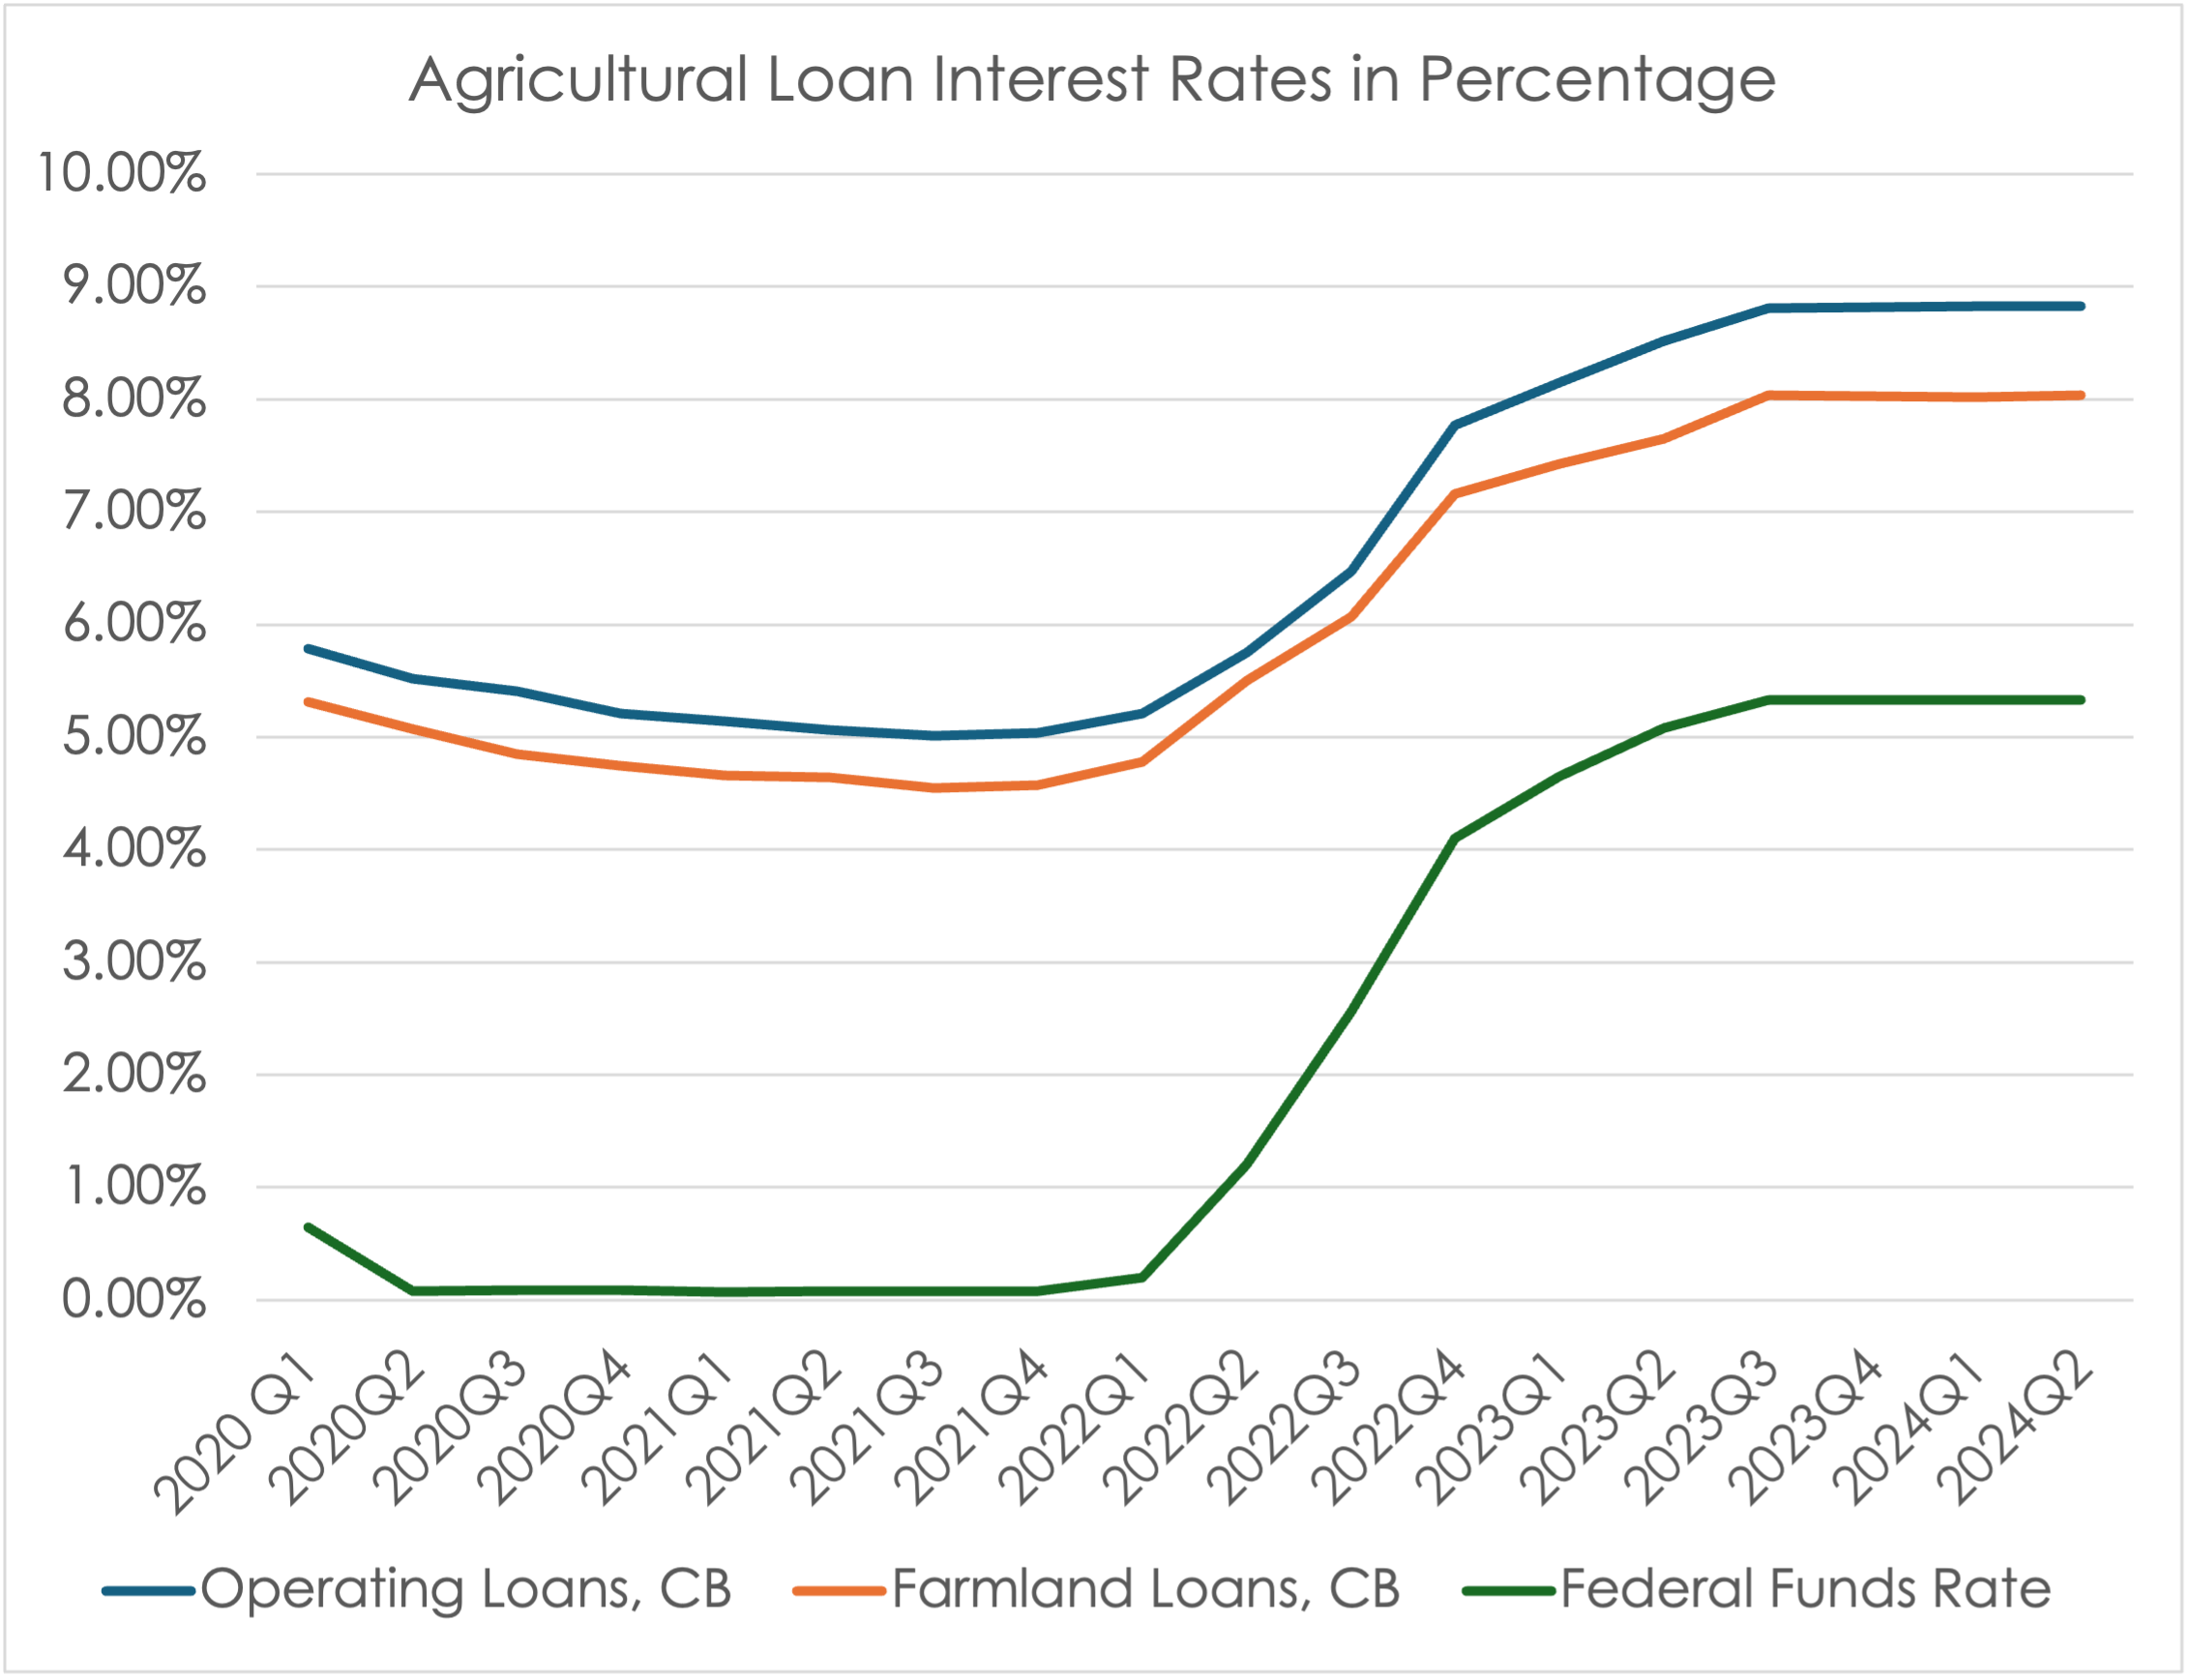
    One contributing factor to the pressure felt by both agricultural producers and consumers is the rise in interest rates. Compared to the rates offered from 2020 to 2022, interest rates on farm production loans and farmland loans have increased sharply following a series of rate hikes by the Federal Reserve (the Fed) aimed at curbing rapidly rising inflation. As the Fed raised the federal funds rate—used as a benchmark for determining consumer loan interest rates—farm loan interest rates also rose, leading to greater pressure on repayment schedules. In the most recent survey of bankers in the Kansas City Federal district, the average farm production loan interest rate was 8.83%, and the farmland loan interest rate was 8.04%. In the same quarter of 2021, these rates were about 5.04% and 4.57% respectively. While 2020 or 2021 rates were very favorable rates in comparison to the long-term average, rapidly increasing interest rates in such a short period of time in 2022 could have put extra financial pressure on some producers who were not prepared for such rapid change.

    Source: Kansas City Fed, FRED

    However, as observed in September 2024, multiple reductions in interest rates are expected in the coming months and years. The Fed aims to lower the federal funds rate to 3.5% by the end of 2025 and to 3% by the end of 2026. Given that the pace of these rate reductions is expected to be slower than the hikes experienced in 2022 and 2023, the anticipated decreases in farm loan interest rates are also likely to be gradual.


    Kim, Kevin. “2024 Agricultural Lending Condition Update.Southern Ag Today 4(43.1). October 21, 2024. Permalink

  • Farmland Value Trends in South

    Farmland Value Trends in South

    Farmland value represents the most important component of an agricultural producer’s net worth and asset value, accounting for more than 80% of the average farm balance sheet, according to a USDA survey. Therefore, monitoring farmland value per acre is crucial, as it affects farmers’ and ranchers’ ability to secure additional funding from lending institutions, given that these lands are used as collateral.

    Farmland Value Increase in the Short-Term

    In the last couple of years, despite interest rate hikes that have increased the cost of funding for farmland purchases, the demand for agricultural land and farm profitability have remained strong. Strong demand, coupled with a limited supply of agricultural land, average agricultural land prices soared by 7.7% in 2023, according to the USDA.

    Recent record-high farmland value increases in the Corn Belt region have sparked discussions about the seemingly slower increase in the southern region. While it is true that some Corn Belt states experienced 30% to 40% increases in farmland values over the past couple of years, examinations of broader regional changes and long-term trends present a different picture.

    Source: USDA NASS

    According to the USDA, since 2021, cropland values in the Southeast (Alabama, Florida, Georgia, South Carolina) and the Southern Plains (Texas and Oklahoma) have increased by 20% and 22%, respectively, making these increases comparable to those in the Corn Belt states (22%). Delta states (Arkansas, Louisiana, and Mississippi) experienced a 12% increase, falling short of other regions. Increases in pastureland values were more consistent across regions. Delta and Southeast states saw increases of 12% and 13% in pastureland values, similar to the 14% increase in the Corn Belt states. In the Southern Plains, pastureland values soared in 2023, reaching a 20% increase.

    Source: USDA NASS

    Farmland Value Increase in the Long-Term

    While some southern states may seem to lag behind in growth rates in the short term, long-term trends show robust growth for these states. Between 2014 and 2023, the Southern Plains states experienced the highest increase in cropland value (50%), while the Southeast and Delta states each saw a 40% increase. Cropland values in the Corn Belt states increased by 18% during the same period. Looking at pastureland, the dollar value per acre in the Delta states increased by 39%, followed by the Southern Plains (34%) and the Southeast (30%). Pastureland value in Corn Belt increased by 22% for the same period.

    Moving Forward

    While it is true that farmland value increases have been sluggish for some states in the South, production specialties and long-term trends should not be overlooked.

    For 2024, it is generally expected that farm profitability will decrease, especially for crop producers, adding downward pressure on cropland values along with high farmland loan interest rates. However, due to the limited supply of farmland and strong demand for agricultural land, it is expected that farmland values will remain steady or experience a slight increase.


    Kim, Kevin. “Farmland Value Trends in South.Southern Ag Today 4(24.3). June 12, 2024. Permalink