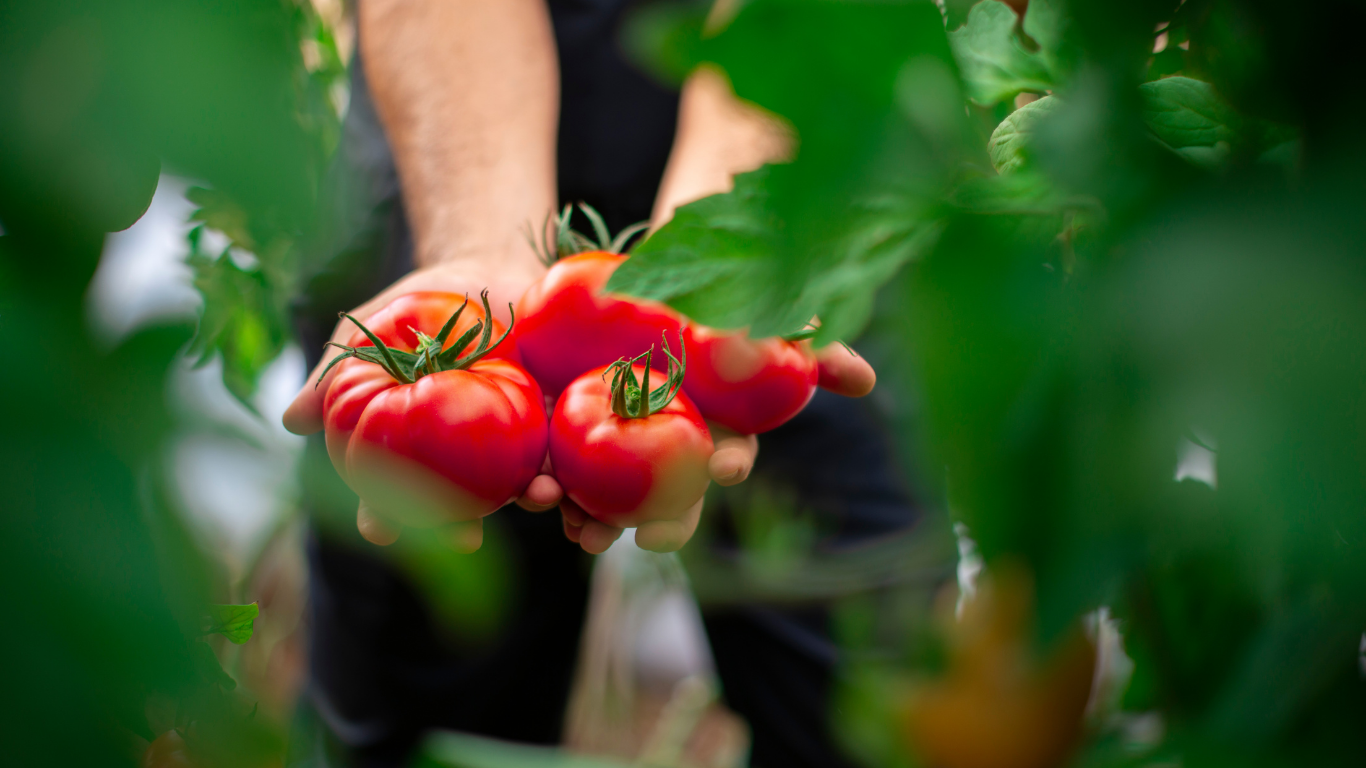
Growers in Florida and California, where the majority of fresh tomatoes are grown in the U.S., continue to lose market share to Mexico (due in part to relatively higher U.S. farm labor wages and overlapping seasonal production) and Canada (greenhouse production), resulting in reduced numbers and consolidation among Florida’s growers (Fig. 1). Over the past two decades, shipping point prices reported by the USDA Agricultural Marketing Service are trending upward. Input prices are on the rise since 2020 due to global shocks such as the COVID-19 pandemic and Russia-Ukraine conflict, resulting in record high prices for phosphorus, nitrogen, potash, cardboard boxes and wooden pallets, and irrigation supplies. Truck driver shortages remain the biggest challenge in distribution logistics, driven mainly by too few drivers and rising fuel costs.
Figure 1. Fresh tomatoes (field and hothouse): Supply and use, 1960 – 2020 (USDA-ERS)

Fresh produce consumption trends are affected by food prices, food safety, and dietary concerns. In a survey of Southeastern U.S. tomato buyers, fresh produce consumers reported they are more concerned about the safety of U.S. foods relative to U.S. food price trends (Maples et al., 2018). Also, people are searching for food relationships in response to diet-related disease incidences in themselves and their family members (Thapaliya et al., 2017). Since 1996 (just after Canada, Mexico, and the U.S. signed the North American Free Trade Act), per capita availability of fresh tomatoes (field and greenhouse, domestic and imported sources) hovered between 16-17 pounds a year, up from about 11 lbs. per person in 1960.
The 2015–2020 Dietary Guidelines for American recommends an average adult may consume 2,000 calories per day, and suggest a well-balanced diet include two cups of fruit and 2.5 cups of vegetables. USDA food consumption surveys find that the average American falls far short, consuming only 0.9 (45% of recommended volumes) cups of fruit and 1.4 (56%) cups of vegetables per day. Are veggies really cost-prohibitive? Using the average vegetable price of $0.80 per cup and multiplying by the recommended 2.5 cups per day for a healthy diet, the cost of including vegetables in a healthy diet to equals $2.00 per day, about 20 percent of the average daily food cost of approximately $10 per person. Recently, the Bureau of Labor Statistics consumer price index (CPI) revealed that people are paying prices that are nearly double since 2000.
There is a need for improved understanding of the roles and dynamic interactions among fresh produce supply chain participants to improve industry coordination and competitiveness, expand U.S. market demand, and build in supply chain resiliency.
Reference
Maples, M.C.*, M.G. Interis, K.L. Morgan, and A. Harri. 2018. Consumer Willingness to Pay for Environmental Production Attributes of Fresh Tomatoes. Journal of Agricultural and Applied Economics 50(1): 1-21.
Stewart, H., and J. Hyman. August 2019. Fruit and Vegetable Prices. U.S. Department of Agriculture, Economic Research Service. Link: https://www.ers.usda.gov/data-products/fruit-and-vegetable-prices/
Thapaliya, S.*, M.G. Interis, A. Collart, L. Walters, and K.L. Morgan. 2017. Are Consumer Health Concerns Influencing Direct-from-Producer Purchasing Decisions? Journal of Agricultural and Applied Economics 49(2): 211-231.
U.S. Department of Agriculture and U.S. Department of Health and Human Services. December 2020. Dietary Guidelines for Americans, 2020-2025. 9th Edition. Link: DietaryGuidelines.gov
U.S. Department of Agriculture, Economic Research Service. 1 April 2020. Based on data from various sources as documented on the Food Availability Data System home page. Link: USDA ERS – Food Availability (Per Capita) Data System
U.S. Bureau of Labor Statistics. 2 August 2022. Consumer Price Index. Link: USDA ERS – Food Availability (Per Capita) Data System

Author: Kimberly L. Morgan
Associate Professor
Author: Xiuri Cui
Ph. D Candidate
Author: Zhengfei Guan
Assistant Professor
Morgan, Kimberly L., Xiuri Cui, and Zhengfei Guan. “Fresh Tomato Supply Chain: Challenges in Production & Markets.” Southern Ag Today 2(46.5). November 11, 2022. Permalink


