Author: Landyn Young

  • USITC Maintains Anti-Dumping Order on Fresh Mushrooms

    USITC Maintains Anti-Dumping Order on Fresh Mushrooms

    Authors: Landyn Young and Luis A. Ribera

    On July 7th, the U.S. International Trade Commission (USITC) chose to leave in place anti-dumping policies for imports of preserved mushrooms from Chile, China, India, and Indonesia (Andberg, 2026). The initial ruling took place in December 1998. Dumping occurs when a producer sells their products at a lower price internationally than they do in their home country or below their production costs. A week after the ruling for preserved mushrooms was continued, on July 14th, it was announced that a preliminary determination had been reached regarding dumping of fresh mushrooms in the U.S. market from Canada (Federal Register, 2026). The USITC implemented an 8.26% preliminary antidumping tariff on most fresh mushrooms from Canada, following a separate 2.84% countervailing duty for alleged unfair subsidies. In 2025, the United States imported 91.2 thousand metric tons (TMT) of mushrooms, valued at $416.9 million. Based on imports from Canada in 2025, it is estimated that 81 percent of fresh mushroom imports could face antidumping tariffs, with Agaricus mushroom imports being 92 percent.

    Since 2019, between 96 and 98 percent of U.S. grown mushrooms were the Agaricus variety, which is primarily grown in Pennsylvania and California. Around 69 percent of total production of Agaricus mushrooms occurred in these two states in 2025, or 205 thousand metric tons (TMT) of the 304 TMT grown nationwide. The remaining 31 percent is spread throughout the United States.

    In 2025, 91.2 TMT of mushrooms were imported, with 79.2 TMT being Agaricus; the other 12 TMT were other varieties. By far the largest exporter of fresh mushrooms to the United States was Canada, which sent an estimated 74.2 TMT of mushrooms to the United States worth $345 million. It is estimated that imports accounted for as much as 23 percent of all fresh mushrooms available in the United States in 2025, up from 16.8 percent in 2019.  On the other hand, exports have dropped considerably since 2020, while consumption has remained relatively steady. With production on the decline and the reliance on imports rising, this could negatively impact prices for consumers of fresh mushrooms but may also be a windfall for mushroom growers in the United States trying to stay competitive.

    Volume of U.S. Mushroom Imports, 2011 – June 2026

    Source: Global Agricultural Trading System (GATS), USDA/FAS

    Volume of U.S. Mushroom Exports, 2011 – June 2026

    Source: Global Agricultural Trading System (GATS), USDA/FAS

    Share of U.S. Mushroom Consumption from Imports, 2019 – 2025

    Source: Global Agricultural Trading System (GATS), USDA/FAS

    Sources:

    Andberg, Jennifer. United States International Trade Commission. “USITC Makes Determinations in Five-Year Reviews Concerning Preserved Mushrooms from Chile, China, India, and Indonesia.” Published July 2026.

    Federal Register. “Fresh Mushrooms From Canada: Preliminary Affirmative Countervailing Duty Determinations and Alignment of Final Determination With Final Antidumping Duty Determination.” Published July 2026.

    Foreign Agricultural Service (FAS). Global Agricultural Trade System (GATS). Online Database. Online public database accessed August 2026.


    Recommended citation format: Young, Landyn, and Luis Ribera. “USITC Maintains Anti-Dumping Order on Fresh Mushrooms.Southern Ag Today 6(33.4). August 13, 2026. Permalink

  • From NAFTA to USMCA

    From NAFTA to USMCA

    Authors: Landyn Young and Luis A. Ribera

    The United States-Mexico-Canada Agreement (USMCA) began July 1, 2020. The trade deal was a replacement for the North American Free Trade Agreement (NAFTA) which was done to help create reciprocal trade policies between the partner countries, increase trade and stimulate growth of their economies. While the deal is set to expire, unless an extension occurs, in 2036, the agreement will face review on the first of July. Both Canada and Mexico administrations have expressed their support of the trade agreement while the U.S. administration has expressed its reservations. Regardless of the results, it does not mark a true conclusion unless one member gives a formal intention to withdraw.  

    In 2019, the final full year of NAFTA, $41.3 billion of agricultural exports left the United States for Canada and Mexico, 29.3 percent of total U.S. agricultural exports (Figure 1). Since USMCA has been signed, annual agricultural exports totaled $59.3 billion in 2025, 34.6 percent of total U.S. agricultural exports. The largest category of products exported to Mexico and Canada since 2021 in terms of volume and value are grains and feeds which has accounted for 34.1 MMT of agricultural exports annually, or $13.9 billion (Figure 2). Grains and feeds ranked second during NAFTA, totaling 25.6 MMT worth $8.91 billion. Prior to USMCA, the largest export category to members in terms of value was animal products at $9.53 billion, estimated at around 3.87 MMT.

    Imports from Canada and Mexico under USMCA have averaged 76 MMT annually worth $199 billion (Figure 3). The same timespan during the final years for NAFTA imports averaged 64.3 MMT worth $131 billion. In 2019, agricultural imports under NAFTA were 39.7 percent of total U.S. agricultural imports, while in 2025 they represented 39.1 percent under USMCA. Imports have increased across the board with each product category retaining a similar import share to that in NAFTA (Figure 4). Vegetables continue to hold the highest share of imported agricultural products from Canada and Mexico at 18.2 percent or $14.2 billion annually, as well as totaling 10.7 MMT. Under NAFTA, vegetable imports from the two partners totaled $9.25 billion and 8.6 MMT.  Overall, both NAFTA and USMCA have been successful when you look at the overall objectives of the trade agreement, reduce tariff and non-tariff barriers and increase trade among member countries.

    Figure 1. U.S. Value of Agricultural Exports, 1990-2025

    Source: Global Agricultural Trading System (GATS), USDA/FAS

    Figure 2. Comparing NAFTA and USMCA Agricultural Trade, U.S. Export Value

    Source: Global Agricultural Trading System (GATS), USDA/FAS Note:comparing 2019 NAFTA and average USMCA

    Figure 3. U.S. Value of Agricultural Imports, 1990-2025

    Source: Global Agricultural Trading System (GATS), USDA/FAS

    Figure 4. Comparing NAFTA and USMCA Agricultural Trade, U.S. Import Value

    Source: Global Agricultural Trading System (GATS), USDA/FAS Note: comparing 2019 NAFTA and average USMCA

    Recommended citation format: Young, Landyn, and Luis A. Ribera. “From NAFTA to USMCA.” Southern Ag Today 6(27.4). July 2, 2026. Permalink

  • U.S.-Indonesia Trade Agreement Framework

    U.S.-Indonesia Trade Agreement Framework

    Authors Landyn K. Young and Luis Ribera

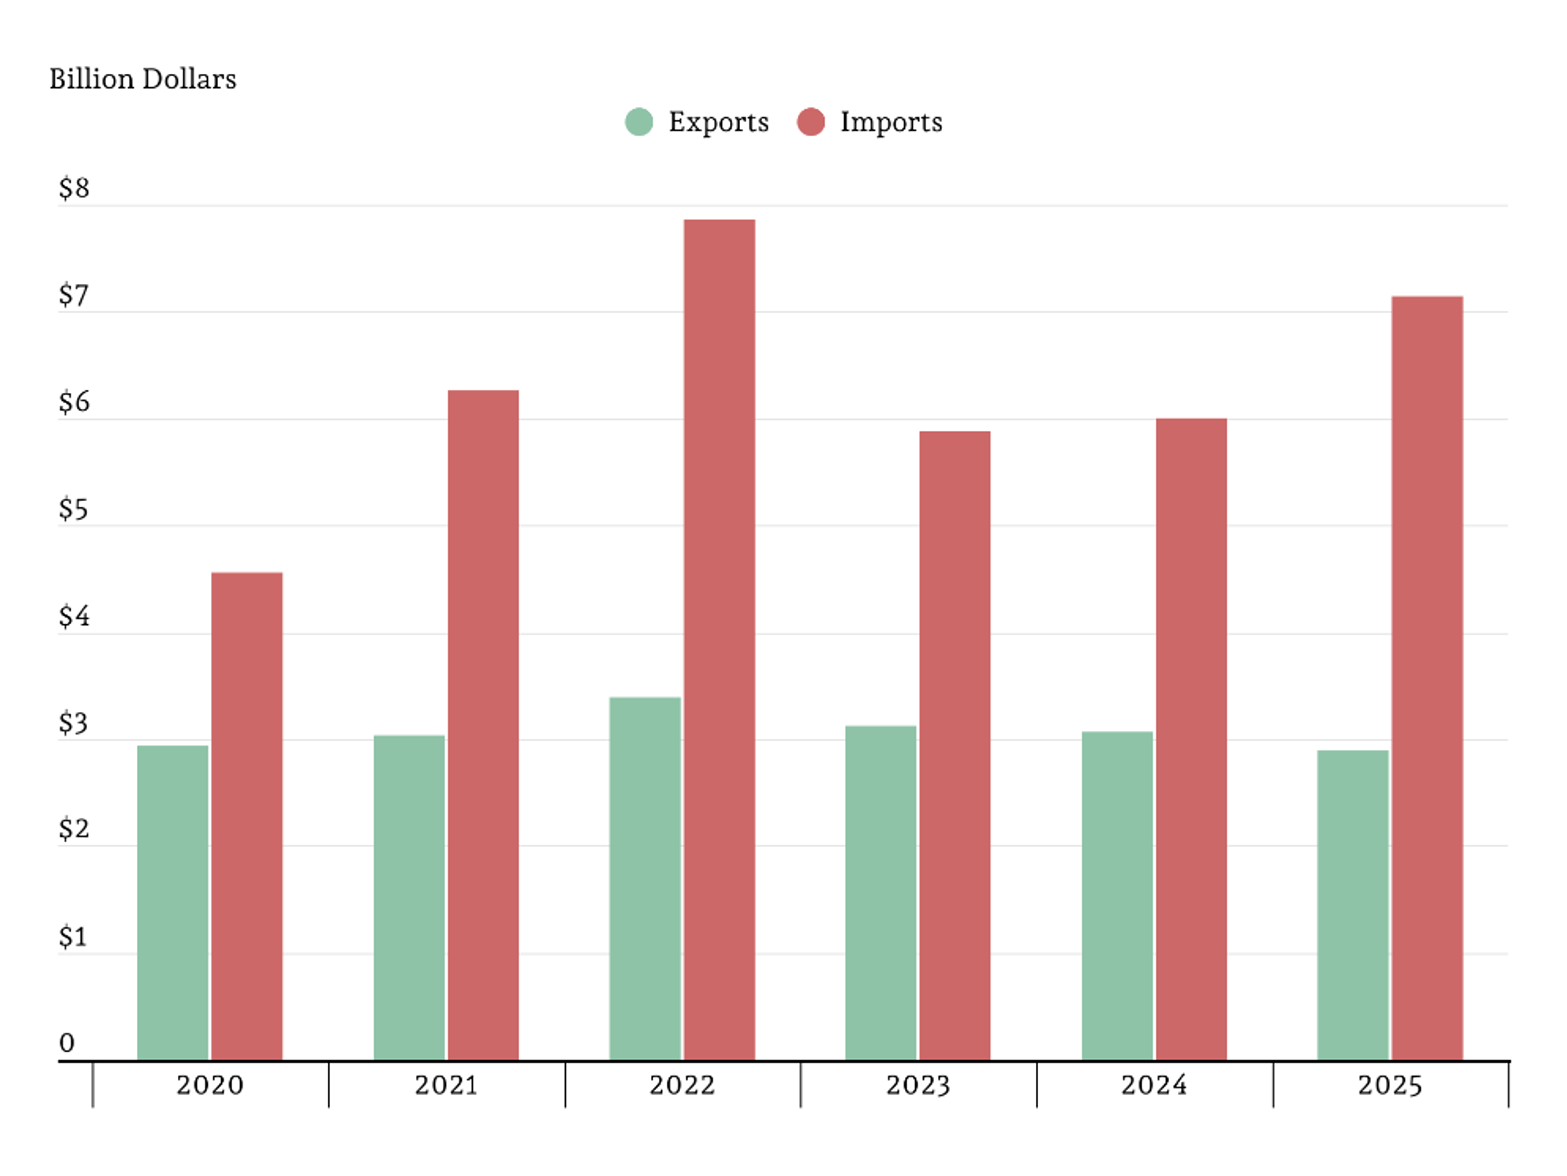
    Another trade agreement framework was announced by the White House a few weeks ago, this time with Indonesia. The released statement explains that tariffs on 99 percent of exports from the United States to Indonesia will be removed, as well as addressing non-tariff barriers. In exchange, tariffs will remain at 19 percent for imports from Indonesia. U.S. agricultural imports from Indonesia reached $7.14 billion in 2025, with exports to the country lagging behind at $2.89 billion, which makes Indonesia the 9th largest source of U.S. agricultural imports and 12th largest export destination. 

    Graph 1. U.S.-Indonesia Agricultural Trade, 2020-2025

    Source: Global Agricultural Trading System (GATS), USDA/FAS

    Exports to Indonesia are dominated by oilseeds which makeup over a third of agricultural export value at $1.14 billion. An additional $752 million of exported products were grains and feed. Dairy products accounted for $221 million of the $454 million of animal products exported to Indonesia. Following these main groups are cotton ($146 million), ag chemicals ($58 million), and fish ($55 million).

    Graph 2. U.S. Agricultural Exports to Indonesia, 2025

    Source: Global Agricultural Trading System (GATS), USDA/FAS

    On top of being the most exported agricultural category, oilseed products led imports from Indonesia. Palm oil and palm kernel oil together made up $2.03 billion of the $3.11 billion in oilseed product imports. Fish, primarily shellfish, accounted for a quarter of agricultural imports with $1.86 billion in imports, followed by cocoa and coffee. Overall, Indonesia seems like a very promising market for agricultural products.

    Graph 3. U.S. Agricultural Imports from Indonesia, 2025

    Source: Global Agricultural Trading System (GATS), USDA/FAS

    Sources

    Foreign Agricultural Service (FAS). Global Agricultural Trade System (GATS). Online database. Online public database accessed February 2025.

    The White House. “Fact Sheet: Trump Administration Finalizes Trade Deal With Indonesia.” February 19, 2025. https://www.whitehouse.gov/fact-sheets/2026/02/fact-sheet-trump-administration-finalizes-trade-deal-with-indonesia/.


    Young, Landyn K., and Luis Ribera. “U.S.-Indonesia Trade Agreement Framework.Southern Ag Today 6(13.4). March 26, 2026. Permalink

  • Grain Sorghum Exports to China at Their Lowest in Over a Decade

    Grain Sorghum Exports to China at Their Lowest in Over a Decade

    In 2025, grain sorghum production for the United States totaled 10.2 million metric tons (MMT). This was led by Kansas, totaling 5.8 MMT, and Texas, 2.64 MMT. Colorado (497 thousand metric tons), Nebraska (494 TMT), and Oklahoma (479 TMT). Aside from a poor production year in 2022, the United States has averaged 9.35 MMT annually.

    The U.S. is by far the largest sorghum exporter, followed by Australia and Argentina. In 2024, the United States exported 5.24 MMT of sorghum worth $1.38 billion, with China being the leading importer. From 2020-2024, China imported more than 83 percent of U.S. exported sorghum with an FOB value ranging from $1.32-2.14 billion each year. In 2024, sorghum exports to China from the United States totaled 4.63 MMT and $1.23 billion. Annually since 2020, less than 16.4 percent of U.S. sorghum exports have gone to the rest of the world. In recent years, Ethiopia, Eritrea, Sudan, and Djibouti follow China in terms of volume imported, but none have imported more than 20 TMT since 2020.

    The ongoing tariff war has caused a decrease in Chinese imports of many U.S. products, including sorghum. In the partial year through July, only 82 TMT of sorghum have been exported; in the same time period in 2024, more than 3.24 MMT of sorghum were exported. As of July 2025, exports were down 80% when compared to the previous year, with sales to China down 97%. Some of these imports are primarily being substituted by Australia and Argentina. Similarly, in 2018 and 2019, sorghum trade between China and the United States fell but rebounded with the U.S.-China “Phase One” Deal that occurred in 2020. The recent agreement between the U.S. and China could reopen the Chinese market for U.S. sorghum.

    World Sorghum Exports, 2013-2024

    World Sorghum Imports, 2013-2024

    U.S. Sorghum Exports, 2016- July 2025

    Sources

    Foreign Agricultural Service (FAS). Global Agricultural Trade System (GATS). Online database. Online public database accessed November 2025.

    Nguema, Abigail. “Grain and Feed Update.” Foreign Agricultural Services. September 30, 2025.

    United Nations Department of Economic and Social Affairs. Comtrade. Online public database accessed November 2025.

    USDA Foreign Agricultural Service (FAS). Production, Supply and Distribution Online (PS&DView). Online public database accessed November 2025.


  • Opportunity for Increased U.S. Peanut Oil Production

    Opportunity for Increased U.S. Peanut Oil Production

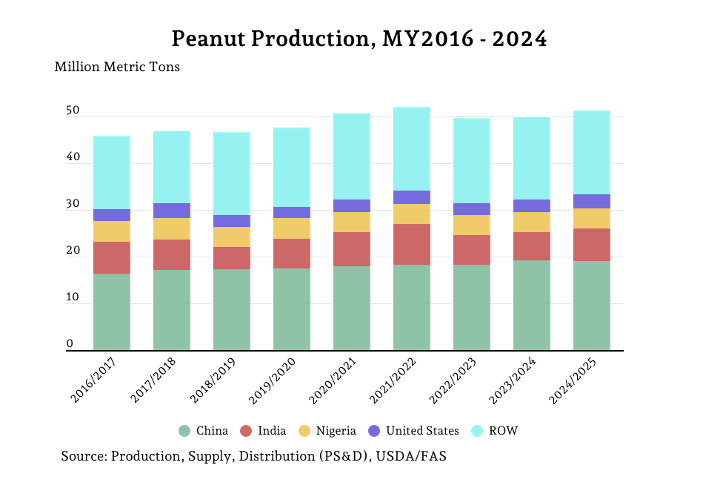
    Five countries produce 70 percent of the world’s peanuts annually. In the 2024/2025 marketing year, 51.4 million metric tons (MMT) of peanuts were grown, and these five leading countries contributed 35.1 MMT to that total. The United States ranks fourth in global peanut production (2.9 MMT) behind China (19 MMT), India (7.1 MMT), and Nigeria (4.3 MMT).

    Production of peanut oil for the five largest markets together accounted for 81 percent of the 6.24 MMT of global production in the 2024 marketing year. Leading global producers, Chinese production has remained relatively stable between 3.1-3.23 MMT since the 2019/2020 marketing year. Indian production has been similar with production between 1.2-1.28 MMT since the 2019 marketing year. The three that follow together accounted for only 694 thousand metric tons (TMT). 

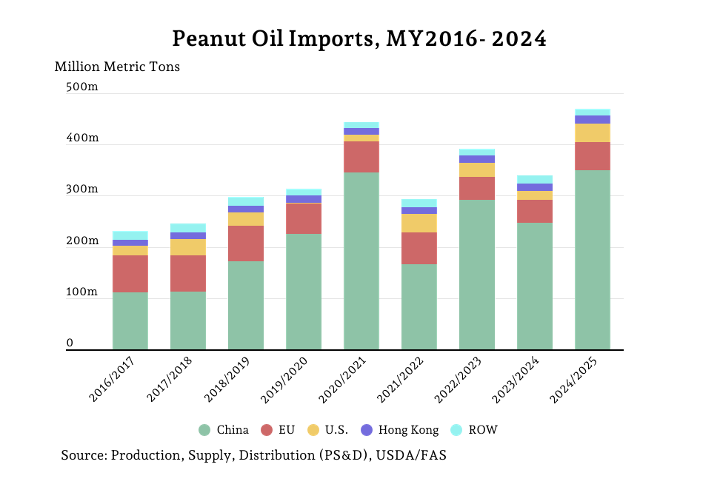
    Only 470 TMT of peanut oil production was traded in the 2024 marketing year, or 7.5 percent of peanut oil production. The five largest exporters accounted for 91.8 percent of exports in the most recent marketing year. On the other side of that trade, the three largest importers totaled 93.8 percent of peanut oil imports. China accounted for most of that, with 350 TMT in the most recent marketing year, or 74.4 percent of peanut oil imports. The European Union (55 TMT) and, United States (36 TMT) are the two other largest markets.

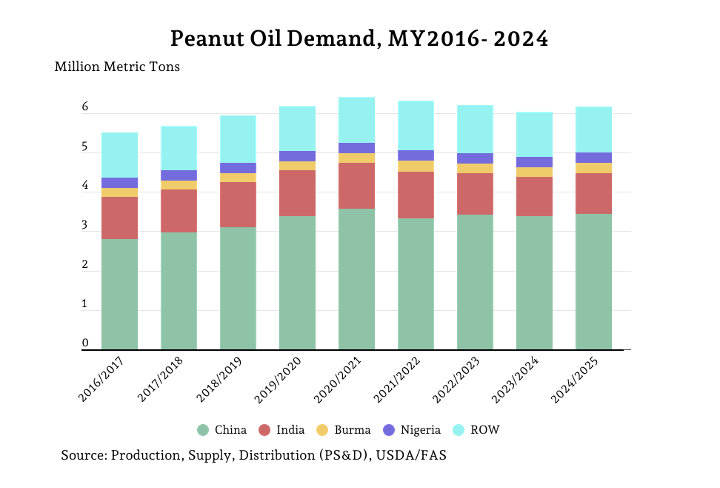
    In the 2024 marketing year, global demand for peanut oil totaled 6.16 MMT, with 83.7 percent going to the five largest markets. More than half of global demand for peanut oil can be attributed to China. India ranks second, despite being a recurring leader for global exports, with just over one million metric tons. Demand in the United States has remained stable around 123-148 TMT, with the exception of the 2019/2020 marketing year, which was around 111 TMT. Excluding the 2019 marketing year, where only 2 TMT of peanut oil was imported, 10-26 percent of demand for the United States is supplied from imports.

    References

    USDA Foreign Agricultural Service (FAS). Peanut Oil Custom Query. Production, Supply, Distribution (PSD). Online public database. Accessed June 2025.


    Young, Landyn, and Luis Ribera. “Opportunity for Increased U.S. Peanut Oil Production.Southern Ag Today 5(26.4). June 26, 2025. Permalink