Author: Lawson Connor

  • Final Planting Dates and the Impact on Prevented Planting Acres

    Final Planting Dates and the Impact on Prevented Planting Acres

    The planting phase of the crop production cycle comes with many risks. The amount of time available for planting is significant in determining whether all the fields intended for planting can actually be planted. For crops insured under the Federal Crop Insurance Program (FCIP), the final planting date, a component of the prevented planting provision of the FCIP, establishes the tail end of the planting window and helps to determine the amount of time available for planting crops each year. 

    Final planting dates vary by crop and location. The dates are chosen to increase the likelihood that insured crops achieve their highest attainable yields each year for a given county and crop. After the final planting date passes, farmers with crop insurance must decide whether to proceed with planting their intended crop or make a prevented planting claim.[1]Prevented planting claims have been known to vary significantly across states. How the final planting dates may influence those differences has not been thoroughly investigated. Generally, final planting dates are set earlier in the calendar year moving from north to south, reflecting the growing seasons that increase in length as one moves further south in the United States. For example, the final planting date for corn is May 31st in Kossuth County, Iowa; May 31st in Thomas County, Kansas; April 25th in Lonoke County, Arkansas; and April 15th in Evangeline Parish, Louisiana. 

    Differences in seasonal weather patterns, though, may affect the effective length of time available to plant as final planting dates change across states. Early spring rains and other weather variables (like temperature) can shorten or lengthen the planting window each year. To account for these differences, we can estimate the effective planting window between the first day available for planting and the final planting date by combing the USDA NASS estimate of days suitable for fieldwork with the final planting date. Here we construct the variable by using the first suitable day for planting according to the NASS estimate and calculate the average number of days suitable for fieldwork that occurs between that date and the final planting date for a county and crop. We use the average for the period 2011-2020 for corn for this example.

    Figure 1a shows how the average effective planting windows change across states using corn as our example. Indiana, where the final planting date for each county is June 5th has, on average, roughly 29 suitable days for planting corn. Louisiana, having the earliest final planting date of April 15th of the states sampled, has the fifth greatest average number of days suitable for planting at roughly 25 days. A clear consequence of a shorter effective planting window is the effect it has on prevented planting claims. Figure 1b shows the percent of insured corn acres with a prevented planting claim for the period 2011-2020. In Figure 1a, the states are ordered by increasing effective planting window. 

    In general, both panels of Figure 1 together show that the prevalence of prevented planting acres runs roughly counter to the effective planting window prior to RMA’s final planting date. The exception, though, seems to be the Midwest states (Iowa, Illinois, and Indiana in this example) where the effective planting window appears to play no significant role at all, suggesting that other factors may be fundamental differences worth exploring in the Midwest states. Factors such as larger farm sizes and greater crop diversity in many southern states, for example, or a higher degree of tiled acres in the Midwest states, potentially play roles, likely compounding the effect of the shorter planting windows on the share of prevented planting acres relative to the Midwest. 

    Nevertheless, the final planting date paired with the NASS days suitable for planting appears highly correlated with the differences in prevented planting acres across states. The significance here is that final planting dates have been designed to consider total potential yield at harvest; however, the cost side of this cost benefit equation may include the risk of prevented planting claims during the planting period. Optimal final planting dates may consider both outcomes in determining optimal final planting dates. 

    Figure 1: a) Average number of suitable days for planting corn for 9 states across the Midwest and Southern United States. b) Average share of county acres with prevented planting claims. 


    Notes: Averages for 2011 – 2020. Average days suitable for fieldwork calculated as the sum of “Days Suitable for Fieldwork” as determined by USDA NASS between the first day suitable for fieldwork and the RMA final planting date. Sources: USDA NASS (2023), RMA Summary of Business (2023). 

    [1] More information on the decisions farmers face for planting occurring after the final planting date can be found here: Connor (2022)Biram and Connor (2023)


    Connor, Lawson. “Final Planting Dates and the Impact on Prevented Planting Acres.” Southern Ag Today 3(33.4). August 17, 2023. Permalink

  • Prevented Planting

    Prevented Planting

    In the mid-south, the prevented planting provision of crop insurance is of particular importance. Prevented planting claims have grown 500% since 2012 in the Mid-South. The table below illustrates prevented planting indemnities averaged roughly 10% of all crop insurance claims before 2012, growing to an average of 51% of all claims since that time. In contrast, prevented planting claims in the Midwest comprised only 8% of all claims since 2012, highlighting the importance of the provision to Mid-South row crop production. The use of prevented planting in the Mid-South can partially be attributed to a rise in early-season precipitation in the region (over 90% of all prevented planting claims nationally are due to excess moisture-related issues). Row crop acres located in high moisture areas of the delta also contribute. It is critical to understand the important aspects of prevented planting and how to incorporate crop insurance into farm operating plans and financial risk management strategies.

    1) If a prevented planting claim is made and a second harvested crop is not planted, the prevented planting claim will not affect the producer’s APH. 2) If a second crop is planted, the second crop must be insured. The producer will receive 60% of their APH for that year for the first crop and the actual yield for the second crop. The producer will only receive 35% of the indemnity but only pay 35% of the premium owed on the first crop. If there is no claim on the second crop, the producer is eligible to receive the remaining 65% of the prevented planting indemnity for the first crop. Note the producer must also pay the remaining premium on the first crop as well. 3) It is worth being aware that while prevented planting claims do not affect rates through APH, they will typically affect rates through a load factor. Load factors are added to premium rates to help cover administrative costs and to ensure sufficient reserves exist to handle non-yield or extreme claims. Prevented planting adjustments are added through such load factors, and the size of the load will depend on the total amount of prevented planting indemnities made across the state. 4) Before making a prevented planting claim, producers should ensure that they have sufficient eligible acres for the number of prevented planting acres they need to make. A producer is not allowed to claim more prevented planting acres than they have planted in the past. However, a producer can “roll” prevented planting acres into other eligible acres they may have of a different crop. Producers should be sure they have sufficient roll acres of the second crop and that the prevented planting indemnity calculated for the second crop would be sufficient to cover the necessary costs associated with the first crop. 5) Be sure that any land with an intended prevented planting claim satisfies the “1 in 4 rule”. For land to be eligible for prevented planting, it must have been planted, insured, and harvested in one of the last four years. Otherwise, the land must have been adjusted for claims other than excess moisture, flood, or drought in one of the last four years. Land that failed the 1 in 4 rule must meet the mentioned requirement for two consecutive years before becoming eligible again for prevented planting.

    Keeping the above points in mind, producers can reap risk protection from prevented planting without unwanted surprises and/or adversely affecting their crop insurance rates.

    Author: Lawson Connor

    Assistant Professor

    lconnor@uark.edu


    Connor, Lawson. “Prevented Planting.Southern Ag Today 2(51.3). December 14, 2022. Permalink

  • Cover Crops and Risk

    Cover Crops and Risk

    Large-scale ecosystem benefits tend to drive policy interest in cover crops. However, incorporating cover crops in a farm management plan will also require them to generate on-farm returns. To date, findings of their ability to generate profits have been mixed with inconsistent results across several studies. However, returns in a broad sense of cover crops include potential impacts on risks in addition to their effect on profits. A year of substantial loss savings can offset or justify years of minimal to slightly decreased net profit outcomes. Especially true in areas where crop prices are countercyclical to yields. Therefore, if or how cover crops help manage risk is an important consideration for their inclusion in a farm management plan.

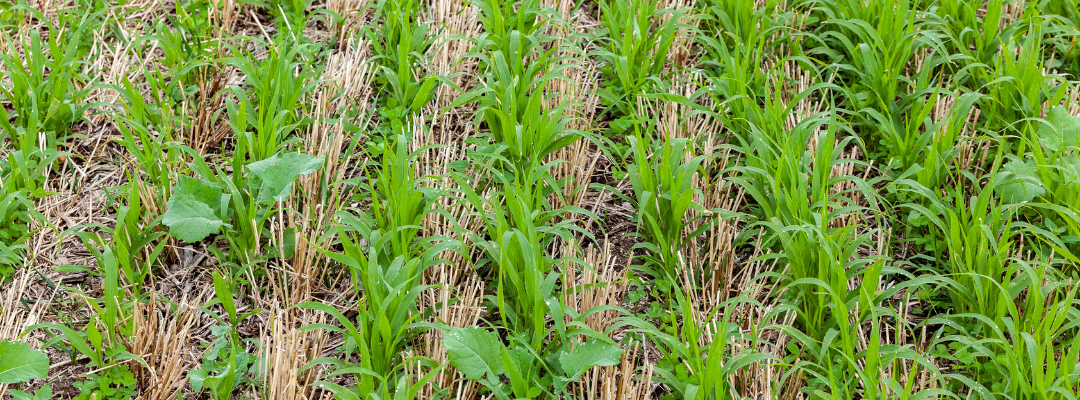
    Cover crops and their ability to reduce soil erosion and provide increased root infiltration into the soil have been studied in the context of managing specific risks, extreme wet and extreme dry (drought) conditions. Roughly 83% of total crop insurance losses in the Mid-South were related to one of these two events with 70% being excess moisture related and the majority of those from prevented planting. Regarding extreme moisture risks, most studies indicate that cover crops reduce crop damage under specific conditions. Where nutrient leeching is an issue, which may be a feature on some irrigated fields, cover crops, particularly grass cover crops, have been found to reduce corn yield losses during extreme moisture events because of higher available carbon during the growing season. A study in Northeast Mississippi showed reduced effects of excess moisture in corn-soybean rotation fields. However, some studies also show that cover crops can create early season planting challenges getting the cash crop planted in wet fields. The additional time required to terminate the cover crop may not allow sufficient time to get the cash crop planted and established. This is especially true in conventional tilling systems and where planting green (planting the cash crop in a living cover crop) is not possible.

    In NRCS Zone 4 cover crop regions, the effects of cover crops in drought conditions seemed to be more consistent. The findings suggest that cover crops reduced soil compaction, increased root infiltration, and in general, led to increased water availability for the cash crop, reducing drought damage. More studies are needed in the mid-south, but a few studies observing farmers in the Midwest during the 2012 drought saw farms with cover crops experiencing an eleven (11) percentage point increase in yields relative to farms without cover crops.

    Overall, cover crops show potential for risk management, particularly for managing drought risk. However, outcomes appear to be highly related to the suite of management practices on the farm, such as the cover crop variety used, whether combined with no-till, the ability to plant green, and the planting dates of the cash crop in question. In the mid-south, a cover crop before planting cotton or soybeans may be more feasible than a cover crop before planting corn when considering planting dates and early season weather risks. Nevertheless, where risk management rather than yield is the goal, a conversation with a local agronomist may help determine whether cover crops may be a good consideration as a long-term risk management tool on your farm.

    Mid–South Causes of Indemnities Crop Insurance: 2015 – 2020

    Source: RMA Summary of Business

    References:

    Bergtold, J., Ramsey, S., Maddy, L., & Williams, J. (2019). A review of economic considerations for cover crops as a conservation practice. Renewable Agriculture and Food Systems, 34(1), 62-76. doi:10.1017/S1742170517000278

    Bharat Sharma Acharya, Syam Dodla, Lewis. A. Gaston, Murali Darapuneni, Jim J. Wang, Seema Sepat, Hari Bohara, Winter cover crops effect on soil moisture and soybean growth and yield under different tillage systems, Soil and Tillage Research, Volume 195, 2019, 104430, ISSN 0167-1987, https://doi.org/10.1016/j.still.2019.104430

    Blanco-Canqui, H., Shaver, T.M., Lindquist, J.L., Shapiro, C.A., Elmore, R.W., Francis, C.A. and Hergert, G.W. (2015), Cover Crops and Ecosystem Services: Insights from Studies in Temperate Soils. Agronomy Journal, 107: 2449-2474. https://doi.org/10.2134/agronj15.0086

    Chalise, K.S., Singh, S., Wegner, B.R., Kumar, S., Pérez-Gutiérrez, J.D., Osborne, S.L., Nleya, T., Guzman, J. and Rohila, J.S. (2019), Cover Crops and Returning Residue Impact on Soil Organic Carbon, Bulk Density, Penetration Resistance, Water Retention, Infiltration, and Soybean Yield. Agronomy Journal, 111: 99-108. https://doi.org/10.2134/agronj2018.03.0213

    G.S. Marcillo and F.E. Miguez, Corn yield response to winter cover crops: An updated meta-analysis, Journal of Soil and Water Conservation May 2017, 72 (3) 226-239; DOI: https://doi.org/10.2489/jswc.72.3.226

    Connor, Lawson. “Cover Crops and Risk“. Southern Ag Today 2(34.3). August 17, 2022. Permalink

  • A View of Cash Rents

    A View of Cash Rents

    Cash rents in 2021 have increased at a national average of 1.4% from 2020.  Agricultural land values have seen a similar pattern.  However, land values and cash rents may not necessarily reflect the same set of factors affecting the farm economy.  Cash rents will capture factors affecting returns to agricultural land (past, present and expectations of the future) while agricultural land values will also capture non-agricultural factors such as expected future land use pressures and land taxation which are decoupled from farm incomes. 

    Cash rents therefore will depend on indicators of expected returns to farming such as yields, soil quality, irrigation, crop choice, prices and farm policy.  Since a dip in farm incomes after 2012, cash rental rates at the national level have been relatively stable.  However, recent increases in farm income indicators have begun placing upward pressure on cash rental rates.  As the figure shows, not all locations or land use types experience this pressure similarly. For many Southern states, irrigation is becoming more common in row crop production and irrigated acres have seen the most significant upward trend in rents.  Changes to rents on non-irrigated acres were much less pronounced.

    As a tenant or landlord, negotiating what to pay/charge as cash rent can be a complex question. Maintaining good records of farm performance usually provides a good basis for starting, and a variety of income/expense driven formulas can be found to use as templates. The producer income approach, for example, takes expected revenue and subtracts expected costs to evaluate net returns available for rent. Most formula methods will require some assumptions about future revenue streams, which can be a drawback but allows for a relatively straightforward reference point from which to begin determining a final cash rental rate. While coffee shop market information about local rates can be helpful, it rarely tells the full story. Widely collected USDA data can describe trends, but doesn’t address specific attributes of a unique piece of farmland.  Don’t ignore any of these sources, but it is critically important to do the math with your own assumptions to determine what you can afford.  

    Citations:

    Fee, R. February 2011, “Seven Ways to Compute Cash Rent”. Successful Farminghttps://www.agriculture.com/farm-management/farm-land/farmland-values-on-a-rocket-ship

    US Department of Agriculture, National Agricultural Statistics Service.  2021. QuickStats. September.  http://quickstats.nass.U.S.da.gov/


    Connor, Lawson. “A View of Cash Rents.” Southern Ag Today 1(45.3). November 3, 2021. Permalink