Author: Luis Ribera

  • U.S. Agricultural Competitiveness and Regulation Costs

    U.S. Agricultural Competitiveness and Regulation Costs

    Authors: Luis Ribera and Landyn K. Young

    The U.S. is highly competitive in agricultural production and the largest agricultural exporter in the world. In 2024, these exports were estimated to total $181.3 billion. Given that the world population is expected to reach nearly 10 billion by 2050, the U.S. is well positioned to be the source of agricultural products to feed the growing population.  Moreover, global GDP is expected to grow between 2 and 4 percent through 2050. This means that not only will there be more people to feed, but also those people will have more purchasing power.

    Of the top eight U.S. agricultural export commodities, the U.S. ranks first in global exports of corn and pork, and second in soybeans, cotton, and poultry (Table 1).  Meanwhile, Brazil, another powerhouse in agricultural production with $144.4 billion in agricultural exports in 2024, ranks first in global exports of soybeans, beef and veal, cotton and chicken, and second in corn and soybean meal.  Brazil’s ability to double crop, produce two crops in the same season, and its potential to double or even triple its cropland puts it in a very advantageous position to continue to increase its global food market share. On the other hand, U.S. productivity and agricultural infrastructure, i.e., roads, rail, waterways, and ports, help in remaining competitive globally.

    One area that erodes U.S. competitiveness is the increase in government regulations.  To illustrate, Figure 1 shows the total number of pages published in the Code of Federal Regulations, increasing from around 15,000 in 1950 to around 190,000.   If the cost of U.S. regulations were a country, it would be the fourth richest country in the world, just behind the U.S., China, and Japan. Moreover, a study by the National Association of Home Builders stated that 23.8 percent of the cost of a new single-family home, or an average of $93,870, is due to government regulations.  Finally, regulatory costs, also known as societal hidden taxes, are equivalent to $14,684 or 22 percent of the 2020 annual household expense budget; more than any other expenses except housing, which is $22,624 (Figure 2).

    Regulatory costs are an added source of concern to agricultural production as well. A study by Hamilton and McCullough (2025) showed that while production costs for a lettuce farmer in Salinas Valley, California, have increased significantly over the years, regulatory costs have increased exponentially from 2006 to 2024 (Table 2). In 2006, the cooperating lettuce grower reported regulatory costs totaling $109.15 per acre, increasing to $977.30 per acre in 2017, and growing to $1,600.12 per acre in 2024, which is a 63.7 percent increase from 2017 and a 1,366 percent increase since 2006. Regulatory costs comprised just 1.24 percent of production costs in 2006, then rose to 8.9 percent in 2017 and 12.6 percent of production costs in 2024.  Agriculture is a hard business to be in; producers deal with constant price volatility, increasing input costs, pests, and weather, among many other challenges outside of their control.  On top of that are increasing regulatory costs, which add yet another barrier to remaining competitive in the global arena with countries that do not have such a burden. 

    Table 1. Ranking of Agricultural Exports for Selected Commodities, 2025

     United StatesBrazil
    Corn12
    Soybean21
    Beef-Veal41
    Pork13
    Wheat510
    Soybean Meal32
    Cotton21
    Poultry21
    Source: Production, Supply, Distribution (USDA/FAS)

    Figure 1. Total Pages Published in the Code of Federal Regulations, 1950-2023.

    Figure 2. U.S. Household Expense Budget of $66,928 Compared to Regulatory Costs

    Table 2. Regulatory Costs for Salinas Valley Lettuce Grower, 2006, 2017, and 2024.

    Regulatory Category200620172024
     Cost per acre
    Education/Training for Regulatory Compliance$1.27$26.31$25.60
    Air Quality Requirements $0.00$5.31$8.29
    Water Quality/Quality Requirements $4.30$18.57$29.72
    Department of Pesticide Regulation$22.98$35.55$47.59
    Food Safety – LGMA Assessments$0.64$181.48$244.15
    Food Safety – PR Assessments$19.66$14.88$13.18
    Labor Health & Safety Requirements$0.00$28.72$43.71
    Worker’s Compensation$58.94$336.23$428.40
    ACA Requirements$0.00$141.19$334.47
    Labor Wage Requirements$1.36$189.10$425.00
    Totals (per acre)$109.16$977.34$1,600.12
    Source: Hamilton & McCullough, 2025

    References

    Adcock Flynn, Luis A. Ribera, Yuri Calil, and Constanza Valdes.  “Brazil at 2040: Customer and Competitor.”  Center for North American Studies, Department of Agricultural Economics, Texas A&M University.   CNAS Report 2018-02.  October 2018.

    Coffey, Bentley, Patrick A. McLaughlin, and Pietro Peretto.  “The Cumulative Cost of Regulations.”  April 2016

    Crews Jr., Clyde Wayne.  2026. “Ten Thousand Commandments, 2026: An Annual Snapshot of the Federal Regulatory State.”  30th Anniversary Competitive Enterprise Institute Edition.

    Calil, Yuri and Luis A. Ribera.  2019. “Brazil’s Agricultural Production and Its Potential as Global Food Supplier.”  Choices Magazine.  Quarter 3.

    Hamilton, Lynn and Michael McCullough. “A Decade of Change: A Case Study of Regulatory Compliance Costs in the Produce Industry.” Cal Poly, San Luis Obispo. January 2025.

    IMF World Economic Outlook (WEO). October 2015.

    World Bank. “Global Economic Prospects.” January 2026.

    World Trade Organization. “World Trade in Agriculture.” January 22, 2026.


    Ribera, Luis, and Landyn K. Young. “U.S. Agricultural Competitiveness and Regulation Costs.” Southern Ag Today 6(19.4). May 7, 2026. Permalink

  • Uncertainty is the Name of the Game for U.S. Agricultural Trade in 2026

    Uncertainty is the Name of the Game for U.S. Agricultural Trade in 2026

    Authors: [1]Luis Ribera, Texas A&M AgriLife Extension Service

    Aleks Schaefer, Oklahoma State University

    To say that it has been a very busy year for U.S. agricultural trade is an understatement. Since “Liberation Day” back on April 1, 2025, and even before that, trade has been a major news topic.  The current administration’s strategy of leveraging tariffs (combined with the sheer size of the U.S. market) to change trade relationships with the rest of the world has generated much uncertainty in nearly all markets.  Both agricultural and non-agricultural industries have reacted to the almost daily trade talk news.

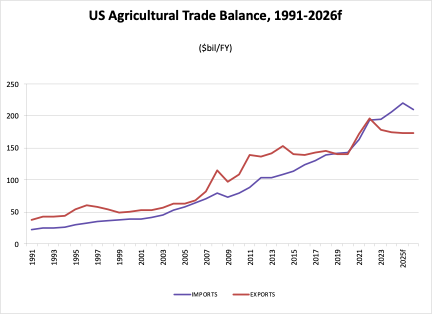
    U.S. agricultural exports wrapped up 2024 at $174.1 billion.  USDA Outlook for U.S. Agricultural Trade December 2025 report forecast that exports will close 2025 slightly higher than the previous year at $175.6 billion.  However, the forecast for 2026 exports is $173 billion, the lowest since 2021.  The reason for this slight decrease is both volume and value, as they are expected to decrease by 1.1% and 1.5%, respectively. A continuous decrease in soybean and sorghum exports to China are the main driver of the decrease in value of U.S. ag exports in 2025, as well as expectations for 2026.  China increased their imports of these two products from Brazil and Argentina due to the increased of U.S. tariffs on their exports.  There has been an increase in exports to other countries such as the EU, Mexico, Indonesia, and Vietnam, but not enough to offset the decrease in exports to China.

    On the other hand, U.S. agricultural imports are expected to reach an all-time high in 2025 at $219.4 billion and are expected to decrease in 2026 to $210 billion.  The main reasons for this expected decrease are lower imports of horticultural products and vegetable oils.  Cocoa and products, as well as coffee and products, have increased the value of imports but reduced the volume, showing that prices of those products are expected to go up.  Hopefully, the recent announcement of tariff exceptions on some agricultural products, including beef, tea and coffee, fruit juice, cocoa, spices, bananas, oranges, tomatoes, and certain fertilizers, will help reduce their prices paid by U.S. consumers.


    [1] Ribera is Professor, Department of Agricultural Economics, Texas A&M AgriLife Extension. Schaefer is Associate Professor, Department of Agricultural Economics, Oklahoma State University.

  • Recent Tariff Exceptions and Trade Agreements Aimed to Reduce Food Costs

    Recent Tariff Exceptions and Trade Agreements Aimed to Reduce Food Costs

    Recently, the Trump administration announced tariff exceptions on some agricultural products, including beef, tea and coffee, fruit juice, cocoa, spices, bananas, oranges, tomatoes, and certain fertilizers. Imports account for over ninety percent of consumption for four of these products: bananas, tea, coffee, and cocoa. Spices, tomatoes, and fruit juice also have import shares surpassing 60 percent. Meanwhile, consumption of beef and oranges have not been as reliant on imports, with a dependency totaling less than 20 percent of U.S. consumption. In 2024, the beef industry produced 12.4 million metric tons (MMT) of carcass weight equivalent beef, and the citrus industry grew 3.33 MMT of oranges. Of the 1.52 MMT of beef imports in 2024, ground beef made up nearly two-thirds at 981 thousand metric tons (TMT).

    Figure 1: U.S. Import Share of Agricultural Products Relieved of Reciprocal Tariffs, MT, Five-Year Average 2020-2024

     Import ShareProductionImports
    Beef*12.68%12,472,0001,810,400
    Oranges17.11%3,332,304687,805
    Fertilizer23.84%39,15012,257
    Spices60.00%427,003640,505
    Tomatoes69.93%864,1621,981,046
    Fruit Juice**69.77%2,0974154,840,255
    Cocoa99.00%14,2401,409,748
    Coffee99.82%2,7361,502,760
    Tea99.99%29205,456
    Bananas100.00%–5,121,292
    Sources: PS&D, USDA/FAS; GATS, USDA/FAS, Fruit and Treenut Yearbook, USDA/ERS, Fertilizer Dashboard, USDA/FAS; Buzzanell, Peter. “The Spice Market in the United States: Recent Developments and Prospects.”
    *Beef is measured in carcass weight equivalent
    ** Fruit Juice Measured in kiloliters

    Canada is the largest source of imported cocoa products and fertilizer for the United States, amounting to $2.77 billion and $4.73 billion, respectively, in 2024. Brazil is the leader in fruit juice exports to the United States at $1.14 billion. Mexico is the source of 85 percent of imported tomatoes, worth $3.12 billion, in the United States. Vietnam and India rank as the two leading sources of U.S. spice imports, $472 million and $410 million, respectively. As for tea, China ($118 million), Japan ($115 million), Canada ($107 million), and India ($92 million) each account for around 10 percent of U.S. imports. Brazilian coffee exports totaled $2.13 billion, and 21.6 percent of U.S. imports.

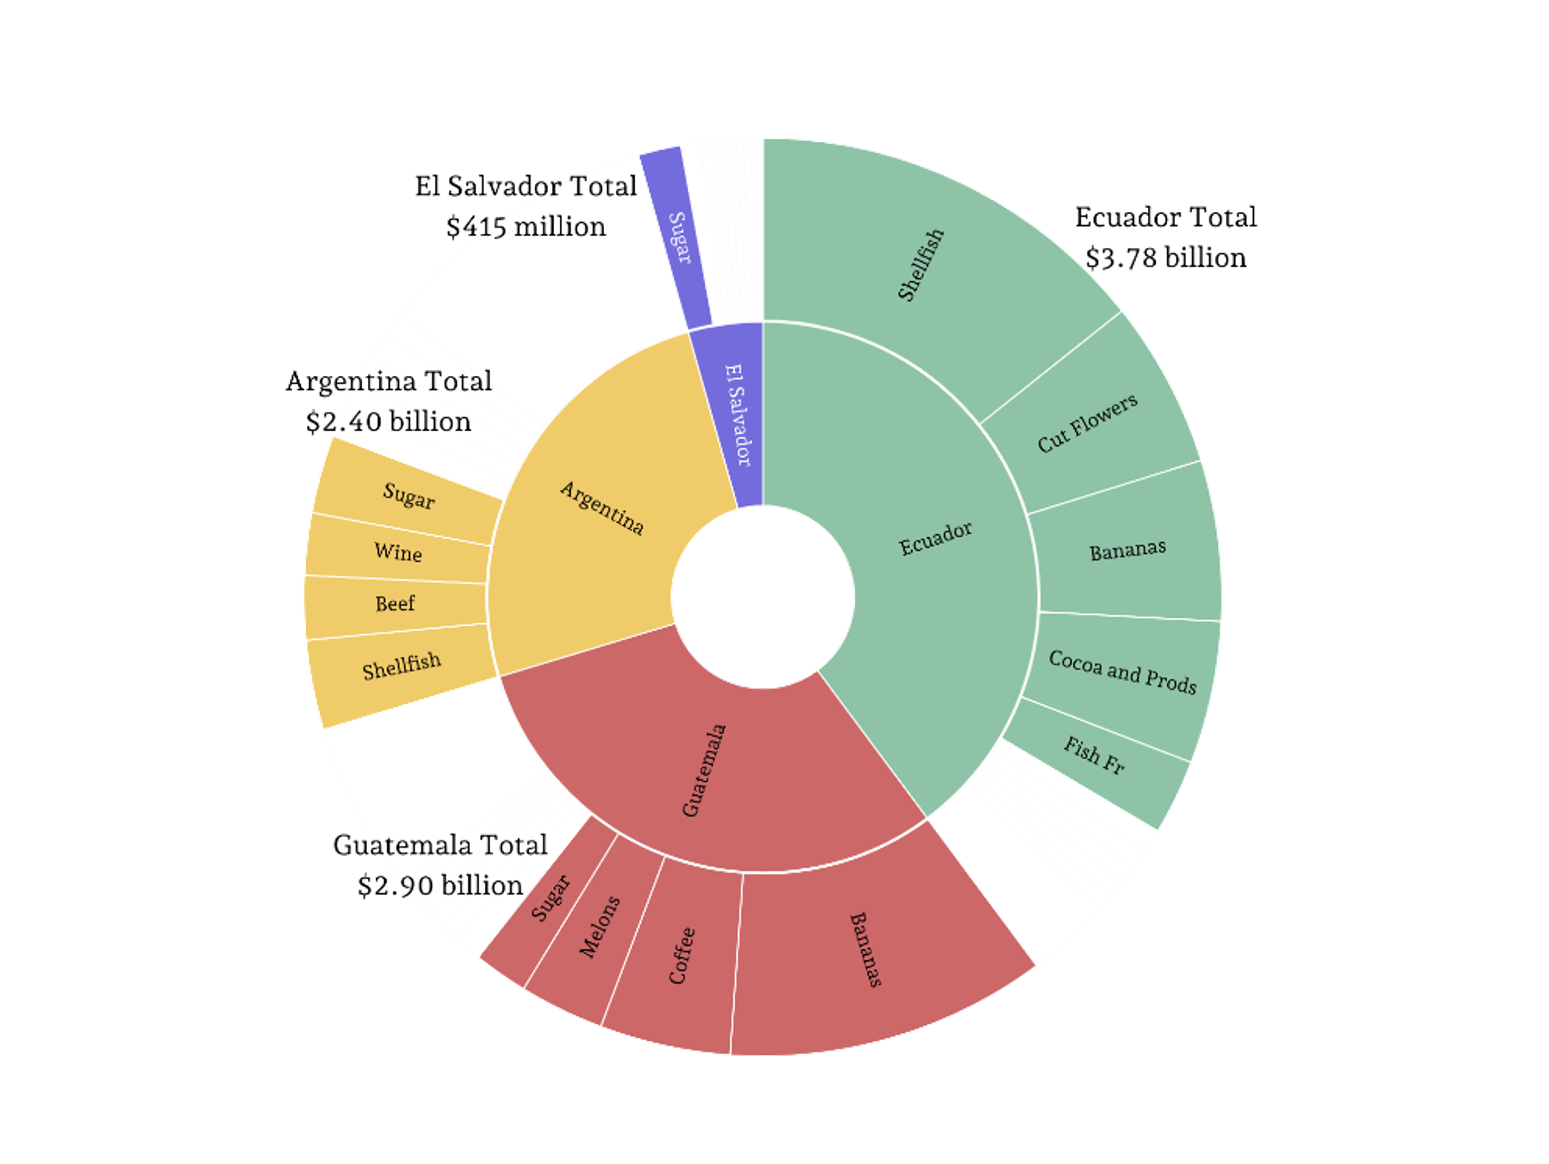
    Additionally, the Trump administration has announced framework agreements with Ecuador, Guatemala, El Salvador, and Argentina, focusing on reciprocal trade and investment to boost market access and address non-tariff barriers. These agreements would remove the reciprocal tariff rate of 10 percent, 15 percent in the case of Ecuador, on the bulk of exported products to the United States from the respective country. In 2024, U.S. imports of agricultural products totaled $7.45 billion from the four countries. In 2024, imports from Ecuador totaled $3.78 billion with shellfish accounting for 35 percent of this total, with cut flowers, bananas, and cocoa each worth more than ten percent of the import value. Two products, bananas and coffee, made up more than half of the $2.9 billion imported from Guatemala. The $2.40 billion of imports from Argentina were mixed between a large group of items, with shellfish, beef, wine, and sugar making up 41 percent of the total. Finally, sugar and coffee were the leading products imported from El Salvador, together totaling $207 million of the $415 million in 2024.

    Figure 2: U.S. Imports from Selected Countries, 2024

    Source: GATS, USDA/FAS

    Sources:

    Buzzanell, Peter J. Rex Dull, & Fred Gray. “The Spice Market in the United States: Recent Developments and Prospects.” July 3, 1995. https://ers.usda.gov/publications/pub-details?pubid=42049.

    Economic Research Service (ERS). “Fruit and Tree Nuts Yearbook Tables.” Accessed November 2025. https://www.ers.usda.gov/data-products/fruit-and-tree-nuts- data/fruit-and-tree-nuts-yearbook-tables/. Published February 25, 2025.

    Foreign Agricultural Service (FAS). “Global Fertilizer Dashboard.” Online Database. https://www.fas.usda.gov/data/visualization-global-fertilizer-trade-dashboard. Online public database.

    Foreign Agricultural Service (FAS). Global Agricultural Trade System (GATS). Online database. https://apps.fas.usda.gov/gats/default.aspx. Online public database accessed November 2025.

    Foreign Agricultural Services (FAS). Production Supply and Distribution (PS&D). Online Database. https://apps.fas.usda.gov/psdonline/app/index.html#/app/advQuery. Online public database

    The White House. “Fact Sheet: Following Trade Deal Announcements, President Donald J Trump Modifies the Scope of the Reciprocal Tariffs with Respect to Certain Agricultural Products.” November 14, 2025.


    Ribera, Luis, and Landyn K. Young. “Recent Tariff Exceptions and Trade Agreements Aimed to Reduce Food Costs.” Southern Ag Today 5(49.4). December 4, 2025. Permalink

  • Can the U.S. Move from Multilateral to Bilateral Trade Agreements?

    Can the U.S. Move from Multilateral to Bilateral Trade Agreements?

    As U.S. trade policy under this administration continues to dominate the news, there seems to be a marked shift from multilateral to bilateral trade negotiations. The current administration’s strategy to use tariffs and the size of the U.S. economy as leverage to change trade relationships bilaterally seems to be the norm lately. There are 166 countries that are members of the World Trade Organization (WTO). How realistic would it be for the U.S. to negotiate bilateral trade agreements with each of them? And a follow up question, does the United States need to have a bilateral trade agreement with each country?

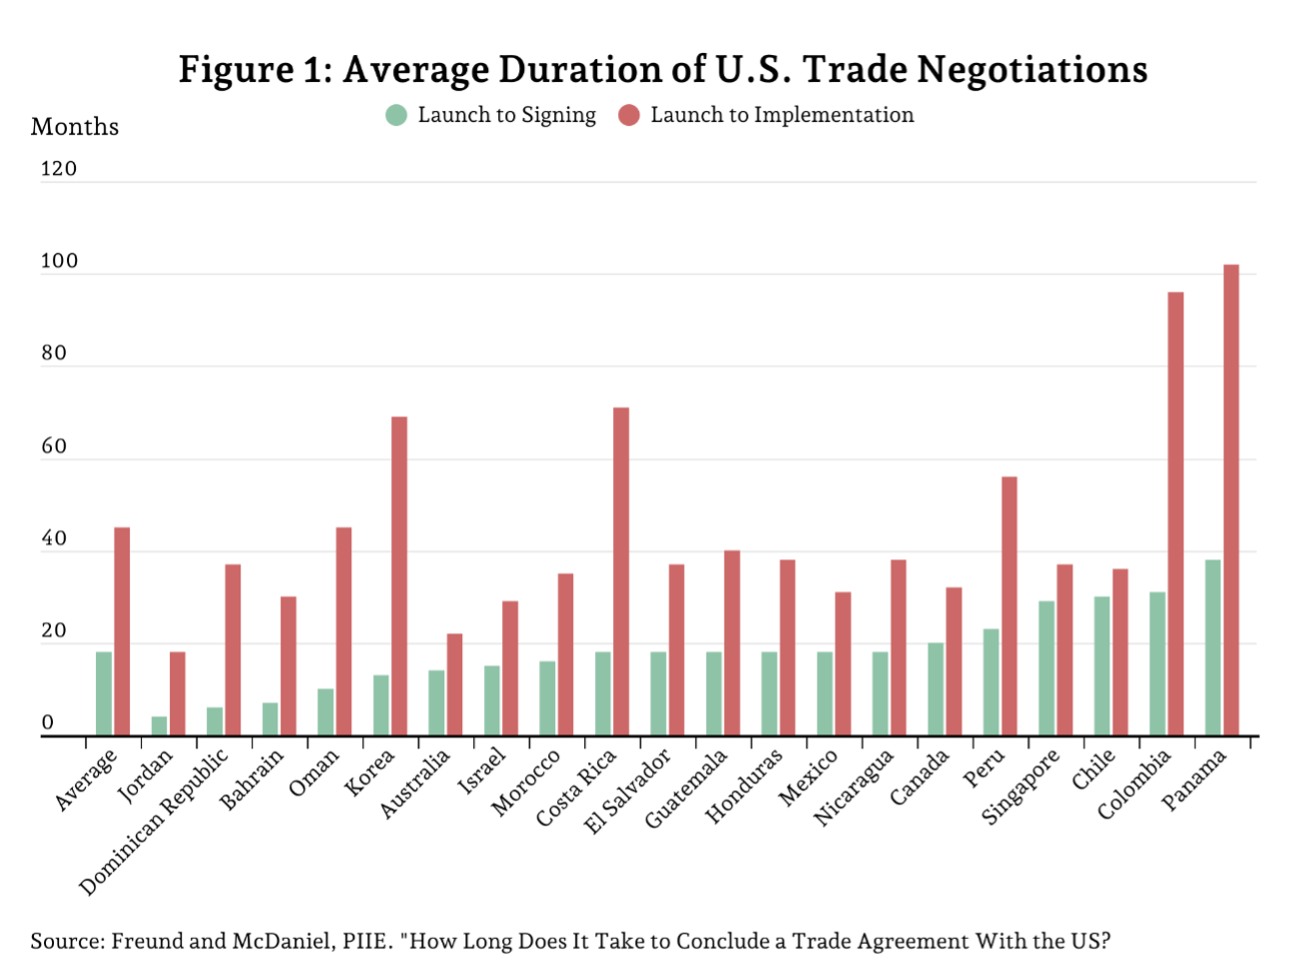
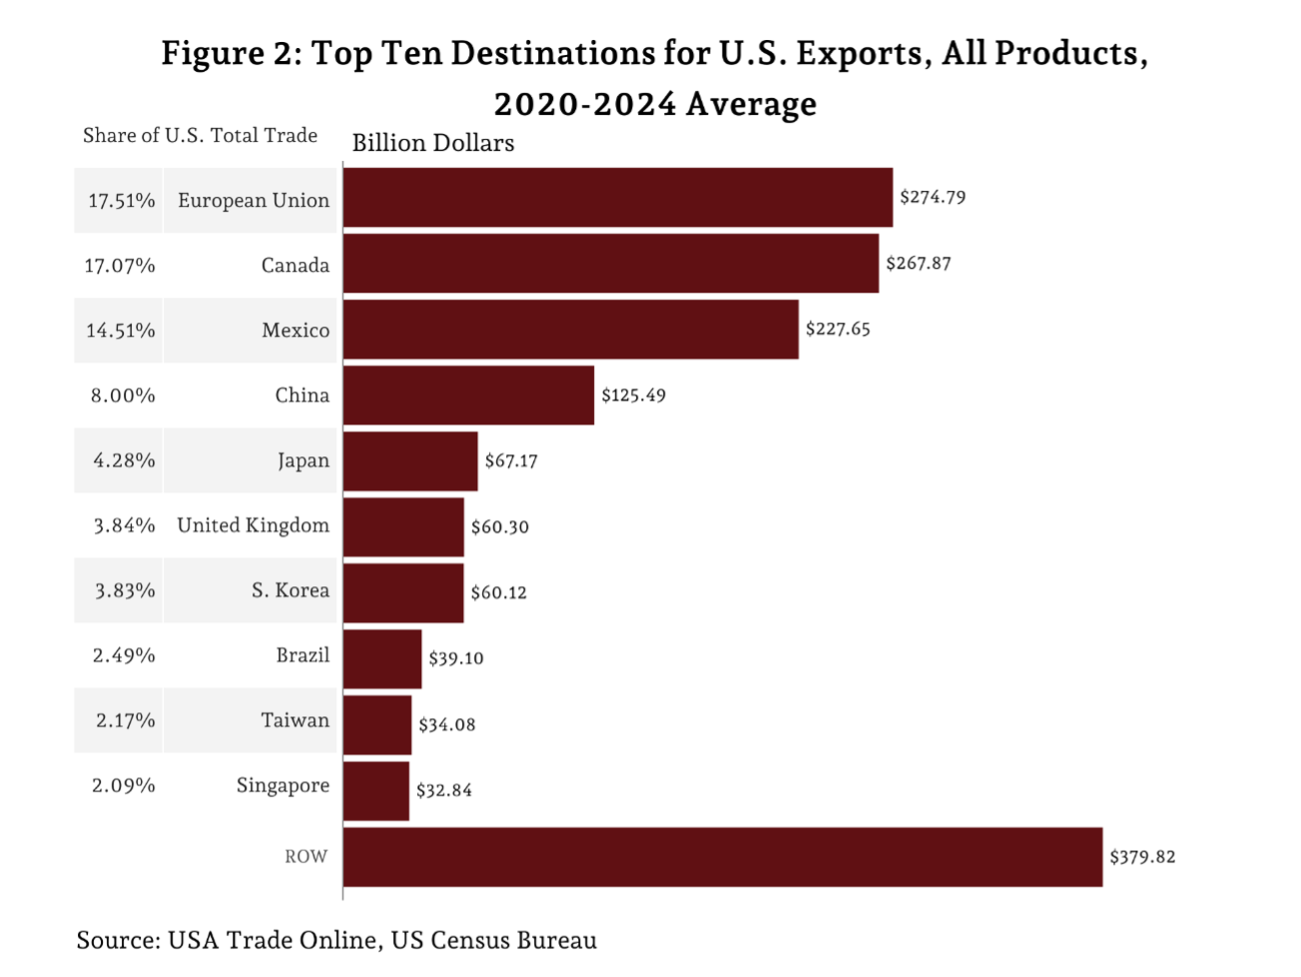
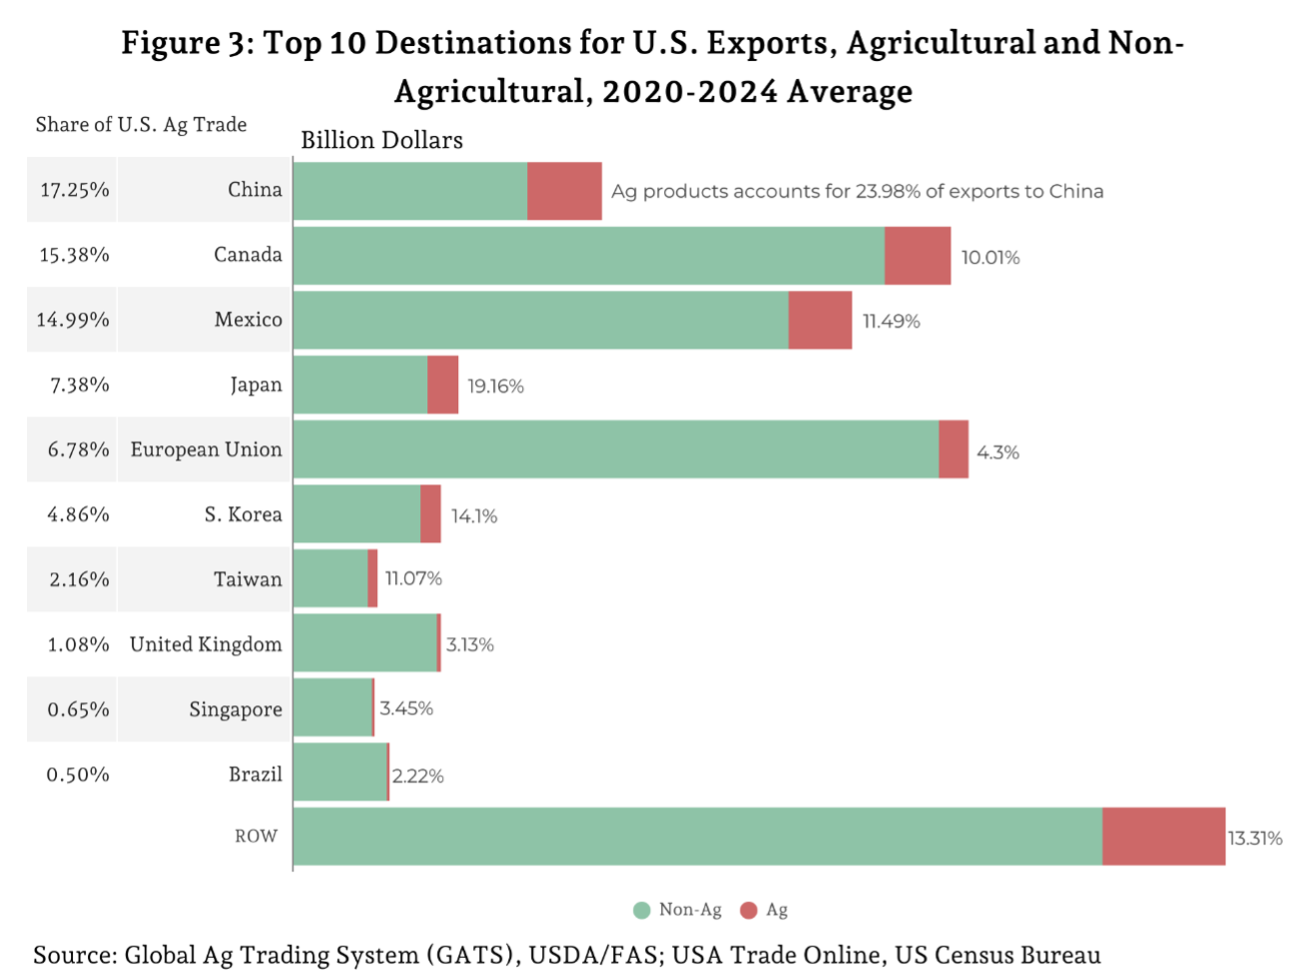
    The answer to the first question is probably “no” as the average duration of U.S. trade negotiations from launch date of signing is 18 months and from launch to date of implementation is 45 months (Figure 1.). Therefore, it will take too much time and resources to negotiate or re-negotiate trade agreements with all WTO members. However, to the second question, the answer is probably “no” as well; the top 10 export destinations accounts for 76 percent of all U.S. products exported (Figure 2.). The European Union (EU) is the largest market for U.S. products accounting for 17.51 percent followed by Canada, Mexico and China with 17.07, 14.51 and 8 percent, respectively. The United States has already or is currently negotiating trade agreements with all top 10 countries.

    When the top 10 destination for all U.S. products are ranked by share of agricultural exports, the order of countries changes. China is the largest destination for all U.S. ag products accounting for 17.25 percent. In addition, agricultural products account for 23.98 percent of all U.S. products that China imports from the United States. The second largest destination is Canada where 15.38 percent of all U.S. agricultural products end up, and those agricultural products account for 10.01 percent of all U.S. products exported to Canada. To finish the top three, Mexico accounts for 14.99 percent of all U.S. agricultural products exported while agricultural products account for 11.49 percent of all products the U.S. exported to Mexico. These top 10 countries account for 71 percent of all U.S. agricultural exports.  Due to the latest trade tensions, China is no longer the top destination for U.S. ag exports but is now third behind Mexico and Canada.

    References

    Foreign Agricultural Service (FAS). Global Agricultural Trade System (GATS). Online database. https://apps.fas.usda.gov/gats/default.aspx. Online public database accessed October 2025. 

    Freund, Caroline & Christine McDaniel. “How Long Does It Take to Conclude a Trade Agreement With the US?” Peterson Institute for International Economics. July 21, 2016.


    Ribera, Luis A., Landyn Young. “Can the U.S. Move from Multilateral to Bilateral Trade Agreements?” Southern Ag Today 5(42.4). October 16, 2025. Permalink

  • How is the Consumer Price Index Impacted by Trade Talks

    How is the Consumer Price Index Impacted by Trade Talks

    Since “Liberation Day” back on April 1, 2025, and even before that, trade has been a major news topic.  The current administration’s strategy to use tariffs and the size of the U.S. economy as leverage to change trade relationships with the rest of the world has generated a lot of uncertainty in the market.  Both ag and non-ag industries have reacted to the almost daily trade talk news. Arguments for and against tariffs are all over the place, with the main question being, who is going to pay for the tariff hikes? 

    To better address this question, it is important to differentiate between short- and long-term effects as the market adjusts to news regarding tariffs. Tariffs are a tax imposed on imported goods and services.  Sellers will do their best not to pass the tax to the consumers as that will probably reduce the quantity demanded and potentially reduce their market share to competitors less affected by tariffs.  Therefore, to keep their market share, sellers might absorb some of the impact of the tariffs in the short run waiting for the results of trade negotiations.  However, if sellers believe that the new tariff rates will remain in place for the long run, they might decide to pass the cost of the tariffs to consumers as their profit margins are probably reduced.

    To illustrate, Table 1 shows the monthly percent changes in CPI for all urban consumers, which shows that there has not been a major change in CPI after “Liberation Day.”  The latest figures for July 2025 show that the CPI for all items is 0.2 percent, while food remained unchanged and energy decreased 1.1 percent.  In addition, the un-adjusted 12-month CPI ending in July 2025 shows 2.7 percent for all items, which is within normal ranges, especially coming off a historic high inflation over the last couple of years.  Food items went up 2.9 percent, with the largest increase being in food away from home at 3.9 percent, while energy went down by 1.6 percent. Will this continue over the intermediate- and long-run? Only time will tell.

    Table 1. Percent Changes in CPI for All Urban Consumers (CPI-U): U.S. city average

     Seasonally adjusted changes from the preceding month
    Jan. 2025Feb. 2025Mar. 2025Apr. 2025May2025Jun. 2025Jul. 2025Un-Adjusted 12-month*
    All Items0.50.2-0.10.20.10.30.22.7
    Food0.40.20.4-0.10.30.30.02.9
    Food at home0.50.00.5-0.40.30.3-0.12.2
    Food away from home0.20.40.40.40.30.40.33.9
    Energy1.10.2-2.40.7-1.00.9-1.1-1.6
    Energy commodities1.9-0.9-6.1-0.2-2.41.0-1.9-9.0
    Gasoline (all types)1.8-1.0-6.3-0.1-2.61.0-2.2-9.5
    Fuel oil6.20.8-4.2-1.30.91.31.8-2.9
    Energy Services0.31.41.61.50.40.9-0.37.2
    Electricity0.01.00.90.80.91.0-0.15.5
    Utility (piped) gas service1.82.53.63.7-1.00.5-0.913.8
    All Items Less Food and Energy0.40.20.10.20.10.20.33.1
    Commodities Less Food and Energy0.30.2-0.10.10.00.20.21.2
    New vehicles0.0-0.10.10.0-0.3-0.30.00.4
    Used cars and trucks2.20.9-0.7-0.5-0.5-0.70.54.8
    Apparel-1.40.60.4-0.2-0.40.40.1-0.2
    Medical care commodities1.20.1-1.10.40.60.10.10.1
    Services less energy services0.50.30.10.30.20.30.43.6
    Shelter0.40.30.20.30.30.20.23.7
    Transportation services1.8-0.8-1.40.1-0.20.20.83.5
    Medical care services0.00.30.50.50.20.60.84.3
    *Ended July 2025
    Source: Consumer Price Index Summary, U.S. Bureau of Labor Statistics (BLS)

    References

    Bureau of Labor Statistics. “Consumer Price Index Summary.” Economic News Release. Published August 2025.


    Ribera, Luis, and Landyn Young. “How is the Consumer Price Index Impacted by Trade Talks.” Southern Ag Today 5(34.4). August 21, 2025. Permalink