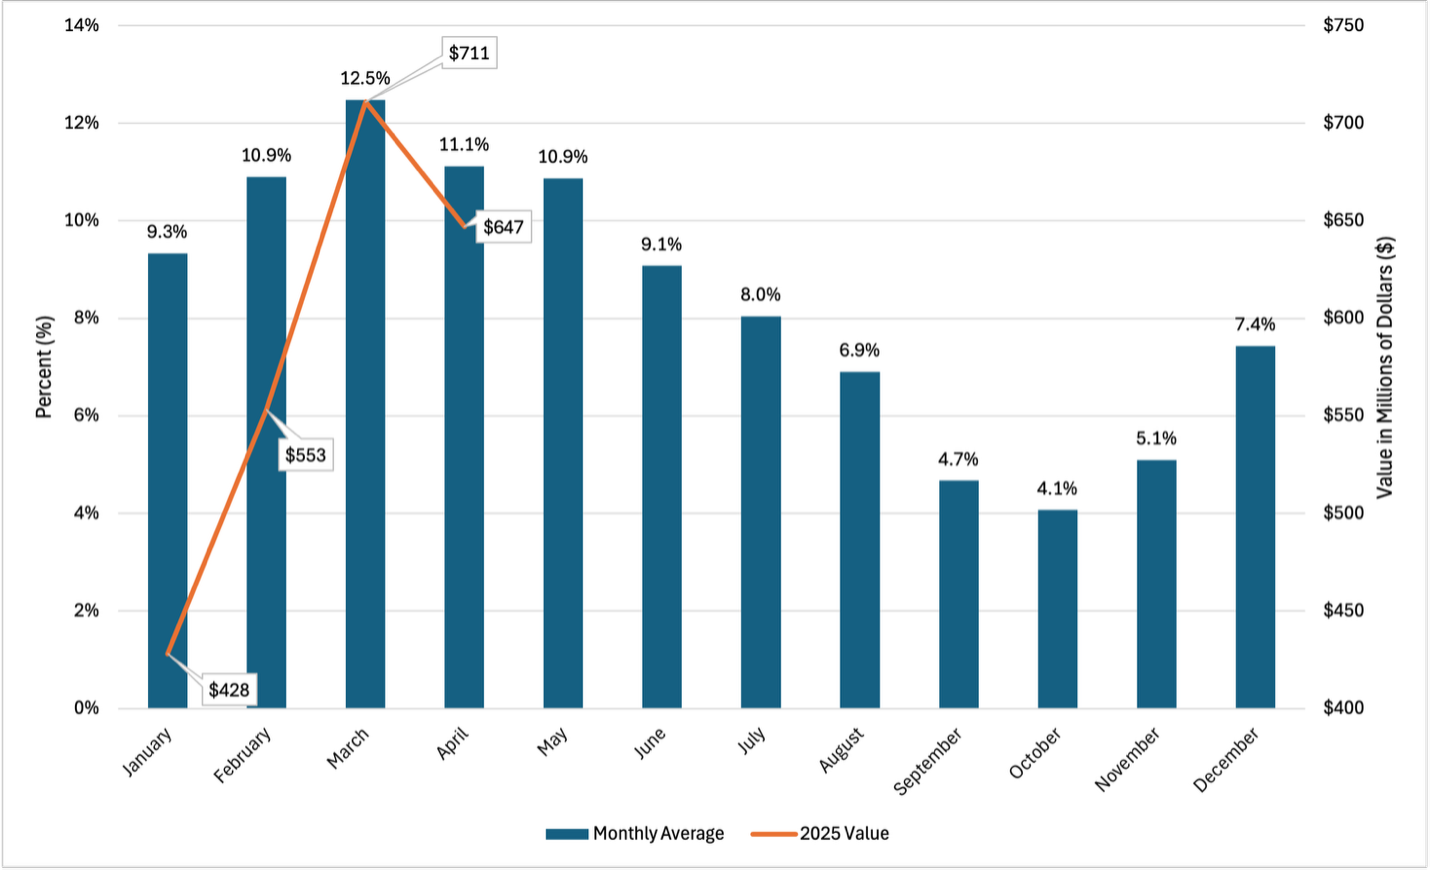
Exports are an important source of demand for U.S. cotton. From 2015-2024, the U.S. has exported an average of 13.6 million bales per year, 85% of annual cotton production (USDA FAS-PS&D). The monthly variation in U.S. cotton exports is tied to production cycles and global demand. In particular, U.S. export variation is directly tied to the U.S. production cycle, and indirectly to the production cycles of other top producing countries who are also major consumers, e.g., China, India, and Pakistan. Figure 1 shows the 10-year average (2015–2024) monthly percent of total annual U.S. cotton export value by month, along with values reported from January to April 2025. Historically, March through May are peak months for U.S. cotton exports, with March (12.5%), April (11.1%), and May (10.9%) accounting for the highest monthly average percent of total annual export value. This may indicate that the weekly export sales pace during the Spring months may be important positive determinants of March and May ICE cotton futures prices. After May, exports begin to decline, reaching their lowest point in October (4.1%). In the final months of the year, export values increase in November (5.1%) and December (7.4%).
Figure 1. Percent of Total U.S. Cotton Export Value by Month, 10-Year Average (2015-2024) and 2025 Value by Month

U.S. Cotton Exports to China, Canada, and Mexico
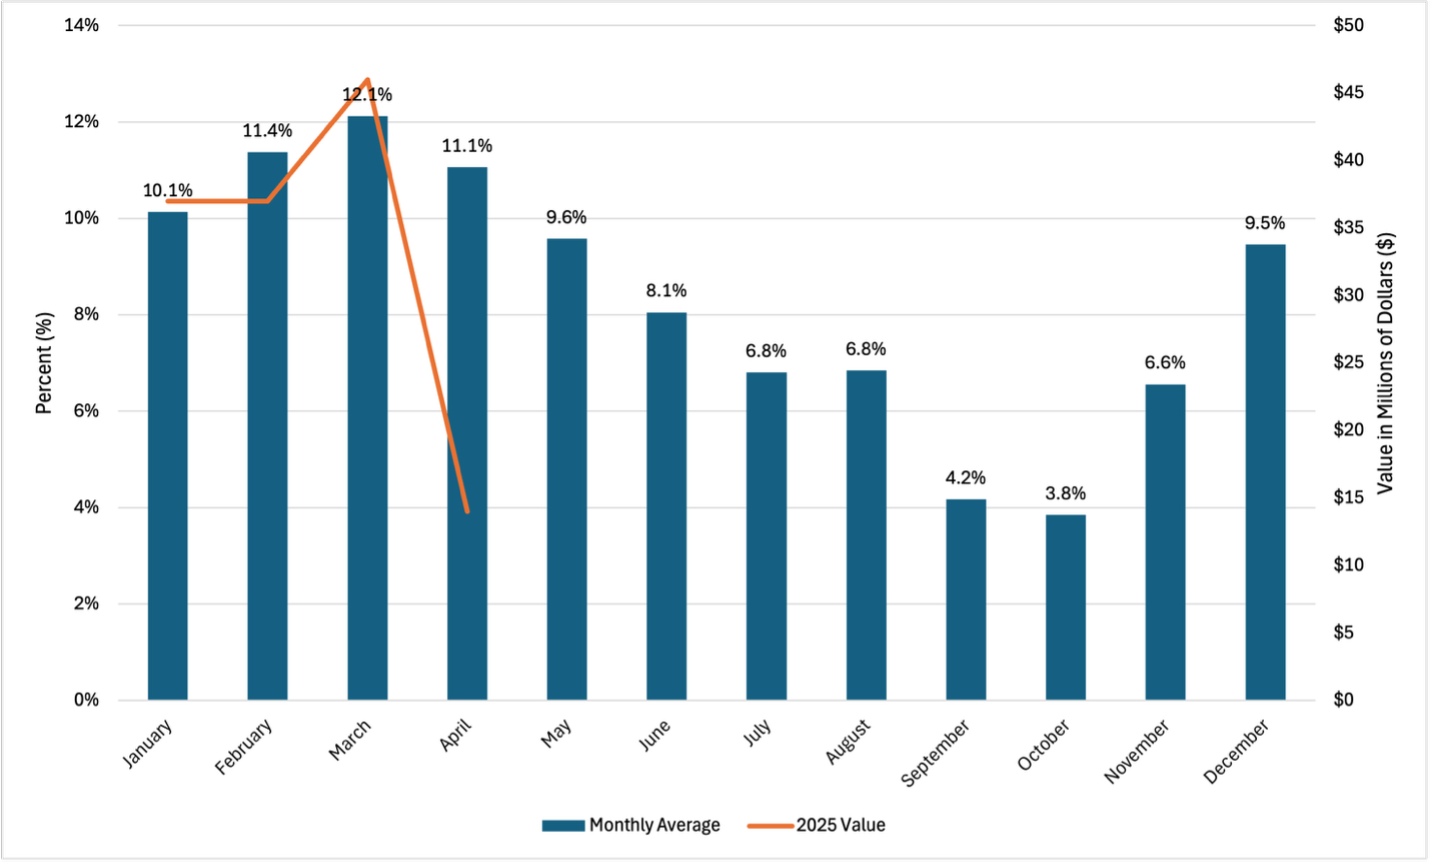
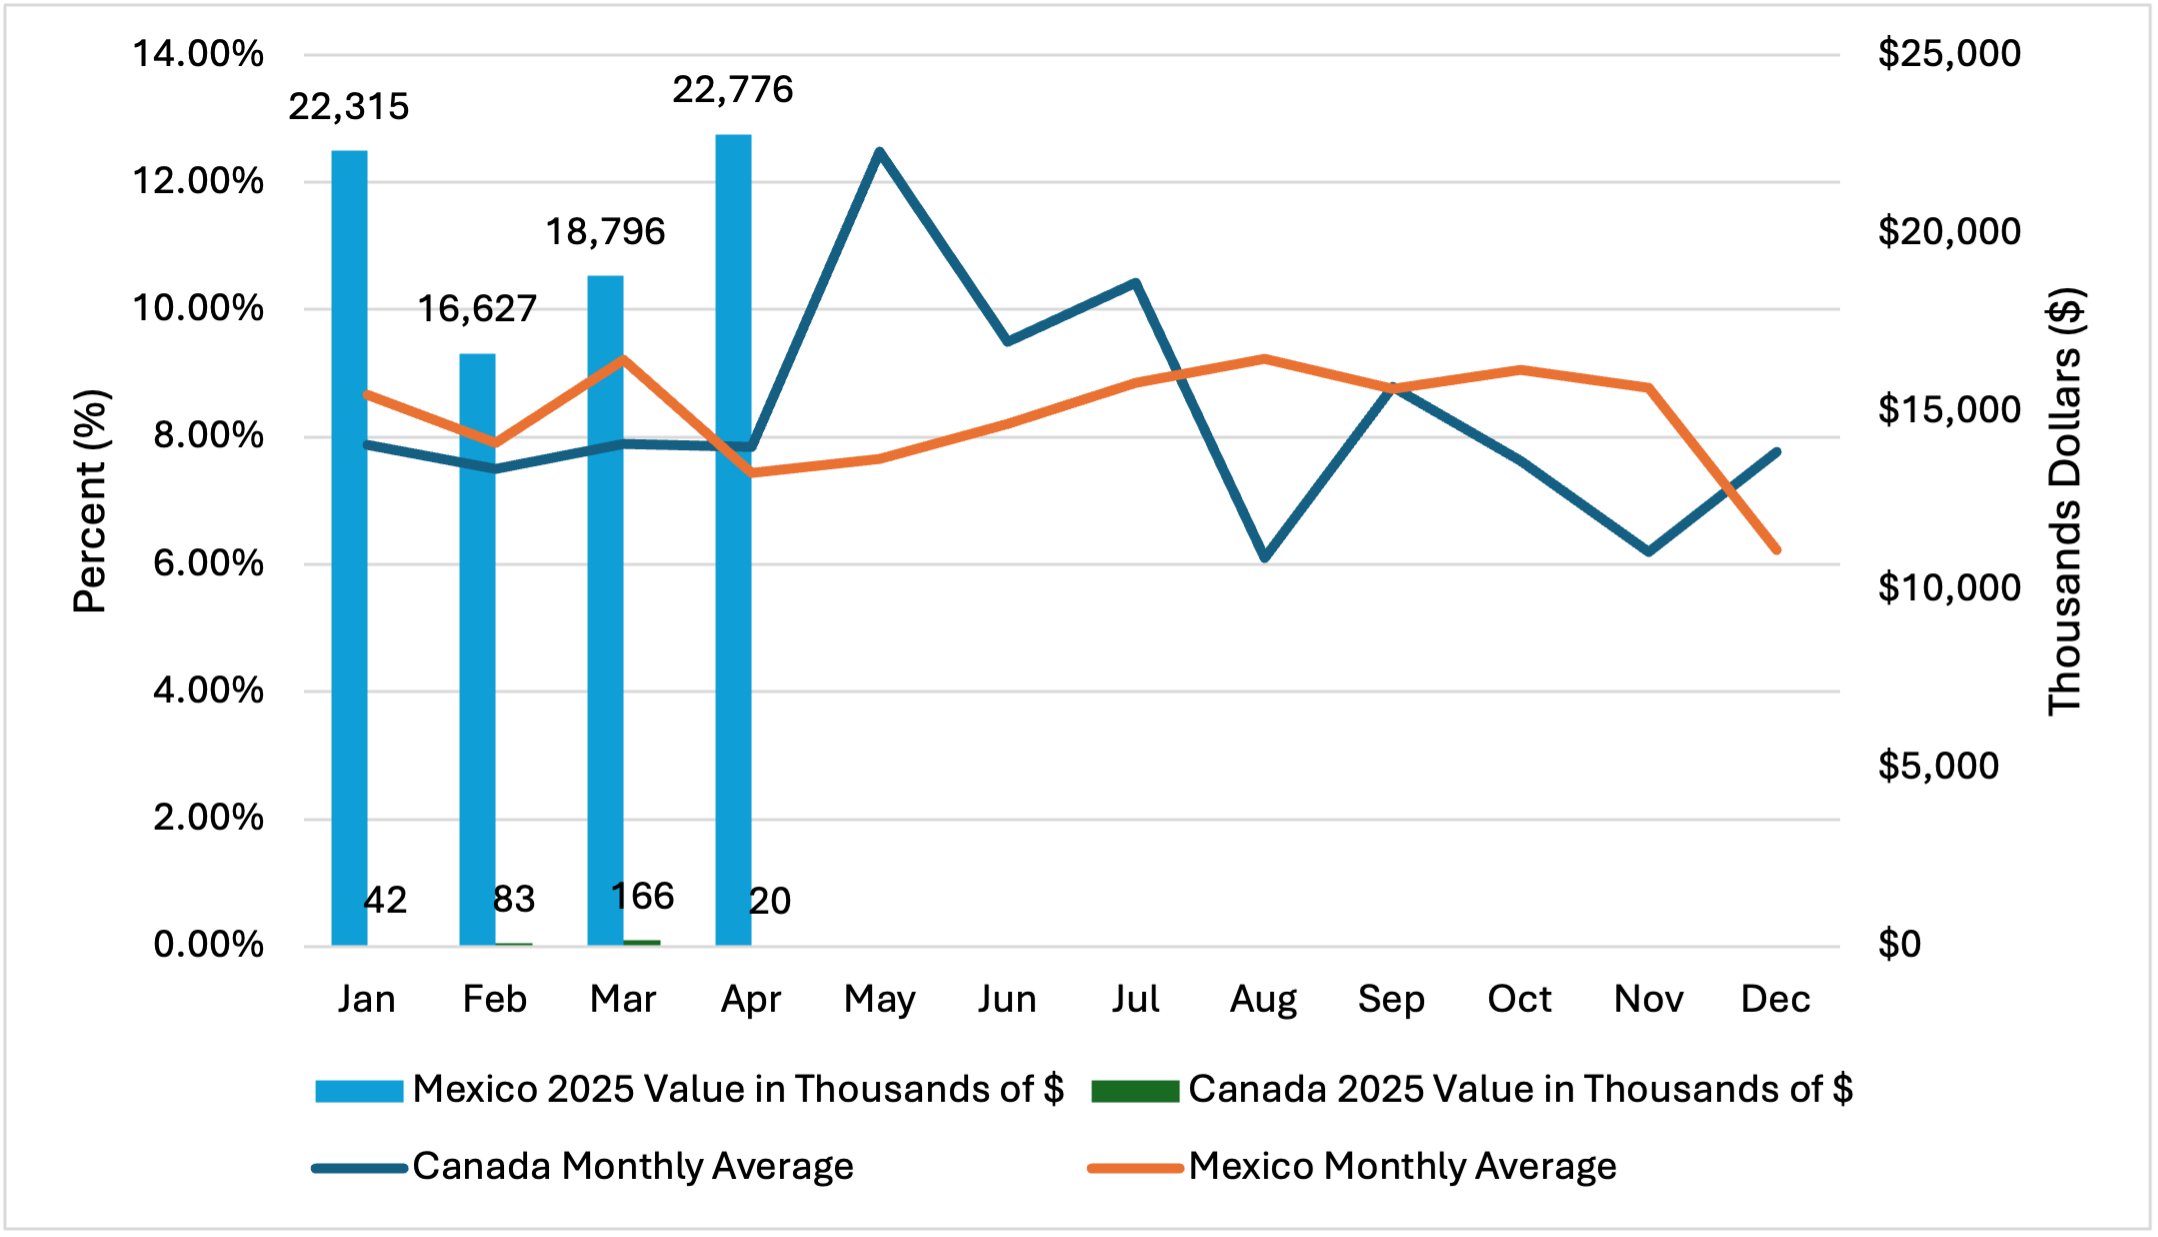
U.S. cotton exports to China follow a similar pattern as the global U.S. exports. Export values peak in March (12.1%) and reach a low in October (3.8%; Figure 2). For Canada and Mexico, export sales are more consistent month-to-month (Figure 3). The stable pattern of U.S. exports to Canada and Mexico is likely due to proximity and the U.S. being the main supplier (although Mexican domestic production would be a competitor with U.S. production). U.S. cotton exports to Canada are significantly lower in quantity and value compared to exports to China and Mexico, but are relatively stable across the calendar year, with minimal variation between months. From January to April, monthly export values remain between 7.5% and 7.9%, with a peak in May. Mexico also has consistent import levels across months, with a slight peak at 9.2% in March and September and the lowest percent in December (6.2%).
Figure 2. Percent of U.S. Cotton Export Value by Month to China, 10-Year Average (2015-2024) and 2025 Value by Month

Figure 3. Percent of U.S. Cotton Export Value by Month to Canada and Mexico, 10-Year Average (2015-2024) and 2025 Value by Month

U.S. Cotton Exports to the Rest of the World (ROW; World minus China, Canada, and Mexico)
U.S. exports to countries other than Canada, Mexico, and China grouped as the Rest of World (data not shown) follows a similar seasonal pattern as global trends displayed in figure 1. Spring marks the strongest months with March (12.9%), April (11.4%) and May (11.5%) accounting for a large portion of annual export value. However, towards the end of the year there is a significant decrease in September (4.5%), October (3.7%) and November (4.3%).
References
USDA Foreign Agricultural Service (USDA FAS) Global Agricultural Trade System (GATS)
Accessed at: https://apps.fas.usda.gov/gats/ExpressQuery1.aspx
USDA Foreign Agricultural Service (USDA FAS) Production, Supply, and Distribution (PS&D) Accessed at: https://apps.fas.usda.gov/psdonline/app/index.html#/app/advQuery
