Author: Matthew Fischer

  • Fewer Cows in 2025

    Fewer Cows in 2025

    USDA released its Cattle inventory report on Friday, January 31st.  This report is the benchmark for data on the number of total cattle in the U.S. and estimates of beef and dairy cows, replacement heifers, and stockers on small grain pastures.  The data is the starting point for estimates of beef production and prices in the future.

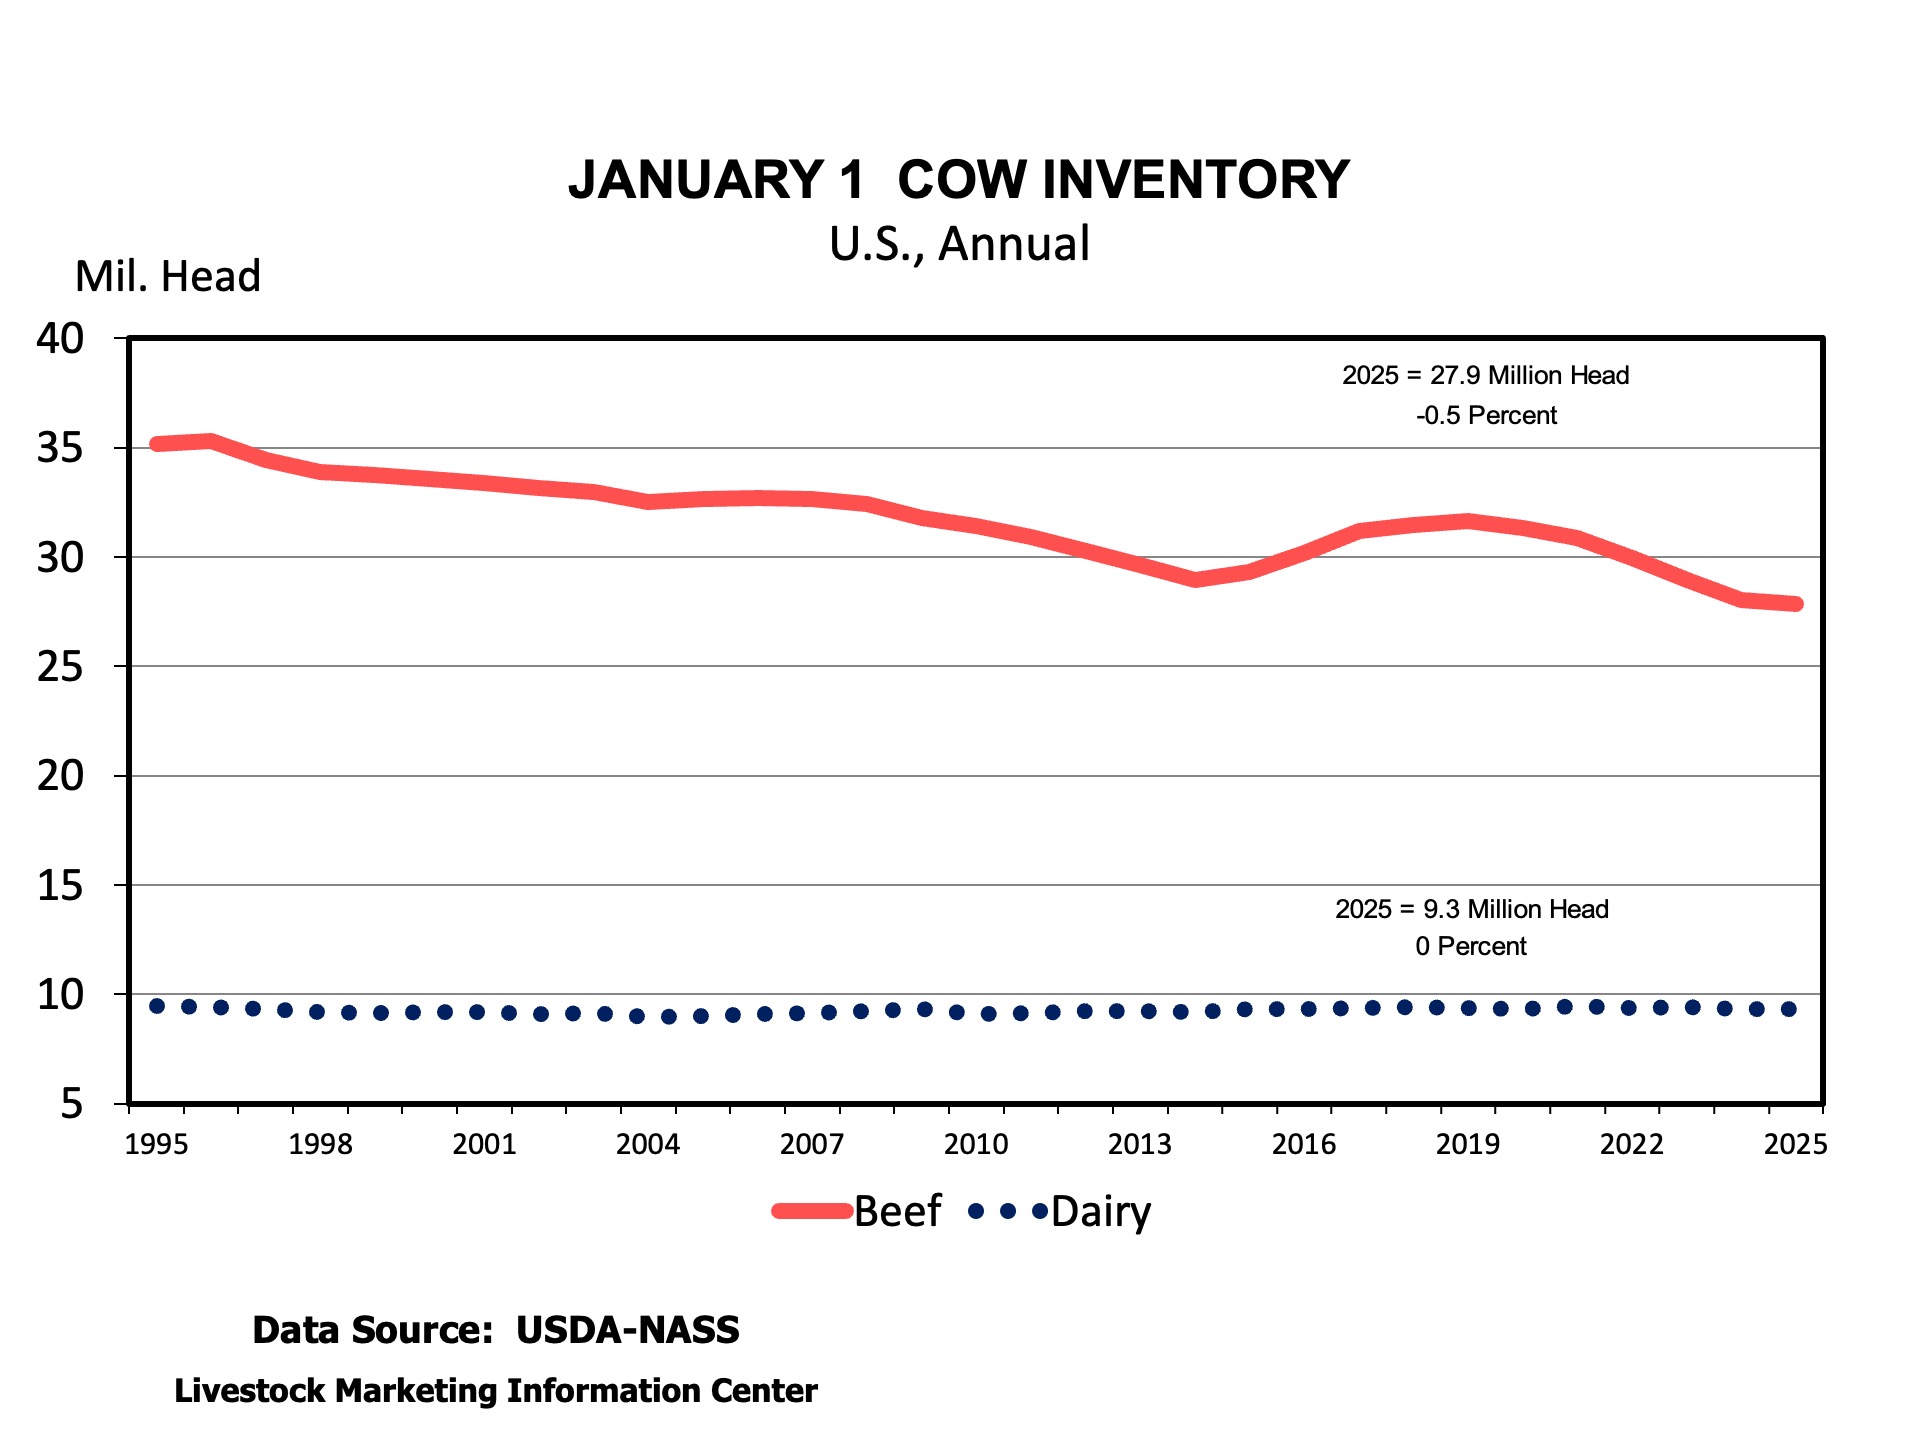
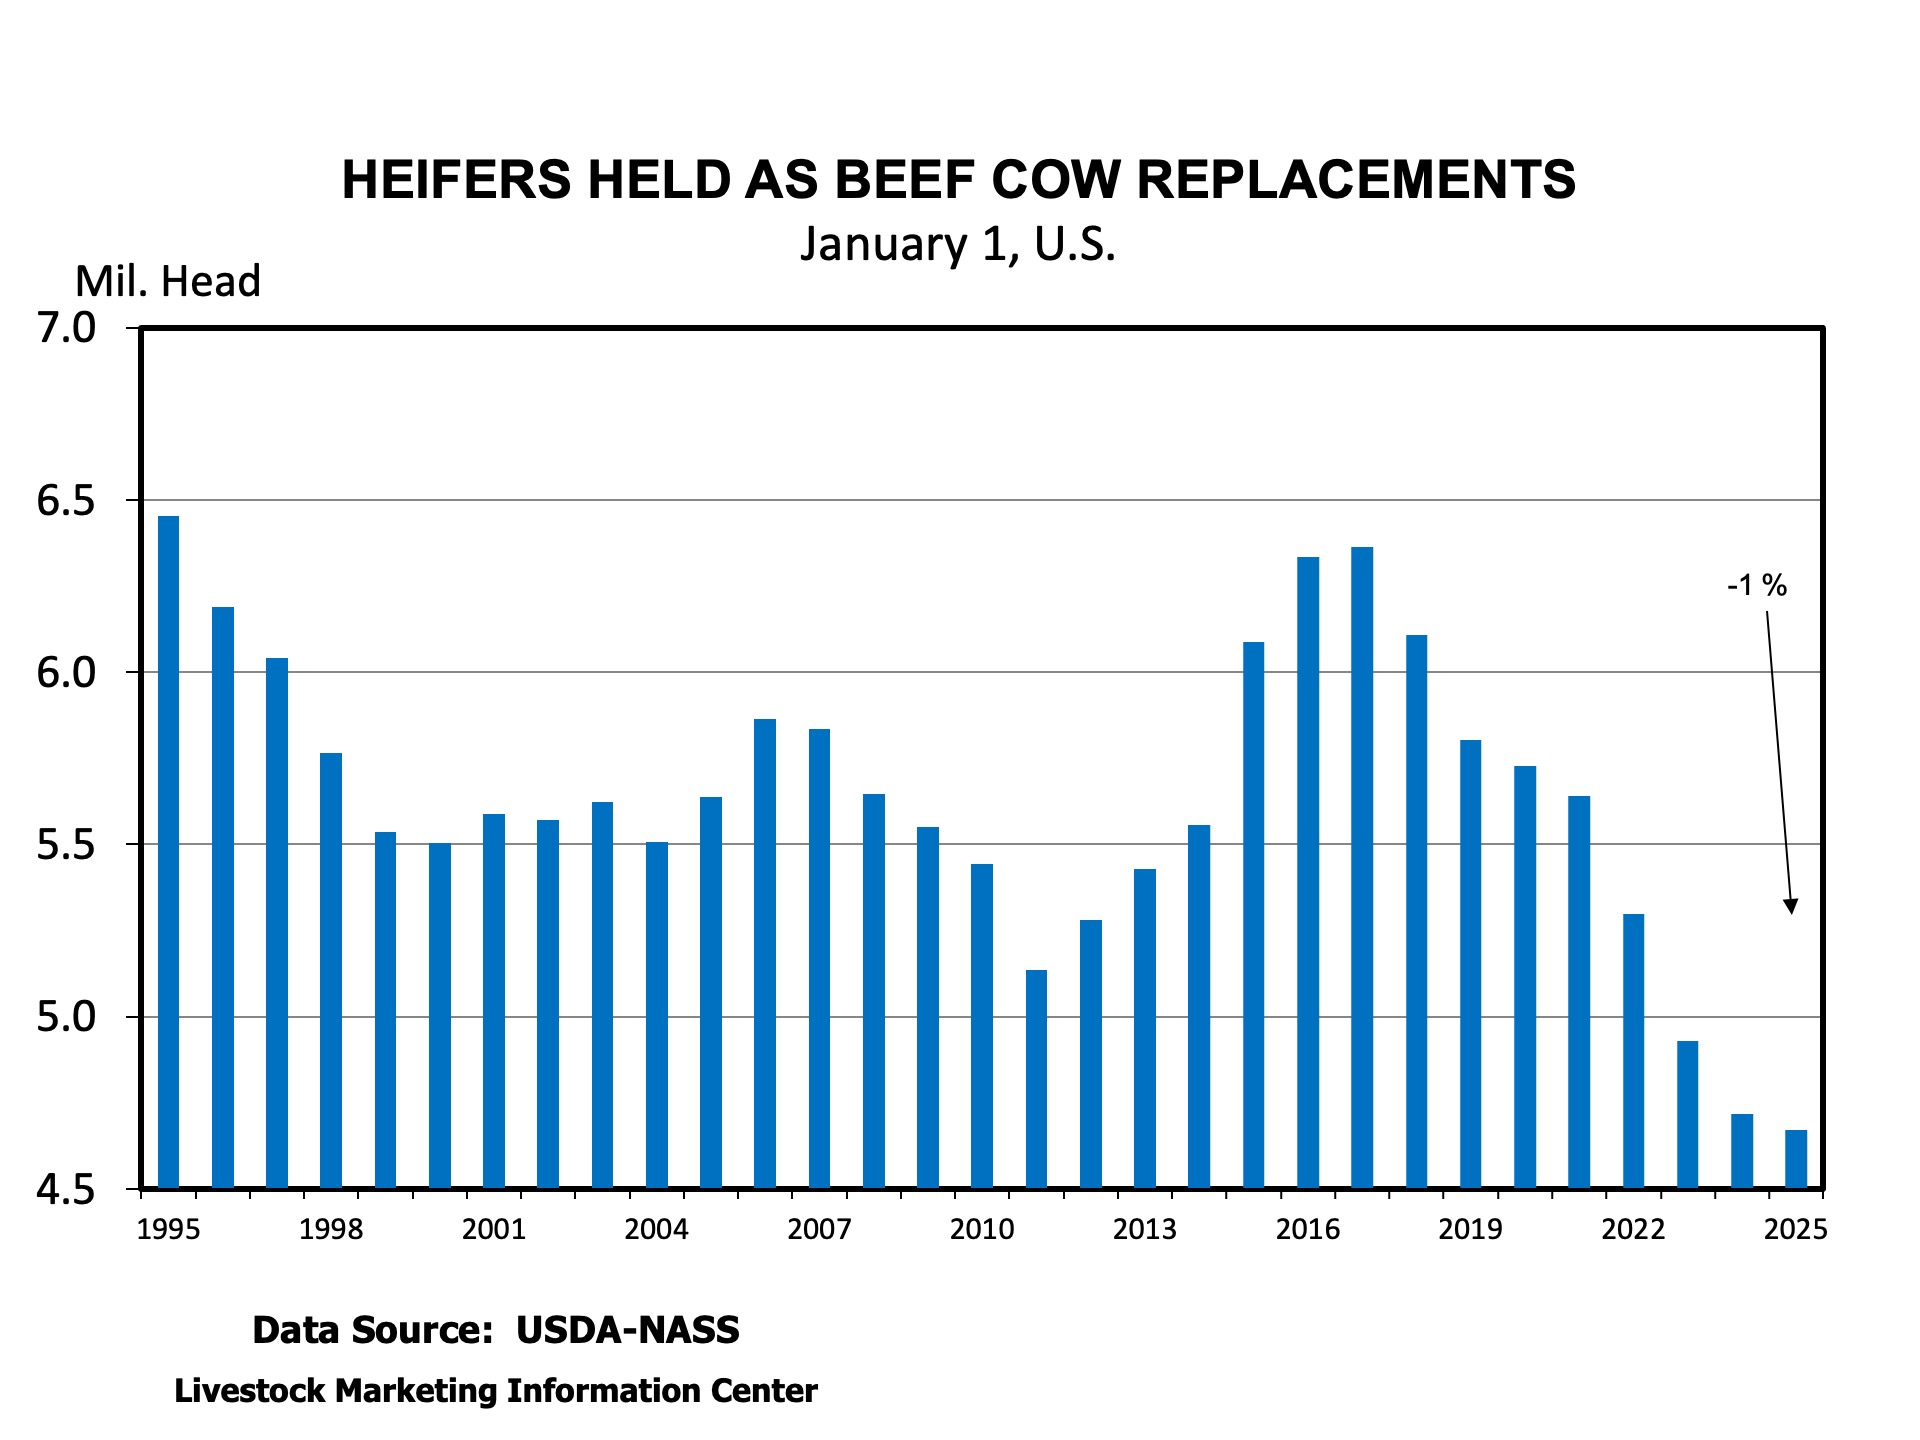
    The big numbers in the report included a January 1, 2025, total cattle inventory of 86.66 million head, down 1 percent from the year before and the fewest since 1951.  Beef cows were down 0.6 percent to 27.86 million head the fewest since 1961.  Heifers for beef cow replacement were down 1 percent to 4.67 million, the fewest since 1949. 

    One of the interesting components of these statistical reports are revisions.  USDA gathers the surveys and other information from other surveys and data reports and revises the previous year’s data if warranted. Sometimes revisions are important and sometimes they are a non-event.  This report had some revisions that are interesting.  Some states were not reported beginning in this survey due to budget cuts.  While producers were surveyed, their numbers were only included in the total U.S. statistics.

    Today’s article includes comments from SAT livestock economist writers to offer a few thoughts on their state and the report across the South.  

    Matt Fischer, Clemson University:

    South Carolina cattle and calves inventory expanded in 2025 from 2024.  Total cattle calves inventory on January 31, 2025, was reported 295,000, up 2% from 2024.  Cow inventory increased in 2025 by 1%, from 156,000 to 157,000.  Unfortunately, USDA did not provide inventory on any other category.  Leaving speculation where the missing 4,000 head would be categorized, hopefully in unreported heifer inventory.  Regardless, South Carolina reported inventory expansion in 2023 only to follow liquidation trend in 2024.  

    Will Secor, University of Georgia:

    Broadly, the report was in-line with expectations. Georgia’s total cattle inventory and its inventory of beef cows declined by about 2% in 2025 compared to 2024. This confirms that there was no herd rebuilding in Georgia last year. However, these declines are smaller compared to last year despite dry weather struggles throughout much of the year. Additionally, the number of beef cow replacement heifers held steady at 85 thousand head. 

    Hannah Baker, University of Florida:

    In Florida, the total number of cattle and calves was unchanged at 1.56 million head. The number of beef cows that calved in 2024 slightly increased by 0.3% (3,000 head) to 865,000 head. Florida is now ranked 10th in beef cattle production (9th last year). Florida’s 2024 calf crop was 1% larger than 2023’s at 770,000 head. The number of beef cow replacements remained unchanged at 115,000 head, unlike last year when we saw a 4% decline. While we don’t see major signs of expansion, we do see signs of stabilization starting in the Florida beef cow herd. 

    Kenny Burdine, University of Kentucky:

    The overall decrease in beef cow numbers was not a surprise. But cow slaughter really pulled back in late 2024 and I do think the decrease in beef cow numbers was smaller than what many expected in the first half of 2024. The 200,000 cow downward revision to 2024 beef cow numbers is also worth noting. My general take on beef cow numbers is that liquidation is slowing, but that is primarily due to reduced culling.

    Beef heifer retention was down by about 1% (also after a downward revision to last year), which was largely expected given the number of heifers on feed. The main point here is that we are still not currently retaining enough heifers to grow the beef herd given a reasonable assumption of cow slaughter in 2025. 

    If weather allows, I think it is very possible that we see more heifer retention during 2025. It’s also good to remind ourselves that the January 1 report is a snapshot of inventory. There are additional heifers in growing programs (grazing, backgrounding, etc.) that could also potentially be bred this year if market and weather conditions remain favorable. And the inverse is also true – not all of those heifers being held for replacement purposes will end up entering the cow herd.

    I don’t know what to make of the decrease in cattle grazing small grains. The calf crop was smaller last year, wheat grazing prospects were late to develop, and I also think a lot of calves moved early because it was dry for much of late summer-early fall.

    NASS estimated our beef cow herd to be down by 38,000 head. This was consistent with what our county Extension agents had been telling me. Land constraints are real in the Commonwealth. We have lost a lot of pasture ground to row crop and development pressures. High land prices do tend to negatively impact cow numbers, especially for young and beginning farmers. I did not expect to see the increase in the estimated number of heifers held for beef replacements. But there was also an estimated increase in the heavy (> 500 lbs) steer and bull categories. I think this speaks to a gradual shift away from cows and towards growing operations in Kentucky.

    Andrew Griffith, University of Tennessee:

    I expected a larger decline in the beef cow herd and beef heifers held for replacement given the quantity of heifers that went on feed and the fact that cow slaughter was still a large number. Beef cow slaughter was certainly much lower in 2024 than in 2023, but beef cow slaughter in 2023 was extremely large. Thus, this was a little surprising to me. As far as state of Tennessee, I was surprised that the beef cow herd declined by 9,000 head while the number of heifers remained the same. Somehow, we maintained the same calf crop compared to last year despite having fewer cows. I do have some concerns about the survey response rate over time.

    Josh Maples, Mississippi State University:

    Total cattle inventory in Mississippi was unchanged at 810,000 head. The calf crop was also reported unchanged at 345,000 head. I was a little surprised the calf crop was not lower in Mississippi. The big adjustment this year was the change in data reported. Mississippi is one of the 19 states that were dropped (due to USDA-NASS budget cuts) from individual state reporting for important categories such as beef cows, replacements, etc. Producers were still surveyed, but their responses were aggregated into the total cattle number presented. 

    David Anderson, Texas A&M University:The beef cow herd increased about 60,000 head or 1.5% from January 1, 2024.  But, this larger cow herd is the result of a downward revision to last year’s cow herd.  I often think it is helpful to look at the data over a longer period and doing so shows that the herd is smaller than 2 years ago.  So, I don’t think the report is too surprising thinking about it in that context.  Fewer replacement heifers were retained according to the responses.  The 4.075 million beef cows reported are the fewest since 1959 except for the 3.9 million in 2014 following the drought of 2010-2013.  

  • Inventories, Weather, and Local Hay Markets

    Inventories, Weather, and Local Hay Markets

    It often seems that hay markets and prices are strictly local but, supplies and weather around the country can have far reaching effects.  Understanding inventory in the hay market can be as easy as tagging a new calf with an unhappy mama.  However, there is some data that can help, at least, provide an understanding of regional and national hay production.  Depending on the forage base (cool season perennial, warm season perennial, or warm/cool season annual plantings), rain and fertility can be the primary contributors to yield expectations.  Not to discount the impacts of natural disasters and insects.  Understanding the total inventory on hand entering the production season, consumption of hay stocks, and impact of exporting hay stocks can help in forming some price expectations and suggest some earlier or later purchases.

    Expanding and contracting drought conditions plagued the southern region during production periods for warm season perennials and annuals.  Hay production regions in the south experienced some relief from hurricanes and tropical storms.  Depending on production schedules Figs. 1-3 illustrates the impact of drought conditions on summer forages.  

    Figure 1.

    Figure 2.

    Figure 3.

    May 1 U.S hay stocks and disappearance steadily decreased starting in 2020 (Fig 4).  However, coming out of winter in 2024 hay stocks rebounded to 2020 stocks level.  Hay disappearance is largely driven by hay feeding, winter’s length and severity, and the size of the cow herd. Disappearance started decreasing in 2020 signaling reduced total hay needs.  In 2024, use of hay returned to 2020 use levels.

    Figure 4.

    It often surprises people to learn that the U.S. exports a significant amount of hay, largely alfalfa and other high value specialty hays.  The US hay export market moving three-year average valuation is $1.51 billion.  As of 2023, the export market was valued at $1.34 billion.  Total hay exports have trended downward since 2022, mainly driven by weak demand from China.  The top four countries that import U.S hay stocks are China, Japan, Saudi Arabia, and South Korea.

    So, are we just to expect the market to behave like 2020 due to stock levels?  A notable difference in the southern region will be the potential production impacts from summer droughts.  Hay prices are beginning to decline in parts of Texas due to abundant production from this year’s rains.  Hay markets do represent climate dynamics with a few large weather market issues thrown in.  The storm forecasted for later this week could bring rains for grass growth in drought affected regions of the South.  But it’s very late in the growing season for much hay production.  USDA will report a hay inventory estimate in December which will provide a good stock on hand estimate, so we will wait on that early Christmas present.   


    Fischer, Matthew. “Inventories, Weather, and Local Hay Markets.Southern Ag Today 4(37.2). September 10, 2024. Permalink

  • 2022 Census of Agriculture: Review of Southern Hay Prices

    2022 Census of Agriculture: Review of Southern Hay Prices

    On February 13th, USDA-NASS released the 2022 Census of Agriculture report.  This report provides a comprehensive agricultural overview for each state and county. The report provides information on farm operations, livestock inventory, milk production, commodity production and value of commodity production.  Hay (including alfalfa) production ranked in the top three for value of crop commodity production in six of the thirteen Southern region states.  Those states were Virginia, Kentucky, Tennessee, Texas, Alabama, and Oklahoma. 

    The census is conducted and published every 5 years and is loaded with useful data about U.S. hay production.  In addition to this 5-year look at hay production, USDA Agricultural Marketing Service (AMS) report provides weekly hay prices in many markets and USDA National Agricultural Statistics Service reports annual production, hay stocks, and monthly prices received by farmers.   This wealth of information can aid in pricing knowledge.  

    Drought conditions in recent years has brought attention to hay and forage which is an important input for livestock production.  There are challenges in the valuation of a hay crop.  Given the differences in form, weight, quality, species of forage, and regional availability.  Therefore, no reference price is established.  There are market reports provided by USDA that provide some market data but are geographically limited in the south. The Census of Agriculture reports state level data. 

    All states in the southern region reported price data for hay, excluding alfalfa.  Fig. 1 contains the reported price per ton for hay, excluding alfalfa for the 2022 Census of Agriculture.  To better explain the price of hay, $/ton to $/bale will be assumed to be a 4X5 round bale at 880 lbs.  If the average price was $142/ton, then the bale price was $62.  Fig. 2 illustrates the reported price per ton for alfalfa for the 2022 Census of Agriculture.  As previously stated, $/ton to $/bale conversion is the same calculation.  The average price per ton was $229/ton, which caclulates to $101/bale.  

    Figure 1.  Hay Price per State in the 2022 Census of Agriculture.

    Source: https://www.nass.usda.gov/Publications/AgCensus/2022/index.php

    Figure 2.  Alfalfa Price per State in the 2022 Census of Agriculture.

    Source: https://www.nass.usda.gov/Publications/AgCensus/2022/index.php

  • Feeder Bulls Discounted to Feeder Steers?

    Feeder Bulls Discounted to Feeder Steers?

    Long held tradition (and fact) states that feeder bulls will be discounted to feeder steers, obvious reasons.  Does this always occur and is it consistent?  It depends.  Observing USDA-AMS sale barn data from South Carolina between 2009-2023 for September marketings, when many calves are sold in the state, some interesting points appear.  Fig. 1. contains the movement of the price discount, or spread, between bulls and steers for two different weight classes, 400-499 lbs., and 600-699 lbs.

    Fig. 1. 

    Source: Livestock Reports – South Carolina Department of Agriculture. (n.d.). 

    Using the price data between 2009-2023 three points are noticed.

    • The 2014-mid 2015 had a significant increase in the discount rate from steers to bulls for the heavier calves.
    • 2021, COVID-19 timeframe, recorded a collapse in the spread discount between lighter and heavier feeder calves.
    • Moving from 2021 to 2023, with higher marketing prices year by year, the discount spread increased. 

    What to expect?  For feeder calves in the 400-499 lbs. weight class the average discount for feeder bulls to feeder steers was $5.43/cwt with a minimum discount of $1.25/cwt and a maximum discount of $10.00/cwt.  The feeder calves in the 600-699 lbs. weight class the average discount for feeder bulls to feeder steers was $12.30/cwt with a minimum discount of $6.07/cwt and a maximum discount of $26.60/cwt.  The bull calf discount changes based on overall market conditions and feeding profitability.  High prices may lead to a larger discount in some cases, see 2014 and 2015, due to the production risk on these calves.

    So does this help?  A discount of feeder bulls to steers does exist for the 2009-2023 marketings.  In none of the years did the discount disappear but, the discount varied widely.  The spread on the discount between heavier and lighter calves can depend on prices movements toward or away from historical averages and impacts on cattle markets outside the expected. 


    Fischer, Matthew. “Feeder Bulls Discounted to Feeder Steers?Southern Ag Today 3(49.2). December 5, 2023. Permalink

  • Are You Buying Hay For The Winter?

    Are You Buying Hay For The Winter?

    As the 2023 hay season comes to an end for much of the South, the last cuttings are being baled and balers are being parked for the year.  Loader tractors will have some rest before it’s time to start feeding out hay.  In some parts of the South, feeding has been going on for some weeks and drought stopped hay production.  When purchasing hay here are some questions to consider:  How much hay do I need to make it through the winter?  How much can I spend on hay?  These questions can be answered by planning.  Working through a budget for the operation will show the potential cost incurred by various situations, whether it is a change in cost or a change in the amount needed.

    Hay Quantity.

    Hay is measured primarily by two methods: by the bale or by the ton. Most commonly hay marketing occurs by the bale. When planning on hay needs for the winter or working through a budget, focus on the tonnage required.  Accounting for hay needs by the ton will allow for pricing comparison across various bale sizes, assuming constant moisture levels.  Table 1 provides a standard bale weight estimate based on bale size.  Using tons as a measurement will allow for livestock consumption based on pounds consumed per day.  This method does require some pencil work but will provide more efficient use of hay resources.

    Source: D. Hancock, Bale Weight Estimation Table July 2011

    Hay Quality:

    Here is the most common hay quality test: “It’s got good color and smells good, must be good.”  While I’m not going to disagree with long-standing tradition, there is value in the marginal investment of requesting fertilization records/soil sample data, herbicide records, and a forage sample.  Is this worth the trouble?  It will depend on the willingness to minimize risk.

    Fertilization and soil sampling records will illustrate that the forage grown had fertility management applied correctly.  The presence of weed load in hay can be a problem.  To safeguard against this, herbicide records will show that unwanted seeds/plant matter were managed.  A forage sample provides the best picture of the quality of the purchased hay.  The sample results will also provide insight into additional nutritional requirements.  Knowing the quality can also help fine-tune feeding to meet the nutritional needs of the cows.

    In closing, feeding livestock during low/no grazing periods adds to the cost of the operation.  More information can allow for the efficient use of operation dollars and decreased cost in herd health/losses. Lastly, to give some “cud to chew on,” consider the choices typically made when purchasing a commodity blend supplement feed.  Would you purchase a load of commodity blend feed based on a guess of how much it weighs?  Or would you request a weigh ticket to verify amount purchased?  How about the quality of the feed?  It helps to know what the nutritional value is to make the best decision.  All of this takes extra work; however, management of input cost is a great tool to ensure profit potential.