Author: Max Runge

  • Variety Selection Resources

    Variety Selection Resources

    Choosing the best variety of seed has always been important for producers, but in 2025 this decision will likely carry more weight. With the squeeze of lower commodity prices and higher input prices, variety selection that is best suited for each producer’s growing conditions is a factor that affects the bottom line. Time spent evaluating the numerous varietal choices this time of year will be worth the time and effort.

    There are numerous sources to gather information about the varieties for an individual grower’s situation. It’s worth pointing out that there isn’t a “one size fits all” strategy to select the best variety. Utilizing more than one source is recommended but be cautious not to seek too many sources as this may add to the confusion.  Here are some resources that can be utilized in making a varietal selection.

    The variety selection process should start and end with your knowledge and experience with your fields and growing conditions.  Good records help to provide valuable information and fill in some details that may be forgotten over the growing season. It’s important to try to match varieties to your fields. For example, low lying fields may have more fertile soil but could have wet areas, and fields on hillsides may not have the yield potential of other fields.

    Other sources of information for variety selection are neighbors that have similar growing conditions, seed company representatives, and farm supply stores. Keep in mind that some of these resources may focus heavily on the products they represent or profit from and, therefore, could be biased in their recommendations. Developing productive relationships with all of these individuals can lead to better and more confident variety decisions.

    The most important source of information is from the variety testing programs at land grant university systems. Most land grant university research and extension programs have variety testing trials that provide unbiased results. These variety tests are usually in strategic locations across the state to provide growing conditions that are similar to growers in the area. While not all growing conditions can be represented in official trials, they could provide valuable information. Check with your state’s land grant research/extension programs to find out about variety trial information in your area.

    There are two kinds of trials that universities may be involved with, as seen in Figure 1 Variety Tests. 

    Figure 1. Variety Tests*Official Variety Trial (OVT) Small PlotsOn-Farm
    Conducted by:OVT ProgramExtension 
    LocatedResearch StationsGrower Fields and Research Stations
    Plot SizeSmallLarge
    # of Varieties More (up to 50+)Fewer (less than 15)
    TypesReleased & Experimental Mostly Released
    ReplicationAlwaysNot always
    Statistical Analysis AlwaysNot always
    EquipmentResearch Commercial 

    There are advantages and disadvantages to both the Official Variety Trial (OVT) Small Plots and On-Farm trials. The replication and statistical analysis, along with more experimental varieties, are advantages of the OVT Small Plots. The On-Farm plots are larger and managed on a scale closer to commercial production practices.  It’s also important to consider multiple years of results and not base the decision on one year’s performance. Also, look at as many details of the trial as possible. What were the fertility levels of the plot, and how much fertilizer was applied? What other pesticides were used and at what rate? What were the growing conditions? Were the climatic conditions stressful, if so, how did that affect yields?

    In summary, variety selection is crucial as we are looking at an economically challenging growing season in 2025. Match the varieties to your growing conditions as best as possible. Time and effort spent now in selecting varieties for your farm is one of the best investments that a producer can make. 

    Resources: 

    *Figure 1. Adopted from OVT Small Plots vs On-Farm FAQ https://aaes.auburn.edu/variety-tests/ovt-frequently-asked-questions/

    Auburn University Official Variety Testing – https://aaes.auburn.edu/variety-tests/


    Runge, Max. “Variety Selection Resources. Southern Ag Today 5(4.1). January 20, 2025. Permalink

  • Almost Time to Think Turkey

    Almost Time to Think Turkey

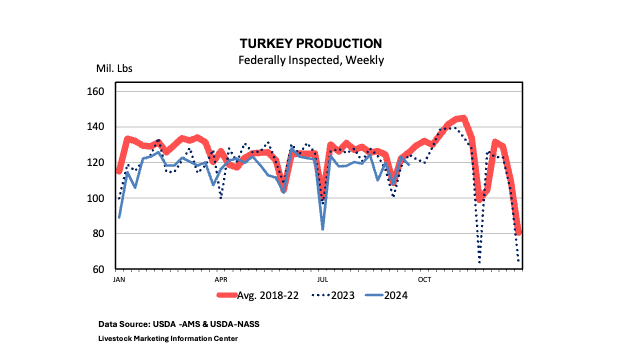
    We are six weeks away from 2024 Thanksgiving but it’s not too early to think about the meals that may include turkey. Here is some pertinent turkey information as we are preparing for the end of the year celebrations. One of the first considerations is production, a key part of turkey supplies. The 2024 federally inspected turkey production (weekly), is shown in Figure 1. Year to date, turkey production is running 3.29% below 2023 levels and 6.44% less than the five-year average (2018 – 2022). While lower production is usually a cause for price concerns, that is not likely to be the case this year as turkey prices have remained lower than 2023 throughout 2024.

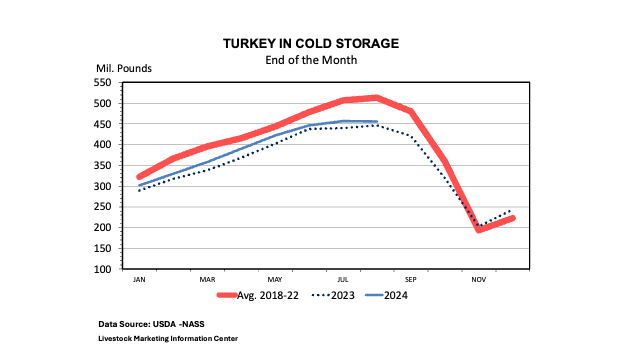
    Turkey in storage is another important consideration in turkey supplies for Thanksgiving and Christmas holidays. As seen in the in Figure 1, turkey processing occurs throughout the year with an increase in late October and early November. Cold storage is important in managing the supply of turkeys and to ensure that adequate supplies are available for the end of the year demand. Figure 2 indicates that all turkey in cold storage for 2024 is 2.1 percent higher than in 2023, but 8.9 percent less than the 2018 -2022 average. Digging a little deeper in the cold storage data indicates that while there are 1.1 percent fewer tom turkeys, whole hens in cold storage are up 4.4 percent.  

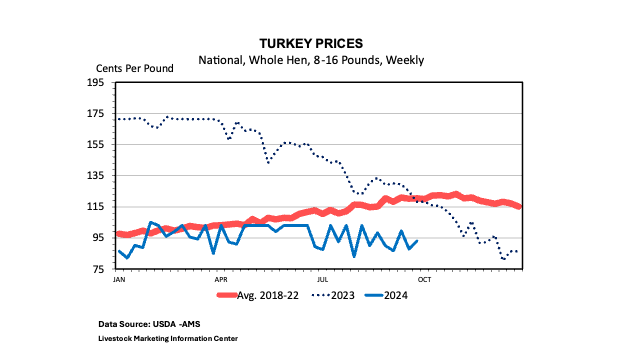
    With 2024 turkey production running only slightly lower than last year’s production and quantities of frozen turkey in cold storage above 2023 levels, what will that mean for turkey prices in 2024?  The 2024 fourth quarter wholesale price projection for an 8 – 16 pound frozen turkey hen is forecast to be $0.95 cents per pound, wholesale. This is 5.75 % less than 2023 prices ($1.01) and 47% less than fourth quarter prices ($1.78 ) in 2022. Like usual, there will be plenty of turkeys for Thanksgiving dinner.  But, you might look for deals and specials and shop early to make sure you get just the right bird for your holiday table. In conclusion, it’s looks to be a good year to enjoy turkeys for the holidays.  

  • Are the Pre-Season Polls (Crop Production Reports) Accurate?

    Are the Pre-Season Polls (Crop Production Reports) Accurate?

    USDA NASS has released the equivalent of college football’s pre-season poll, which is the August Crop Production report (released August 12). The Crop Production report provides an estimate of acreage, area harvested, yields, and production for the major row crops in the U.S.  Additional crop production reports (polls) will be released in September, October, and November. The Annual Crop Production report (final poll) will be released in January.

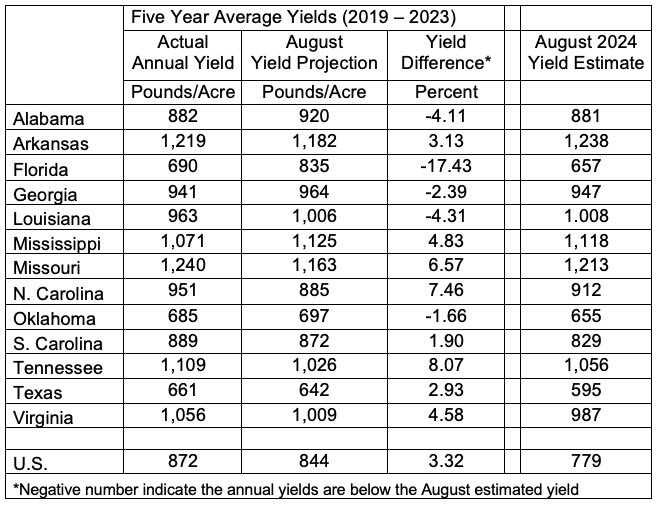
    For the states represented in the Southern Ag Today area, estimates for cotton yields garner a lot of attention.  How accurate are these August estimates to actual yields? Table 1 shows the actual five-year average (2019 – 2023) annual cotton yield compared to the five-year average of the August yield projection. 

    Table 1.  Annual Cotton yield vs. August estimates yields (5-year averages)

    There is a range in the percent difference in the actual yields versus the August estimates. The actual five-year average ranges from 17.43 percent below the five-year estimated August yield (Florida) to just over 8 percent higher than the August estimate (Tennessee).

    Like pre-season polls, the estimated yields can vary from the actual annual yield for numerous reasons.  Wind and excess rain from tropical weather events cause the largest decline in yields from the August estimate to the actual yields. While we won’t know for several months what our actual yields are (or our favorite team’s record), the pre-season projections provide some insight.

    Reference: USDA NASS Crop Production

    https://downloads.usda.library.cornell.edu/usda-esmis/files/tm70mv177/4b29cz98b/9593wm26b/crop0824.pdf


    Runge, Max. “Are the Pre-Season Polls (Crop Production Reports) Accurate?Southern Ag Today 4(35.3). August 28, 2024. Permalink

  • Milk Cows in the Southeast 

    Milk Cows in the Southeast 

    Included in the biannual Cattle report is the number of milk cows that have calved in the U.S. and by most individual states. The number milk cows that have calved are holding steady at the national level but individual states in the Southeast show variations in inventory (Table 1). Florida is the only state that shows an increase in milk cows that have calved, while Arkansas, Louisiana, and South Carolina had double digit percentage losses. The thirteen Southeastern states account for 11.33 percent of the milk cows that have calved in the U.S. Texas has the largest number of milk cows in the Southeast and has the fourth highest milk cow inventory in the U.S.

    Table 1. 2023 2024Percent of
    (1,000 head)(1,000 head)previous year
    Texas65063598
    Florida9298107
    Georgia929199
    Virginia676699
    Kentucky454396
    North Carolina393897
    Oklahoma393897
    Tennessee262596
    South Carolina9889
    Louisiana8788
    Mississippi66100
    Arkansas4375
    Alabama22100
    U.S. 9,397.509,356.80100
    Source: https://usda.library.cornell.edu/concern/publications/h702q636h

    In addition to inventories, milk production per cow is a crucial factor for the dairy industry. Using the 2023 annual production estimates from USDA Quick Stats database, Texas is the only Southeastern state that has a per cow milk production average that is higher than the U. S. average of 24,117 pounds of milk per head, as seen in table 2.

    Table 2.
    Annual Milk Production
    Pounds/Head
    TEXAS25,802
    NORTH CAROLINA23,526
    GEORGIA22,275
    VIRGINIA20,882
    KENTUCKY20,333
    FLORIDA20,313
    TENNESSEE18,680
    SOUTH CAROLINA18,500
    OKLAHOMA17,692
    ALABAMA14,000
    LOUISIANA12,625
    MISSISSIPPI12,333
    ARKANSAS11,000
    U.S. Average24,117
    Source:  https://quickstats.nass.usda.gov/

    Milk production in the U.S. is increasing over the long term but, it’s coming from regions other than the Southeast. For more than a year, dairy producers have suffered from disastrously low milk prices and low returns.  The result of low milk prices has been declining dairy cow numbers, milk production per cow falling below year before levels, and reduced total milk production in some months reversing the long term trend of increasing milk production.  


    Runge, Max . “Milk Cows in the Southeast.” Southern Ag Today 4(17.2). April 23, 2024. Permalink

  • 2024 Prospective Plantings for Southern Ag Today States

    2024 Prospective Plantings for Southern Ag Today States

    The United States Department of Agriculture’s (USDA) National Agricultural Statistics Service (NASS) released its annual Prospective Plantings report on March 28, 2024.  This report typically isn’t as exciting as college basketball’s March Madness, but the Prospective Plantings report does supply estimates of acreage that affects the agricultural markets and provides the basis for numerous discussions for the upcoming growing season. 

    What does the 2024 Prospective Plantings report show for the Southern Ag Today States? The following tables show the prospective planting acreage for the Southeastern states, with the 2023 planted acres and the predicted 2024 acres (and 2024 acres as a percentage of the 2023 acres). The states are listed in rank from most to least 2024 acres.

    Table 1 indicates the corn acres that are projected for the Southeastern states. Oklahoma is the only southern state that shows an increase in 2024 corn acres while Arkansas and Mississippi are predicted to plant about 25% fewer acres. While the Southeastern states are expected to plant about 10% of the U.S. corn acres, this is 27.67% of the reduction in U.S.2024 corn acres. While some of the lost corn acres in the Southeast are shifted to soybean and cotton, there are some acres that are not reflected in the 2024 major crop plantings.

    Overall, the U.S. is predicted to plant 90 million acres in 2024. This is five percent lower than 2023 acres and slightly lower than industry expectations, resulting in a sixteen-cent rally for December 2024 corn futures prices.

    Table 1.  2023 Acres and Prospective Plantings for 2024, Corn (1,000 acres) 
     
    2023
    2024 Prospective
    Acres% of 2023
    Texas2,5002,10084
    Kentucky1,6001,55097
    Tennessee94093099
    N. Carolina95089094
    Arkansas85062073
    Mississippi79059075
    Louisiana70056080
    Virginia49547095
    Georgia48541085
    Oklahoma390400103
    Alabama33031094
    S. Carolina36530082
    Florida908089
    U.S.94,64190,03695

    Upland Cotton prospective plantings are included in Table 2. U.S. Cotton acres are expected to be four percent higher than in 2023. Half of the Southeastern states have double-digit percentage increases, and the remaining states are near the previous year’s cotton acres.

    Table 2. 2023 Acres and Prospective Plantings for 2024, Upland Cotton (1,000 acres) 
     
    2023
    2024 Prospective
    Acres% of 2023
    Texas5,5505,50099
    Georgia1,1101,10099
    Arkansas510540106
    Mississippi400500125
    Oklahoma420500119
    Alabama380430113
    N. Carolina380390103
    Tennessee265300113
    S. Carolina210240114
    Louisiana120140117
    Florida8990101
    Virginia818099
    U.S.10,08310,470104

    Peanut acres are shown in Table 3. Overall, peanut acres across the nation are predicted to remain the same as in 2023. South Carolina and Mississippi have the highest percentage increase in acres, while Texas and Virginia have largest percentage peanut decrease in acres. 

    Table 3. 2023 Acres and Prospective Plantings for 2024, Peanut (1,000 acres) 
     
    2023
    2024 Prospective
    Acres% of 2023
    Georgia775820106
    Alabama175180103
    Florida160170106
    Texas22516071
    N. Carolina12412097
    S. Carolina7785110
    Arkansas3535100
    Virginia292483
    Mississippi1820111
    Oklahoma161594
    U.S.1,6451,651100

    Table 4 illustrates that soybean acres for 2024 is up three percent in the U.S.  Oklahoma has the largest increase in predicted acres, with Texas losing the largest percentage of acres in 2024.

    Table 4. 2023 Acres and Prospective Plantings for 2024, Soybean (1,000 acres) 
     20232024 Prospective
    Acres% of 2023
    Arkansas2,9803,100104
    Mississippi2,1802,250103
    Kentucky1,8301,950107
    N. Carolina1,6401,650101
    Tennessee1,6001,650103
    Louisiana1,0301,150112
    Virginia580630109
    Oklahoma460550120
    S. Carolina39535089
    Alabama35032091
    Georgia160160100
    Texas12510080
    U.S.83,60086,510103

    It should be noted that that these are only intended plantings, and the actual acreage will vary from these estimates. Weather, commodity prices, input prices, and availability will have an impact on the acres that get planted.


    Source: https://downloads.usda.library.cornell.edu/usda-esmis/files/x633f100h/31980870j/fj237r16t/pspl0324.pdf


    Runge, Max. “2024 Prospective Plantings for Southern Ag Today States.” Southern Ag Today 4(15.3). April 10, 2024. Permalink