Author: Max Runge

  • EQIP Overview for Livestock Producers

    EQIP Overview for Livestock Producers

    Environmental Quality Incentives Program (EQIP) has been a very popular program with livestock producers for many years.  EQIP is a working lands conservation program administered by the Natural Resources Conservation Service (NRCS) to provide conservation programs for farmers, ranchers, and forest landowners. It’s meant to help producers improve water and air quality, build healthier soils, and improve wildlife habitats by providing both financial and technical assistance. The good news for livestock producers is that fifty percent of the EQIP funding is mandated for livestock related practices. 

    Some practices that cattle producers may find beneficial are fencing, cross fencing, forage harvest management, heavy use area protection (gates, feeding areas), herbaceous weed control, pasture and hay planting, nutrient management, livestock shelter protection, prescribed grazing, watering facilities.

    Other practices that are livestock related are in the following list. (This is not a complete list.)

    Access control

    Animal mortality management

    Brush management 

    Composting facility 

    Conservation Crop Rotation

    Constructed Wetland

    Contour Farming 

    Dam

    Energy Efficient Agricultural Operation, Insulation, lighting

    Firebreak

    Groundwater testing

    Irrigation 

    Land Clearing

    Livestock Pipeline

    Obstruction Removal

    Organic Management

    Pond

    Short term storage of Animal waste and By-products

    Silvopasture

    Sinkhole Treatment

    Stream crossing

    Watering Well

    Woody Residue treatment 

    Many of the eligible practices might also overlap with production systems related to carbon payment opportunities.  If you are thinking about carbon options, it might be worth exploring the potential for EQIP participation.  Several past SAT articles have discussed carbon programs and contracts here.   

    There are many practices that NRCS can provide financial and/or technical assistance that is beneficial for environment and sustainability. Look at the EQIP page for more information.

    https://www.nrcs.usda.gov/programs-initiatives/eqip-environmental-quality-incentives

    Here are some important points to keep in mind in learning more about EQIP.  

    To get started, you need to register with the Farm Service Agency to participate in the USDA programs. 

    https://www.fsa.usda.gov/Assets/USDA-FSA-Public/usdafiles/Outreach/pdfs/Brochures/4%20Steps%20to%20Assistance.pdf

    Even though the deadline for signing up for is typically the end of October or early November, producers are encouraged to sign up any time during the year.

    Available practices and practice standards can vary by state and by year so check with you local NRCS office to see what is available in your area. State contacts can be found at:

    https://www.nrcs.usda.gov/conservation-basics/conservation-by-state

    Finally, get to know you’re the local USDA staff at your USDA service center or offices. They can provide valuable information on how best to get assistance for the programs that are offered.


    Runge, Max. “EQIP Overview for Livestock Producers.Southern Ag Today 3(52.2). December 26, 2023. Permalink

  • Historic Research Yields Modern Solutions

    Historic Research Yields Modern Solutions

    The Land Grant University System has a historic tradition of the combined missions of teaching, research, and extension.  In fact, Southern Ag Today was born out of a collaboration of Extension Economists across the Southern region.  The Old Rotation at Auburn, is a great example of Land Grant history and continued relevance.  As cited from the National Register of Historic Places, January 14, 1988:

     The Old Rotation

    Established in 1896 by Professor J.F. Duggar, the Old Rotation at Auburn University is: 

    • The oldest, continuous cotton experiment in the U.S.
    • The 3rd oldest continuous field crop experiment in the U.S.
    • The 1st experiment to demonstrate the benefits of rotating cotton with other crops to improve yields and utilize nitrogen-restoring legumes in a cotton-production system. It continues to document the long-term effect of these rotations in the same soil.

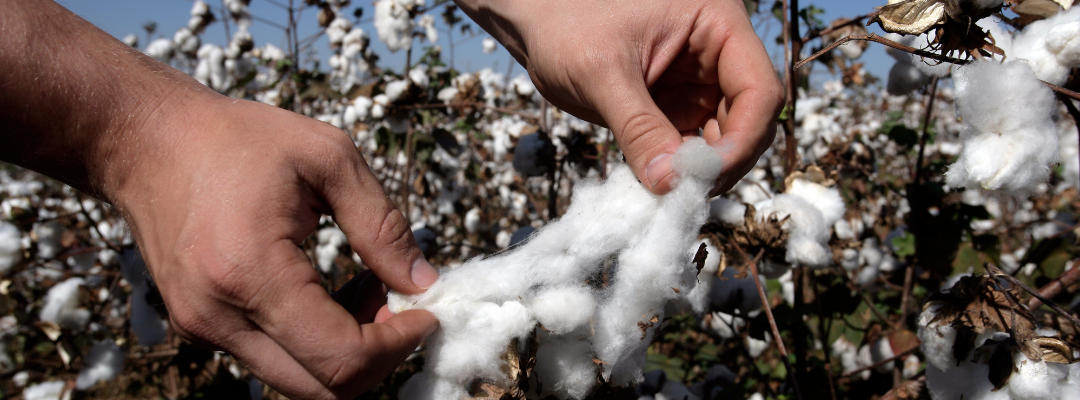
    The Old Rotation has had 128 years of cotton planted in the same soil and provides valuable insight into cover crops and crop rotation, and one of the original objectives of utilizing legume cover crops is significant today.

    Table 1 shows yields from 1896 through 2023 from plot # 6 and plot # 8  (there are a total of 13 plots with different treatments). Plot # 6 has been planted to continuous cotton with no additional Nitrogen (N) fertilizer and no cover crop.  Plot # 8 was also planted in continuous cotton with no added N, but included a winter legume cover crop consisting of crimson clover and hairy vetch.  The plots have otherwise been treated the same over the research period.  It is also important to note that these are non-irrigated plots; there are years with very low or no yields; and the yields have increased significantly due to improved management practices and genetics. 

    The yield difference over the last 100 years is clear and substantial.  However, the yields between 1896 and 1921 were virtually the same, so it took some time for the net benefit of the practice to accumulate.  Much has changed about cotton production in 128 years, but the history of The Old Rotation suggests the reasonable conclusion that good soil and fertility management (or the lack of) is a long term game.    

    With more emphasis on improving soil health and reducing fertilizer costs in the Southern region, looking at long term research helps to provide solutions.

    More information about the Old Rotation can be found at: https://agriculture.auburn.edu/research/cses/the-old-rotation/


    Runge, Max. “Historic Research Yields Modern Solutions.Southern Ag Today 3(47.3). November 22, 2023. Permalink

  • All Markets are Local

    All Markets are Local

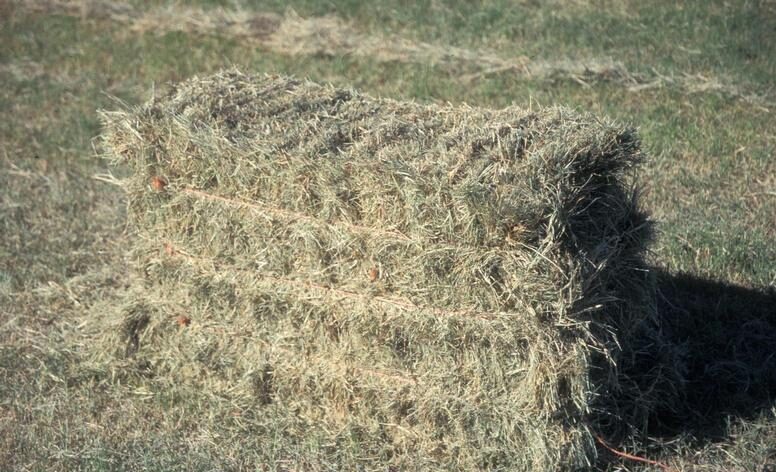
    What’s the price of hay? An adage that I often hear is that all markets are local. This is especially true for the hay market.  Numerous factors influence the local price of hay including but not limited to supply and demand, weather, quality, storage, age, variety, and delivery costs. In other words, the answer to what’s the price of hay is “it depends!”

    Figure 1, Monthly Hay Price Received (excluding Alfalfa) from January 2021 through July of 2023 shows the average price of hay for selected states and the U.S. average. Hay prices for the states of Kentucky, Missouri, Oklahoma, and Texas are included. These are the states that have monthly hay prices reported by USDA NASS Quick Stats. 

    Keep in mind the adage that all markets are local, especially the hay market.  Hay is trucked from where it is plentiful and cheaper to where it’s in short supply.  Shipping and arbitrage makes hay prices move together.  The Missouri and Oklahoma hay prices, on average, are 40% and 46% respectively, lower than the U.S. average hay price. The Kentucky and Texas prices trend very close to the U.S. average price.  The effect of summer drought in Texas and the Southwestern areas of the U.S. is reflected by the increased hay prices across all the states and the U.S. at the beginning of the summer of 2022.

    These monthly prices from USDA NASS can be useful in looking at season and/or long-term trends. For more timely prices check weekly hay prices at:

    https://www.ams.usda.gov/market-news/hay-reports

    Runge, Max. “All Markets are Local.Southern Ag Today 3(39.2). September 26, 2023. Permalink

  • Bermuda Grass Hay Nutrient Removal

    Bermuda Grass Hay Nutrient Removal

    What is the value of the nitrogen, phosphorous, and potassium that is removed when hay is baled and carried away from the field? In March, we looked at wheat straw nutrient removal1, but the value of nitrogen, phosphorous, and potassium should also be considered in hay production.

    Baling and removing 8,000 pounds of Bermuda grass hay over the course of a hay season removes 400 pounds of nitrogen (N), 90 pounds of phosphorus (P2O5), and 345 pounds of potash (K2O) per acre2. Prices of $0.71 per pound of nitrogen, $0.73 per pound of phosphorus, and $0.61 per pound of potash3 were used to reflect the approximate value of the nutrients. The table below shows the value of the N, P2O5, and K2O removed on a per acre basis when 8,000 pounds of Bermuda grass hay is removed. The value of the nutrients removed by the Bermuda grass hay is $561.61 per acre per year. Or on a 1200-pound round bale basis, that value is $54.24 per bale. Adding the cost of baling (1200 lbs. round bale) of $14.504 per bale and moving4 the bales out of the field at $4.35 per bale brings the total costs to $103.09 per 1,200-pound bale.  Converting these values to a per ton basis (4 tons/acre), the nutrient value is $140.40 per ton, and baling and moving is an additional $31.42 per ton. The total per ton costs are $171.82.

    It should be noted that this is just the value of N, P, and K, as there are some micronutrients that are removed as well. 

    There are caveats. The amount of hay harvested, costs of nutrients, baling and moving will likely be different depending on numerous factors, including location, yield, type of bales, the efficiency of the baler, and soil type. Check local resources in your area to estimate the value/cost of the nutrients and baling costs. 

    Information for the values included in this article can be found in the following resources.

    1.    https://southernagtoday.org/2023/03/29/wheat-straw-nutrient-removal/

    2.   https://www.aces.edu/wp-content/uploads/2019/01/ANR-0449.REV_.3.pdf

    3.    https://www.ams.usda.gov/market-news/production-cost

    4.  http://agecon.ca.uky.edu/files/custom_machinery_rates_applicable_to_kentucky_2022.pdf

     N (Nitrogen)P2O5
    (Phosphorus)
    K2O
    (Potash)
    Pounds/acre removed40092345
    Nutrient price/pound$.71$.73$.61
    Nutrient value removed$284.00$67.16$210.45
        
    Total Value of Nutrient Removal$561.61/acre or $84.24/ 1200 lb. round bale
  • Wheat Straw Nutrient Removal

    Wheat Straw Nutrient Removal

    Baling wheat straw following harvest is seen as a way of utilizing a bi-product, with the only cost being baling and removal from the field. The straw could then be sold as bedding for livestock, mulch, or other uses that provide value. However, the cost may be larger than you think.

    The cost of fertilizer and increased focus on soil health makes it essential that we know what nutrients we are removing from the field when we take away the wheat straw. Research has shown that removing 6,000 pounds of wheat straw per acre removes valuable nutrients (6,000 pounds is the approximate amount of straw associated with an 80 bushel per acre wheat yield.) Removing this quantity of wheat straw removes 60 pounds of Nitrogen (N), 10 pounds of phosphorus (P2O5), and 135 pounds of Potash (K2O), per acre1. This is in addition to the nutrients removed when the wheat grain is harvested.  Putting a monetary value to the pounds of N, P, and K taken away by baling the straw shows that the straw does have significant value. A price of $.86 per pound of nitrogen, $0.70 per pound of phosphorus, and $0.61 per pound of potash2 were used to reflect the approximate cost of the nutrients. The table below shows the value of the N, P, and K removed on a per acre basis when the wheat straw is removed. The value of the wheat straw needs to be greater than $125.47 per acre or $25.09 per 1200-pound round bale. Adding the cost of baling (1200 lbs. round bale) of $14.503 per bale and moving3 the bales out of the field at $4.35 per bale. The total of these costs is $43.94 per bale or $219.72 per acre. It should be noted that this is just the value of N, P, and K. There are some micronutrients as well as the organic matter that wasn’t considered in this analysis that have value if left in the field.

    There are caveats. The amount of straw could be different depending on numerous factors, including limited yield, variety of wheat, the efficiency of the baler, and soil type. The value of N, P, and K will vary depending on your location as well. Check local resources in your area to estimate the value/cost of the removal of wheat straw. 

    Information for the values included in this article can be found in the following resources.

    1. https://www.aces.edu/wp-content/uploads/2019/01/ANR-0449.REV_.3.pdf
    2. https://www.ams.usda.gov/market-news/production-cost
    3. http://agecon.ca.uky.edu/files/custom_machinery_rates_applicable_to_kentucky_2022.pdf

    Runge, Max. “Wheat Straw Nutrient Removal.Southern Ag Today 3(13.3). March 28, 2023. Permalink