
In previous Southern Ag Today articles, we reported on the rising U.S. agricultural trade deficit as forecasted by the U.S. Department of Agriculture (USDA). Last month (August), the USDA released new forecasts for the fiscal year (FY) 2025, indicating an even larger deficit than FY 2024. According to the USDA, the U.S. will conclude this fiscal year with agricultural exports at $173.5 billion and imports at $204.0 billion, resulting in a negative trade balance of $30.5 billion. For FY 2025, the USDA forecasts agricultural exports at $169.5 billion and imports at $212.0 billion. If these projections hold true, the continued decrease in exports and increase in imports will cause the U.S. agricultural trade deficit to rise to a record $42.5 billion (Kenner et al., 2024). As mentioned in previous articles, this is not necessarily a concern because we import high-value agricultural and food products that are very different from the bulk commodities that dominate U.S. exports. For instance, U.S. imports of beer, wine, and spirits accounted for more than half of this deficit in recent years (Muhammad and Hossen, 2024b). That said, the continued decline in U.S. agricultural exports should be a concern.
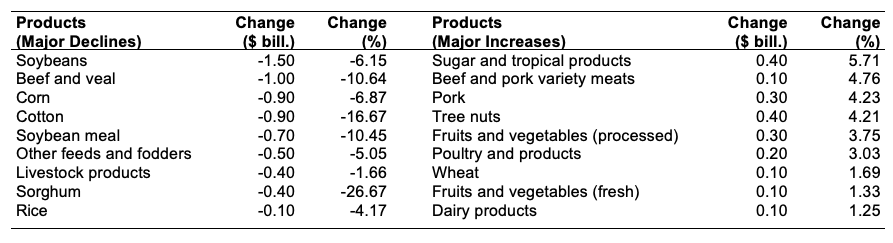
The differences between the latest FY 2024 and FY 2025 forecasts are reported in Table 1. Soybeans account for the largest expected decline at $1.5 billion, a decrease of over 6%. Beef and veal exports are expected to be lower by $1 billion, nearly an 11% decline. Other noted declines include cotton (-$900 million, -17%), soybean meal (-$700 million, -10%), and sorghum (-$400 million, -27%). While there are projected declines for several major commodities, some sectors are projected to increase, albeit the projected increases are smaller by comparison.
The shift from historical trade surpluses presents both challenges and opportunities for U.S. agricultural policy, with an increased urgency to address declining export sales. To mitigate the impact of declining exports, particularly to China, U.S. policymakers must focus on diversifying export markets. Exports to China have declined by 30.9% between 2021 and 2023 (Muhammad and Hossen, 2024a), and they are projected to fall further to $24.0 billion in FY 2025 from $27.0 billion in FY 2024. There is an urgent need to seek new markets in regions such as Southeast Asia, Africa, and Latin America. Negotiating new trade agreements with these emerging markets could open opportunities for U.S. agricultural products. Additionally, providing export promotion assistance and investing in market research will be essential in identifying and capitalizing on opportunities in untapped markets.
Table 1. Difference in USDA exports forecasts: FY 2024 versus FY 2025
Data Source: Kenner, Bart, Hui Jiang, James Kaufman, and Angelica Williams. (2024). Outlook for U.S. Agricultural Trade: August 2024. Report AES-129. U.S. Department of Agriculture. https://www.ers.usda.gov/publications/pub-details/?pubid=109831
For more information:
Kenner, Bart, Hui Jiang, James Kaufman, and Angelica Williams. (2024). Outlook for U.S. Agricultural Trade: August 2024. Report AES-129. U.S. Department of Agriculture. https://www.ers.usda.gov/publications/pub-details/?pubid=109831
Muhammad, Andrew, and Md Deluair Hossen. (2024a). “Understanding the Growing U.S. Agricultural Trade Deficit: The Fall in Exports.” Southern Ag Today 4(26.4). June 27.
Muhammad, Andrew, and Md Deluair Hossen. (2024b). “Understanding the Growing U.S. Agricultural Trade Deficit (Part 2): What’s Happening with Imports?” Southern Ag Today 4(30.4). July 25.
Hossen, Md Deluair, and Andrew Muhammad. “USDA Projects a Widening Trade Deficit for Fiscal Year 2025.” Southern Ag Today 4(38.4). September 19, 2024. Permalink

