Author: Michael Deliberto

  • Fuel Pricing Impacts Irrigation Pumping Costs Across All Systems 

    Fuel Pricing Impacts Irrigation Pumping Costs Across All Systems 

    Authors: Michael Deliberto and Stacia Davis-Conger

    As crops enter the summer growing season, irrigation activities will be closely monitored as rising energy prices and drought have the potential to substantially increase irrigation costs. The conflict in the Middle East has caused fuel prices to increase, impacting farm production costs as the agricultural economy continues to struggle. 

    Examples of a surface water and a deep well irrigation system (both furrow irrigation via poly pipe) were created using the performance assumptions presented in Table 1. Both diesel and electric power sources are explored.  A noticeable difference in system design is the required engine size (120 hp vs 100 hp) to achieve a common flow rate of 2,500 GPM as energy needed to pump water to the surface increases with depth. For a wide range of recent electricity and diesel fuel prices, the electric power source is generally more efficient and cost effective. 

    Table 1. Performance and Energy Consumption assumptions for surface and well irrigation systems with diesel and electric power. 

     SurfaceWell
    2500 GPM / Engine100 hp120 hp
    Run time per Acre-foot*2.172 hours2.172 hours
    Fuel TypeDieselElectricDieselElectric
    Fuel Consumption rate**6.78 gal / hr84.7 kW8.136 gal / hr101.64 kW
    Fuel Consumption per Acre-foot14.73 gal183.99 kWh17.67 gal220.79 kWh
    * 1 acre-foot = 325,851 gallons
    ** diesel consumption = 0.0678 gallons/horsepower/hour
         electric consumption = 0.847 kW / horsepower

    Using Louisiana as an example, in an average year, furrow irrigation using poly pipe is expected to deliver 10.5 acre-inches of water in three applications throughout the growing season for corn, soybeans, and cotton crops. However, in a continuous flood system for rice, the number of acre-inches can vary from 20-26 in upwards of six applications.  Irrigation pumping costs per acre are estimated for diesel and electric (Table 2) power options in surface and well irrigation systems.  

    Table 2. Irrigation diesel costs per-acre for varying fuel prices and applications 

    Diesel Fuel Price per gallonSurfaceWellElectricity Price per kWh*
    Row Crop Application at 10.5”Rice Application at 24”Row Crop Application at 10.5”Rice Application at 24”
    $1.50$19.33$44.19$23.20$53.02$0.1201
    $2.00$25.77$58.91$30.93$70.70$0.1601
    $2.50$32.22$73.64$38.66$88.37$0.2001 
    $3.00$38.67$88.38$46.39$106.04$0.2401 
    $3.50$45.11$103.10$54.13$123.73$0.2802 
    $4.00$51.55$117.83$61.86$141.39$0.3202 
    $4.50$57.99$132.56$69.59$159.07$0.3602 
    $5.00$64.44$147.30$77.32$176.74$0.4002 
    $5.50$70.88$162.10$85.06$194.42$0.4403 
    $6.00$77.32$176.74$92.79$212.04$0.4803 
    * electricity price resulting in the same per acre irrigation cost. 

    Variability in irrigation pumping costs can be observed in the following example for rice. Earlier this year, the diesel price was $3.00 per gallon. For a diesel-powered surface irrigation system applying 24 acre-inches of water, the total pumping costs would be $88.38 per acre. However, with a $5.00 per gallon fuel price, the pumping costs increase to $147.30 per acre. To irrigate a corn crop at 10.5 acre-inches for a surface system, pumping costs would increase from $38.67 to $64.44 per acre. These costs would only be magnified for a well system, as the cost per acre-inch is higher. 

    Table 2 also illustrates the general efficiency of electricity over diesel.  The last column includes electric prices that would result in equivalent irrigation costs per acre for each level of diesel fuel price.  With diesel at $5.00 per gallon, any electricity price less than $0.40/kWh would be more cost effective.  Commercial electricity rates are generally in the range of $0.15 to $0.20/kWh.  To match electric efficiency, diesel would have to be below $2.50/gallon.

    This analysis illustrates the direct impact of energy prices on irrigation costs. Lingering drought conditions can further increase water pumping costs by increasing the frequency of application across all systems. The benefits obtained from utilizing existing strategies (e.g., weather-based scheduling, surge irrigation, bulk purchasing fuel) and cost-effective technologies (e.g., soil moisture sensors, automated pump control) to increase irrigation efficiency can produce long-term cost savings.


    Recommended citation Format: Delbierto, Michael, and Stacia Davis-Conger.”Fuel Pricing Impacts Irrigation Pumping Costs Across All Systems.Southern Ag Today 6(30.1). July 20, 2026. Permalink

  • Sugar Market Outlook

    Sugar Market Outlook

    The USDA released its first supply and use estimates for 2026/27 on May 12th.  For 2026/27, USDA estimates that domestic beet and cane sugar production will total 8.810 million short tons, raw value (STRV). If realized, this nearly 5% reduction would be the lowest domestic production level in more than a half decade (Figure 1). The June WASDE report will reflect the first yield/production survey forecasts for 2026/27, with some in the industry expecting the estimate to be up from the May report. 

    Beet sugar production (~55% of U.S. sugar production) is estimated to reach 4.722 million STRV, its lowest level since the freeze-damaged crop of 2019/20. This represents a year-over-year decrease of 300,000 STRV due to a reduction in planted beet area and lower yields based on delays in springtime planting across the entire beet-production region. 

    Cane sugar production is expected to total 4.088 million STRV, which, like beet sugar, would amount to its lowest output since 2022/23.  This represents a year-over-year decrease of 130,000 STRV. While Louisiana’s cane sugar crop is forecasted at 2.146 million STRV, down 86,000 year-over-year, production in the state is still expected to continue the trend of expanding acres. Yields are expected to track the five-year average following last year’s record yields and sugar recovery rate. Florida’s cane sugar production is forecast at 1.942 million STRV, a yearly decrease of 44,000 STRV as the February freeze inhibited early growth on sugarcane planted the preceding fall.  

    Figure 1. Historical U.S. sugar production (1,000 STRV). USDA-ERS. 

    Imports for 2026/27 are initially estimated at 3.260 million STRV, which equates to a 23% increase from the year prior. This threshold is the result of minimum commitment levels of World Trade Organization (WTO) raw sugar tariff-rate quotas (TRQs) of 1.137 million STRV, WTO refined sugar quotas of 24,251 STRV, free trade agreement (FTA) TRQs of 260,777 STRV, and imports from Mexico. Based on calculations as stipulated in the 2014 U.S.-Mexico Suspension Agreements, U.S. imports from Mexico currently are estimated at 1.046 million STRV. This would be an increase from the 220,000 STRV supplied by Mexico last year and double the 504,000 STRV imported in 2024/25. Based on the stocks-to-use ratio, the Suspension Agreements with Mexico will determine the quota for Mexico in July, September, December, and March.  High-tier duty sugar (refined and specialty refined) imports are initially set at 466,000 STRV. USDA sets 2026/27 high-tier raw sugar imports initially at zero.  As high-tier raw sugar imports are observed entering U.S. ports, they will then be reflected in the balance sheet. For 2025/26, a total of 299,000 STRV of high-tier raw sugar imports have entered the country as of the May WASDE with another 100,000 STRV expected in the second half of the fiscal year (Figures 2 and 3). The amount of high-tier imports landed will have a proportional impact on the import quota from Mexico. As the amount of high-tier imports is increased, the import quota level from Mexico is reduced. 

    Figure 2. Estimated U.S. sugar imports (1,000 STRV) for 2026/27. USDA ERS. 

    Figure 3. Historical U.S. sugar imports, by source. USDA ERS. 

    There is uncertainty with U.S. sugar demand as inflationary pressures, an overall reduction in food and beverage consumption (due to the adoption of glucagon-like peptide-1 drugs (GLP-1)), and changes in food consumption recommendations weigh on the market. The demand estimate of 12.259 million STRV is unchanged from the prior year’s estimate. However, there is a declining multi-year trend in sugar for food consumption from the high reached in 2022/23 (12.473 M STRV). 

    Looking to the global sugar market, for the 2025/26 crop year, the International Sugar Organization (ISO) raised its forecast for the 2025/26 global sugar surplus volume thus indicating an adequately supplied market. As such, the #11 world raw sugar futures price has declined from a high of 27.31 cents per pound in November 2025 to 14.05 cents per pound in April 2026. 

    Domestically, the U.S. #16 raw sugar futures contract has averaged 32.97 cents per pound from January to April. The Midwest refined beet spot price has averaged 41.67 cents per pound over the same period. Although the #16 raw sugar price has declined since last September to end the fiscal year prior, a record cane harvest in Louisiana acted to moderate prices. Coupled with flat U.S. sugar demand, #16 raw futures decreased from 36.06 cents per pound in September 2025 to a low of 32.14 in February 2026. However, raw sugar prices have begun to increase to 34.81 cents per pound in April. Midwest refined beet spot prices have also moderated since September (38 cents) to 42.00 cents per pound in April. The anticipation of reduced domestic sugar production is seen as supportive for U.S. prices (Figure 4). 

    Figure 4. Midwest refined beet sport price, #16 U.S. raw sugar futures price, and #11 world raw sugar futures price, January 2024 to April 2026. USDA ERS. 

    Prior to the Middle East conflict that began in March, world raw sugar prices were already starting a downward trend, settling under 15 cents per pound. While other commodities like corn, soybeans, and cotton have showed gains resulting from the conflict amid the rally in crude oil prices and shipping disruptions through the Strait of Hormuz, world raw sugar prices continued to be suppressed from the available surplus. However, the #11 futures market was not entirely absent of gains as resulting support from the energy complex provided spillover support to prices. Sustaining that support has been challenging. U.S. sugar producers are not immune from the challenges faced by other agriculture producers such as rising input costs and falling commodity prices. While pressure continues to mount for the industry, USDA announced $150 million in assistance to sugar beet and sugarcane producers in response to temporary market disruptions and increased production and processing costs. This assistance was designed to ensure producers have the financial stability needed to continue operations and plan for the upcoming crop year.

    Looking forward to 2026/27, the ISO forecasts a deficit of global sugar due to potential impacts on sugar cane crops from a developing El Niño weather system and the expectation that more sugar cane crush will be diverted into ethanol production away from sugar production (which should raise the #11 world raw price). As the #11 world raw price increases, the U.S. #16 futures will tend to follow suit. 


    Deliberto, Michael. “Sugar Market Outlook. Southern Ag Today 6(24.3). June 10, 2026. Permalink

  • Initial Response of Fertilizer and Fuel Price Spikes on Farm Costs and Returns 

    Initial Response of Fertilizer and Fuel Price Spikes on Farm Costs and Returns 

    The ongoing conflict in the Middle East has created volatility in fertilizer prices. While the duration of the conflict is hard to predict, the prolonged rise in energy prices (crude oil and natural gas) can have an impact on the price that U.S. agriculture producers pay for fertilizer. In turn, this can impact farm profitability at a time when margins are razor thin. 

    The Fertilizer Institute noted that 65% of overall U.S. agricultural nitrogen (N), phosphate (P), and potassium (K) needs are sourced by domestic production. However, the remaining 35% is supplemented by imports. Measured as the percent of imports relative to consumption, the U.S. imports 6% of its N needs- mainly from Trinidad and Tobago and Canada; 13% of its P needs from Peru and Morocco; and 94% of its K needs from Canada, Russia, Belarus, and Israel (Monaco, Schnitkey, and Paulson, 2025). Therefore, exposure to the global fertilizer market can lead to significant price volatility when geopolitical conflicts arise.

    By examining fertilizer and fuel costs associated with corn, cotton, rice, and soybean production in Louisiana, a comparison is made between early January and mid-March prices. The early-January fertilizer and farm diesel expenditures were revisited by using the March 13, 2026, USDA AMS Alabama Production Cost Report’s diesel price and average bids for urea, DAP, and potash fertilizers. The price increase varies across nutrients, with N (urea) increasing by 27%, followed by K (potash) at 10%. Interestingly, DAP (P) declined but did show a relatively large price range ($756 to $1,075 per ton) in the weekly USDA report. Fuel prices increased from $2.85 to $4.04 per gallon, a $1.19 (42%) increase. 

    Table 1. Fertilizer input unit prices ($ per pound of active ingredient), January and March estimates.

    FertilizerJanuaryMarchChangeChange
    N$0.60$0.76$0.1627%
    P$1.03$0.99-$0.04-4%
    K$0.40$0.44$0.0410%

    The level of fertilizer and fuel needs varies by crop nutrient requirements and irrigation method/frequency. For Louisiana crops, per-acre N needs are the highest in corn (210 pounds) and hybrid rice (150 pounds), while cotton requires 90 pounds and soybeans require none. P and K needs are relatively consistent among the selected crops at 60 and 40 pounds per acre. The suggested fertilizer rates for poly-pipe and flood irrigation applications were obtained from the LSU AgCenter. Tables 2-5 provide a January and March comparison of production expenditures for these energy-related inputs on a dollar per acre basis. 

    Table 2. Corn, cotton, rice, soybean fertilizer and fuel expenditures per acre, January and March estimates for Louisiana production. 

    Corn 
    Early-January Mid-March  
    ItemCostItemCostChange ($)Change (%)
    Fertilizer$180.90Fertilizer$214.96$34.0619%
    Fuel $49.49Fuel $70.16$20.6742%
    Total $230.39Total $285.12$54.73 
          
    Cotton
    Early-January Mid-March  
    ItemCostItemCostChange ($)Change (%)
    Fertilizer$139.80Fertilizer$153.82$14.0210%
    Fuel $65.43Fuel $92.75$27.3242%
    Total $205.23Total $246.57$41.34 
          
    Rice
    Early-January Mid-March  
    ItemCostItemCostChange ($)Change (%)
    Fertilizer$155.20Fertilizer$179.45$24.2516%
    Fuel $128.09Fuel $181.57$53.4842%
    Total $283.29Total $361.02$77.73 
          
    Soybeans
    Early-January Mid-March  
    ItemCostItemCostChange ($)Change (%)
    Fertilizer$71.50Fertilizer$71.44-$0.060%
    Fuel $33.04Fuel $46.83$13.7942%
    Total $104.54Total $118.27$13.73 

    For example, Louisiana corn fertility cost increased by $34 while diesel fuel for tractors, implements, and irrigation pumps increased by $21 per acre. In total, corn’s energy-related input costs increased by almost $55 per acre. Cotton’s energy-related input costs increased by $41 per acre. From Table 4, the energy-related input costs for rice increased by $78 per acre due to the paddy flood irrigation practice. Since soybeans received no N, the cost increase was the lowest at $14 per acre. 

    As economic conditions in the farm economy remain a concern for producers, restrictions on cash flows have acted to reduce the amount of inputs producers may pre-book earlier in the year when fertilizer and fuel prices were lower. This is an example of how geopolitical unrest and market distributions can affect local farming profitability. 

    Translating this production cost increase as a function of increased yield, a producer would have to yield an additional 11 bushels of corn per acre (at a price of $5.00); 111 pounds of cotton lint ($0.70 price); 6.4 hundredweights of rice ($12.20 price); and 7 bushels of soybeans ($11.80 price). As Louisiana benefited from favorable production conditions in 2025, further increases in yield per acre would likely exceed state records. While this information is specific to Louisiana, the application of partial enterprise budgeting can be applied to other states. This economic analysis understates the fact that, given the current farm economic conditions, generating additional per-acre production to compensate for increasing production costs is difficult even with a moderate improvement in commodity prices. 

    References

    Deliberto, M. and B. Hilbun. “Projected Costs and Returns for Corn in Louisiana.” LSU AgCenter, January 2026.

    Deliberto, M. and B. Hilbun. “Projected Costs and Returns for Cotton in Louisiana”. LSU AgCenter, January 2026.

    Deliberto, M. and B. Hilbun. “Projected Costs and Returns for Rice in Louisiana.” LSU AgCenter, January 2026.

    Deliberto, M. and B. Hilbun. “Projected Costs and Returns for Soybeans in Louisiana.” LSU AgCenter, January 2026.

    Monaco, H., G. Schnitkey, and N. Paulson. “U.S. Fertilizer Industry in Global Markets: Structure and Supply Risks.” farmdoc daily (15):137, Department of Agricultural and Consumer Economics, University of Illinois at Urbana-Champaign, July 29, 2025. https://farmdocdaily.illinois.edu/2025/07/us-fertilizer-industry-in-global-markets-structure-and-supply-risks.html

    The Fertilizer Institute. ““Pressure Cooker: Competition in the Seed & Fertilizer Industries.” Written remarks of Mr. Corey Rosenbusch, President and CEO of The Fertilizer Institute, before the U.S. Senate Judiciary Committee. October 28, 2025.  https://www.judiciary.senate.gov/imo/media/doc/57806f69-9cd2-0a74-ac7a-d2b236ce9e3b/2025-10-28_Testimony_Rosenbusch.pdf

    USDA, AMS. “Alabama Production Cost Report”. March 13, 2026.


    Deliberto, Michael. “Initial Response of Fertilizer and Fuel Price Spikes on Farm Costs and Returns.Southern Ag Today 6(20.1). May 11, 2026. Permalink

  • Sugarbeet and Sugarcane Production and Farm Trends 

    Sugarbeet and Sugarcane Production and Farm Trends 

    Like many other agricultural sectors, there has been consolidation in United States (US) farm-level sugar production. Sugar is a unique commodity because about 56 percent of the domestic production of sugar originates from sugarbeets and 44 percent originates from sugarcane. The US domestic production of sugar has increased from 8.02 million short tons raw value (STRV) in 1997 to 9.31 million STRV in 2024, an increase of 16% (USDA ERS, 2025a). However, there are now 50 percent fewer sugarbeet and sugarcane farms in the country. 

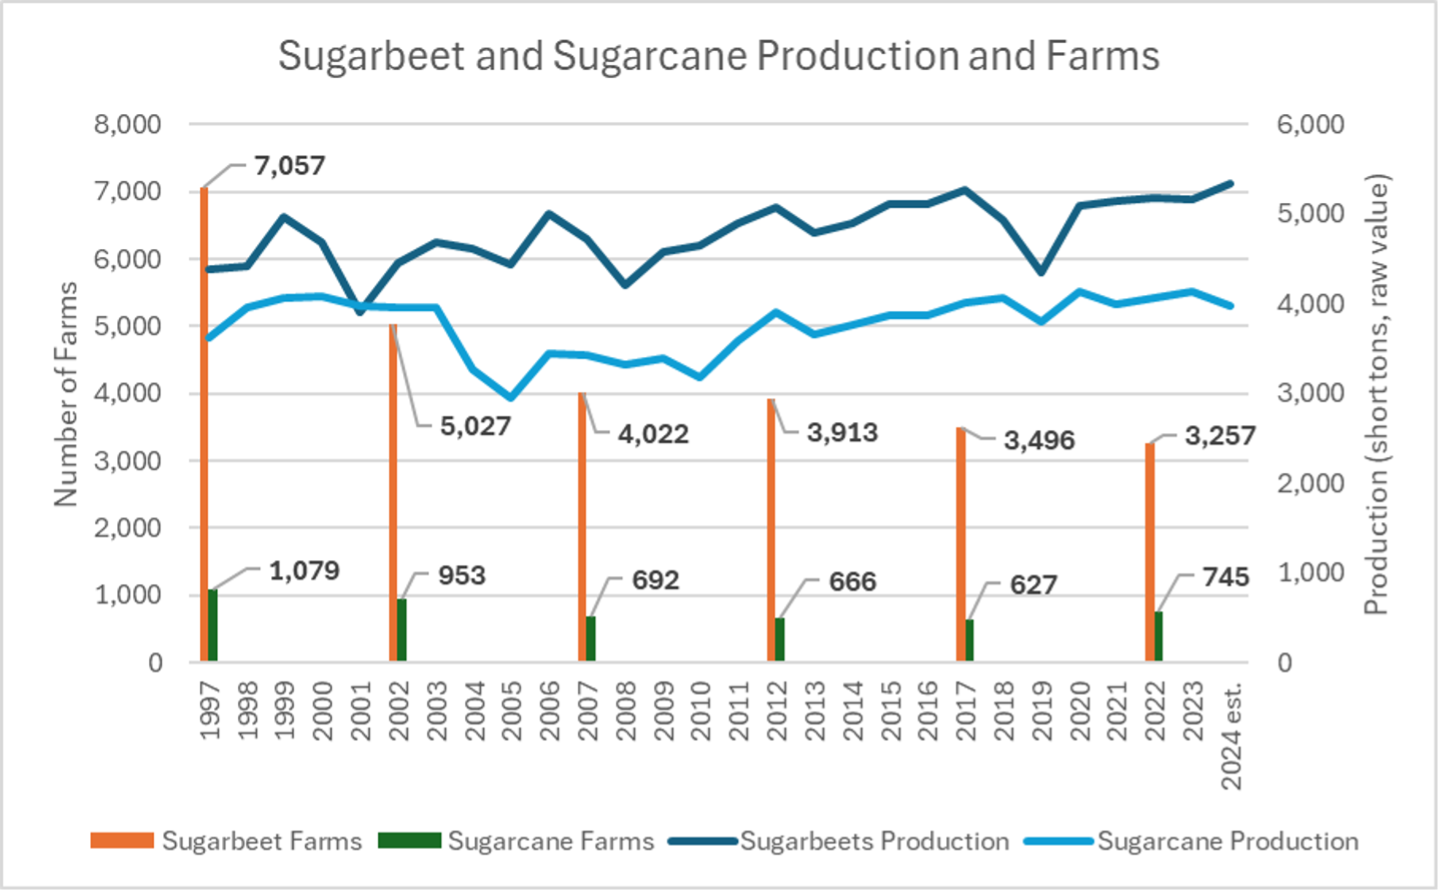
    In 1997, the USDA Census of Agriculture recorded a total of 8,136 sugarbeet and sugarcane producing farms (USDA NASS, 2025). However, by 2022 that number had declined to 4,002, a decrease of over 50 percent. Figure 1 shows sugarbeet and sugarcane production from 1997 through 2024 and the number of sugarbeet and sugarcane farms recorded by the US Census of Agriculture every five years, beginning in 1997. 

    Figure 1. Sugarbeet and Sugarcane Production and Farms. 

    Source: USDA ERS (2025a) and USDA NASS (2025).

    Sugarbeets

    From 1997 through 2022, while there was a decrease in sugarbeet farms and sugarbeet harvested acres, there was an increase in the amount of sugar produced from sugarbeets. The number of sugarbeet farms fell by 54 percent, from 7,057 farms in 1997 to only 3,257 in 2022 (Figure 1). Sugarbeet acres also fell by 20 percent from 1.43 million acres in 1997 to 1.14 million acres in 2022 (USDA ERS, 2025a). However, there was an 18% increase in sugar produced from sugarbeets during this time, with 4.39 million STRV of sugar produced from sugarbeets in 1997 and 5.19 million STRV of sugar produced from sugarbeets in 2022 (Figure 1). 

    These trends indicate that in 1997, the average sugarbeet farm size was 203 acres contributing to final sugar production of 622 STRV (3.06 STRV of sugar per acre). Meanwhile in 2022, the average sugarbeet farm size was 350 acres contributing to final sugar production of 1,593 STRV (4.55 STRV of sugar per acre). Thus, sugarbeet farms have become not only larger (350 acres per farm versus 203 acres per farm), but they have also become 49 percent more efficient! One reason for this increased efficiency is that all sugarbeets grown in the US have been genetically modified since 2009 (Kennedy, Schmitz and Lewis, 2020).

    Sugarbeets are currently grown in four regions and 11 states: the Great Lakes (Michigan), the Upper Midwest (Minnesota, South Dakota, and North Dakota), the Great Plains (Colorado, Montana, Nebraska, Wyoming), and the Far West (Idaho, Oregon, Washington).[1] Sugarbeets are grown in rotation with other crops. Historically, sugarbeet yields in the Far West have been highest. Western sugarbeet production typically utilizes irrigation, which is in contrast to the eastern regions of sugarbeet production that do not use irrigation (USDA ERS, 2025a, b). The largest region for sugarbeet production is the Upper Midwest (Minnesota and North Dakota) (USDA ERS, 2025a). The Upper Midwest represented 42 percent of sugarbeet total production in 1997 and represented 53 percent of sugarbeet total production in 2022 (USDA ERS, 2025a). 

    Each sugarbeet producing region has experienced both consolidation and increased efficiency over the years. For example, the number of sugarbeet farms in Michigan was 1,164 in 1997 (USDA NASS, 2025). That number decreased 43 percent by 2022 to only 663. However, the number of tons of sugarbeets harvested in 1997 was only 3.0 million, and by 2022 the state harvested 4.1 million tons of sugarbeets. 

    Sugarcane

    Sugarcane has also experienced consolidation over the period of 1997 through 2022, where the number of sugarcane farms fell by approximately 31 percent from 1,079 in 1997 to 745 in 2022 without experiencing declines in sugar production or acres engaged in sugarcane production. Sugarcane acres actually increased by 3 percent in 2022 (913,738 acres) relative to 1997 (890,193 acres) (USDA NASS, 2025). Production of sugarcane (for sugar) also increased by approximately 11 percent to 4.06 million STRV in 2022 relative to 1997 (3.63 million STRV) (Figure 1). 

    These trends indicate that in 1997, the average size of a sugarcane farm was 825 acres and contributed to final sugar production of 3,365 STRV (4.08 STRV of sugar per acre). By 2022, the average sugarcane farm size was 1,226 acres and contributed to final sugar production of 5,454 STRV (4.45 STRV of sugar per acre). Thus, the sugarcane sector has seen improvements in production efficiency of approximately 9 percent over the observed period (1997-2022). 

    As recently as 2016, sugarcane was produced in four states (Florida, Louisiana, Hawaii, and Texas). Sugarcane production in Hawaii and Texas ceased in 2016 and 2023, respectively. In Hawaii, rising labor and land cost were contributing factors in the closure of Hawaiian Commercial & Sugar Company (HC&S) in Maui. Production in Texas ceased due to water shortages exacerbated by Mexico’s consistent failure to fulfill its treaty obligations to share irrigation water from the Rio Grande. The lack of sugarcane production due to uncertain water availability resulted in the closure of the only sugar mill in the state, Rio Grande Valley Sugar Growers, Inc. Since 2017, overall sugarcane production has increased in the remaining sugarcane producing states of Louisiana and Florida, despite closure of the sugarcane industries in Hawaii and Texas. In Florida, the number of farms has actually increased from 152 to 240, with the average farm size contracting from 2,772 to 1,656 acres. However, in Louisiana, farms have decreased from 705 to 420 farms. The average size of a Louisiana farm has increased from 561 to 1,158 acres. 

    In Florida, sugarcane is mainly produced in organic soils along the southern and southeastern shore of Lake Okeechobee in southern Florida. The decrease in Florida’s sugarcane acreage leading to 2007 reflected conversion of cropland to public water storage in response to the Comprehensive Everglades Restoration Plan and reallocation of cropland for sod production in the early 2000’s (VanWeelden et. al., 2023). Sugarcane cultivation on sandy soil is expanding as the expense of citrus cultivation has increased due to citrus greening disease (Sandhu et. al., 2024). 

    Sugarcane acreage across Louisiana has been expanding for the past decade, primarily because of the reduced volatility in sugar prices relative to other crops such as corn, rice, and soybeans. (Gautreaux, 2025). Louisiana sugarcane production has also expanded with the development and adoption of high-yielding sugarcane varieties and with the evolution of custom harvesting groups that induce nontraditional producers into sugarcane cultivation by alleviating concerns for those producers regarding increased capitalization costs of purchasing and maintaining specialized sugarcane harvest equipment.

    [1] California is producing sugarbeets in 2025, but the processing facility will close following this crop season (https://www.smbsc.com/ourstory-2/SMBSCMediaReleaseReSpreckelsSugarCompany2025.04.22.pdf).

    References

    Gautreaux, K. (2025). “Sugarcane expansion moving northward and westward but also increasing in traditional areas.” Louisiana State University AgCenter. https://www.lsuagcenter.com/articles/page1738854832844 . 

    Kennedy, P. L., A. Schmitz, and K.L. DeLong. (2020). Biotechnology and demand concerns: the case of genetically modified US sugar beets. AgBioForum, 22(1), 49-60.

    Sandhu, H., M. VanWeelden, A. Sharma, and W. Davidson. (2024). CP 03-1912: A Sugarcane Cultivar Expanding on Sand Soil in Florida, University of Florida, IFAS Extension. https://edis.ifas.ufl.edu/publication/SC111 .  

    United States Department of Agriculture (USDA), Economic Research Service (ERS). (2025a). Sugar and Sweeteners Yearbook Tables. Group 3 Tables. Retrieved from: https://www.ers.usda.gov/data-products/sugar-and-sweeteners-yearbook-tables

    United States Department of Agriculture (USDA), Economic Research Service (ERS). (2025b). Sugar and Sweeteners-Background. Retrieved from: https://www.ers.usda.gov/topics/crops/sugar-and-sweeteners/background#:~:text=Sugarbeet%20production%20in%20the%20Far,is%20typically%20on%20irrigated%20land

    United States Department of Agriculture (USDA), National Agricultural Statistics Service (NASS). (2025). U.S. Census of Agriculture, Volume 1, Chapter 1: U.S. National Level Data. Retrieved from:  https://www.nass.usda.gov/Publications/AgCensus/2022/index.php . 

    VanWeelden, M., C. Kammerer, W. Davidson, M. Baltazar, and R. Rice. (2023). Sugarcane Variety Census: Florida 2022, Sugar Journal 86 (2), July 2023.


    Headline Photo By: Young Stock photos by Vecteezy


    Delberto, Michael, Brian Hilbun, and Karen L. DeLong. “Sugarbeet and Sugarcane Production and Farm Trends.” Southern Ag Today 5(26.3). June 25, 2025. Permalink

  • The 2025 Sugar Market Domestic Supply and Outlook 

    The 2025 Sugar Market Domestic Supply and Outlook 

    On May 12, 2025, the USDA released its World Agricultural Supply and Demand Estimates (2025) report which provides the first 2025/26 fiscal year (FY) estimate of United States sugar production. United States domestic sugar production, which consists of sugar extracted from both sugarbeets and sugarcane, is estimated at 9.285 million short tons raw value (STRV) for the 2025/26 FY (USDA WASDE, 2025). Domestic beet sugar production is estimated at 5.180 million STRV, or 56% of total domestic production, and domestic cane sugar production is estimated at 4.105 million STRV, or 44% of total domestic production (Figure 1). 

    Total domestic use of sugar is predicted to be 12.355 million STRV which includes estimated domestic sugar production of 9.285 million STRV, U.S. sugar imports of 2.475 million STRV, and net stocks usage (beginning stocks minus ending stocks) of 0.596 million STRV (USDA WASDE, 2025). Thus, net stocks usage plus domestic sugar production is estimated to account for about 80% of the domestic use of sugar.  

    The estimated FY 2025/26 domestic sugar production (9.285 million STRV) represents a 26,000 STRV reduction from last year’s total domestic production of 9.311 million STRV (Figure 1). The 2025/26 FY has an estimated slight increase in cane sugar production that is offset by a decrease in beet sugar production, ultimately resulting in the slight year-over-year decrease in overall domestic sugar production. 

    Beet sugar production is estimated at 5.180 million STRV, a 154,000 STRV decrease (2.9%) from the year prior. Sugarbeets are produced in the Upper Midwest, Great Lakes, Great Plains, and Far West regions of the country. United States estimated 2025/26 FY sugarbeet planted area (1.104 million acres) is based on the USDA National Agricultural Statistics Service (NASS) (2025) March Prospective Plantings report. The estimated harvested area (1.081 million acres) is derived using a 10-year average of harvested-to-planted ratio. The sugarbeet shrink (6.76%) and recovery rate (14.78%) are both projected based on the 10-year national average.

    Sugarcane is now produced in only two states- Florida and Louisiana. Cane sugar output is forecast at 4.105 million STRV, up 128,000 STRV (3.2%) from the year prior. Louisiana’s output is projected at 2.088 million STRV, reflecting six consecutive years of increase, and four years of surpassing Florida sugar production. Sugarcane acres in Louisiana have been increasing due to the attractiveness of sugar compared to other alternative crops, availability of custom harvest groups, and acreage expansion northward in the central region of the state. Florida’s cane sugar production is projected at 2.017 million STRV (USDA WASDE, 2025). 

    Figure 1. United States sugar production by source, 2016/17 FY through estimated 2025/26 FY.

    Source: USDA WASDE (2025). Notes: Parentheses show cane and beet sugar production as a percentage of total domestic sugar production. 

    Like many other agricultural sectors, the sugar sector has faced challenges. Namely, the tightening of operating margins due to rising costs of production (Deliberto and DeLong, 2024a) and flat or falling prices (Deliberto, DeLong, and Fischer, 2024b). This is most evident in the recent closures of sugar processing facilities in several states. Since 2000, roughly 40% of United States sugar mills, refineries, and sugarbeet factories have closed (i.e., 29 closures with 42 remaining open) (American Sugar Alliance, 2025; Louisiana Sugarcane Industry, 2025; Fischer, Outlaw, Raulston, and Herbst, 2022). 

    Most recently, there have been three notable closures. In 2023, the Sidney Sugar Company in Montana closed due to falling prices for sugarbeets (Western Ag Network, 2023).  Next in 2024, the Rio Grande Valley Sugar Growers, Incorporated ceased operations (Food Business News, 2024). The facility terminated operations due to Mexico’s failure to comply with the provisions of the 1944 Water Treaty between the U.S. and Mexico that governs water sharing between the two nations on the Colorado River and the Lower Rio Grande. Most recently, it was announced that the last remaining sugarbeet processing facility in California will be decommissioned at the end of this season – the Spreckels Sugar Company, Incorporated in Brawley, California (Southern Minnesota Beet Sugar Cooperative, 2025). 

    In recent months, U.S. wholesale prices for beet and cane sugar have been falling (USDA Economic Research Service, 2025). Coupled with the rising costs of producing sugarbeets and sugarcane and processing them into sugar, this has created very tight operating margins for sugar producers (Deliberto and DeLong, 2024a). Looking ahead to the next growing season, farmers are optimistic that a new Farm Bill will strengthen the farm safety net and that growing conditions will be favorable for sugarbeets and sugarcane. 

    References

    American Sugar Alliance. (2025). Sugar’s Coast-to-Coast Reach. Retrieved from: https://sugaralliance.org/us-sugar/sugars-coast-to-coast-reach

    Deliberto, M., and K.L. DeLong. (2024a). “Examining Sugarcane and Sugarbeet Production Costs.” Southern Ag Today. Retrieved from: https://southernagtoday.org/2023/12/11/examining-sugarcane-and-sugarbeet-production-costs/.

    Deliberto, M., K.L. DeLong, and B. Fischer. (2024b). “Analyzing World and U.S. Sugar Price Dynamics.” https://southernagtoday.org/2024/05/20/analyzing-world-and-u-s-sugar-price-dynamics/.  

    Fischer, B.L., J.L. Outlaw, J.M. Raulston, and B.K. Herbst. (2022). “Economic Impact of the U.S. Sugar Industry.” Retrieved from: https://sugaralliance.org/wp-content/uploads/2022/06/Sugar-Report.pdf

    Food Business News. (2024). Retrieved from: https://www.foodbusinessnews.net/articles/25615-last-sugar-cane-grower-in-texas-to-close.

    Louisiana Sugarcane Industry. Production Data 1984-2023. Retrieved from: https://amscl.wpenginepowered.com/wp-content/uploads/2024/11/Production-Data-1984-to-2023.jpg

    Southern Minnesota Beet Sugar Cooperative. (2025). Southern Minnesota Beet Sugar Cooperative to Decommission Spreckels Sugar Company, Inc. in California. Retrieved from: https://www.smbsc.com/ourstory-2/SMBSCMediaReleaseReSpreckelsSugarCompany2025.04.22.pdf.

    USDA Economic Research Service. (2025). World, U.S., and Mexican Sugar and Corn Sweetener Prices. Tables 5 and 5a. Retrieved from: https://www.ers.usda.gov/data-products/sugar-and-sweeteners-yearbook-tables.

    USDA National Agricultural Statistics Service (NASS). (2025). Prospective Plantings. Retrieved from: https://usda.library.cornell.edu/concern/publications/x633f100h

    USDA World Agricultural Supply and Demand Estimates. (2025). Retrieved from: https://www.usda.gov/about-usda/general-information/staff-offices/office-chief-economist/commodity-markets/wasde-report.

    Western Ag Network. (2023). “Sydney Sugars to Begin Closure Procedures in April.” Retrieved from: https://westernagnetwork.com/sidney-sugars-to-begin-closure-procedures-in-april


    Deliberto, Michael, and Karen L. DeLong. “The 2025 Sugar Market Domestic Supply and Outlook.Southern Ag Today 5(22.3). May 28, 2025. Permalink