Over the last few years, there has been a lot of discussion/questions surrounding the impact of Beef x Dairy (BxD) on the beef supply chain. Anecdotally, BxD calves have gone from day olds being worth $75/head in 2019, to well over $800/head today. Thus, BxD calves have led to increased revenue for dairy producers around the country. Given their worth, dairy producers have increased the amount of BxD offspring in their breeding program. The increase has been noticed by the beef industry and has led to the particular question, “How many head of Beef x Dairy calves are out there?”. This is a common question that has been asked at Extension meetings, and most recently, at the 2025 Beef Improvement Federation (BIF) in Amarillo, TX. While it may seem simple to answer, it is quite difficult to answer that simple question.
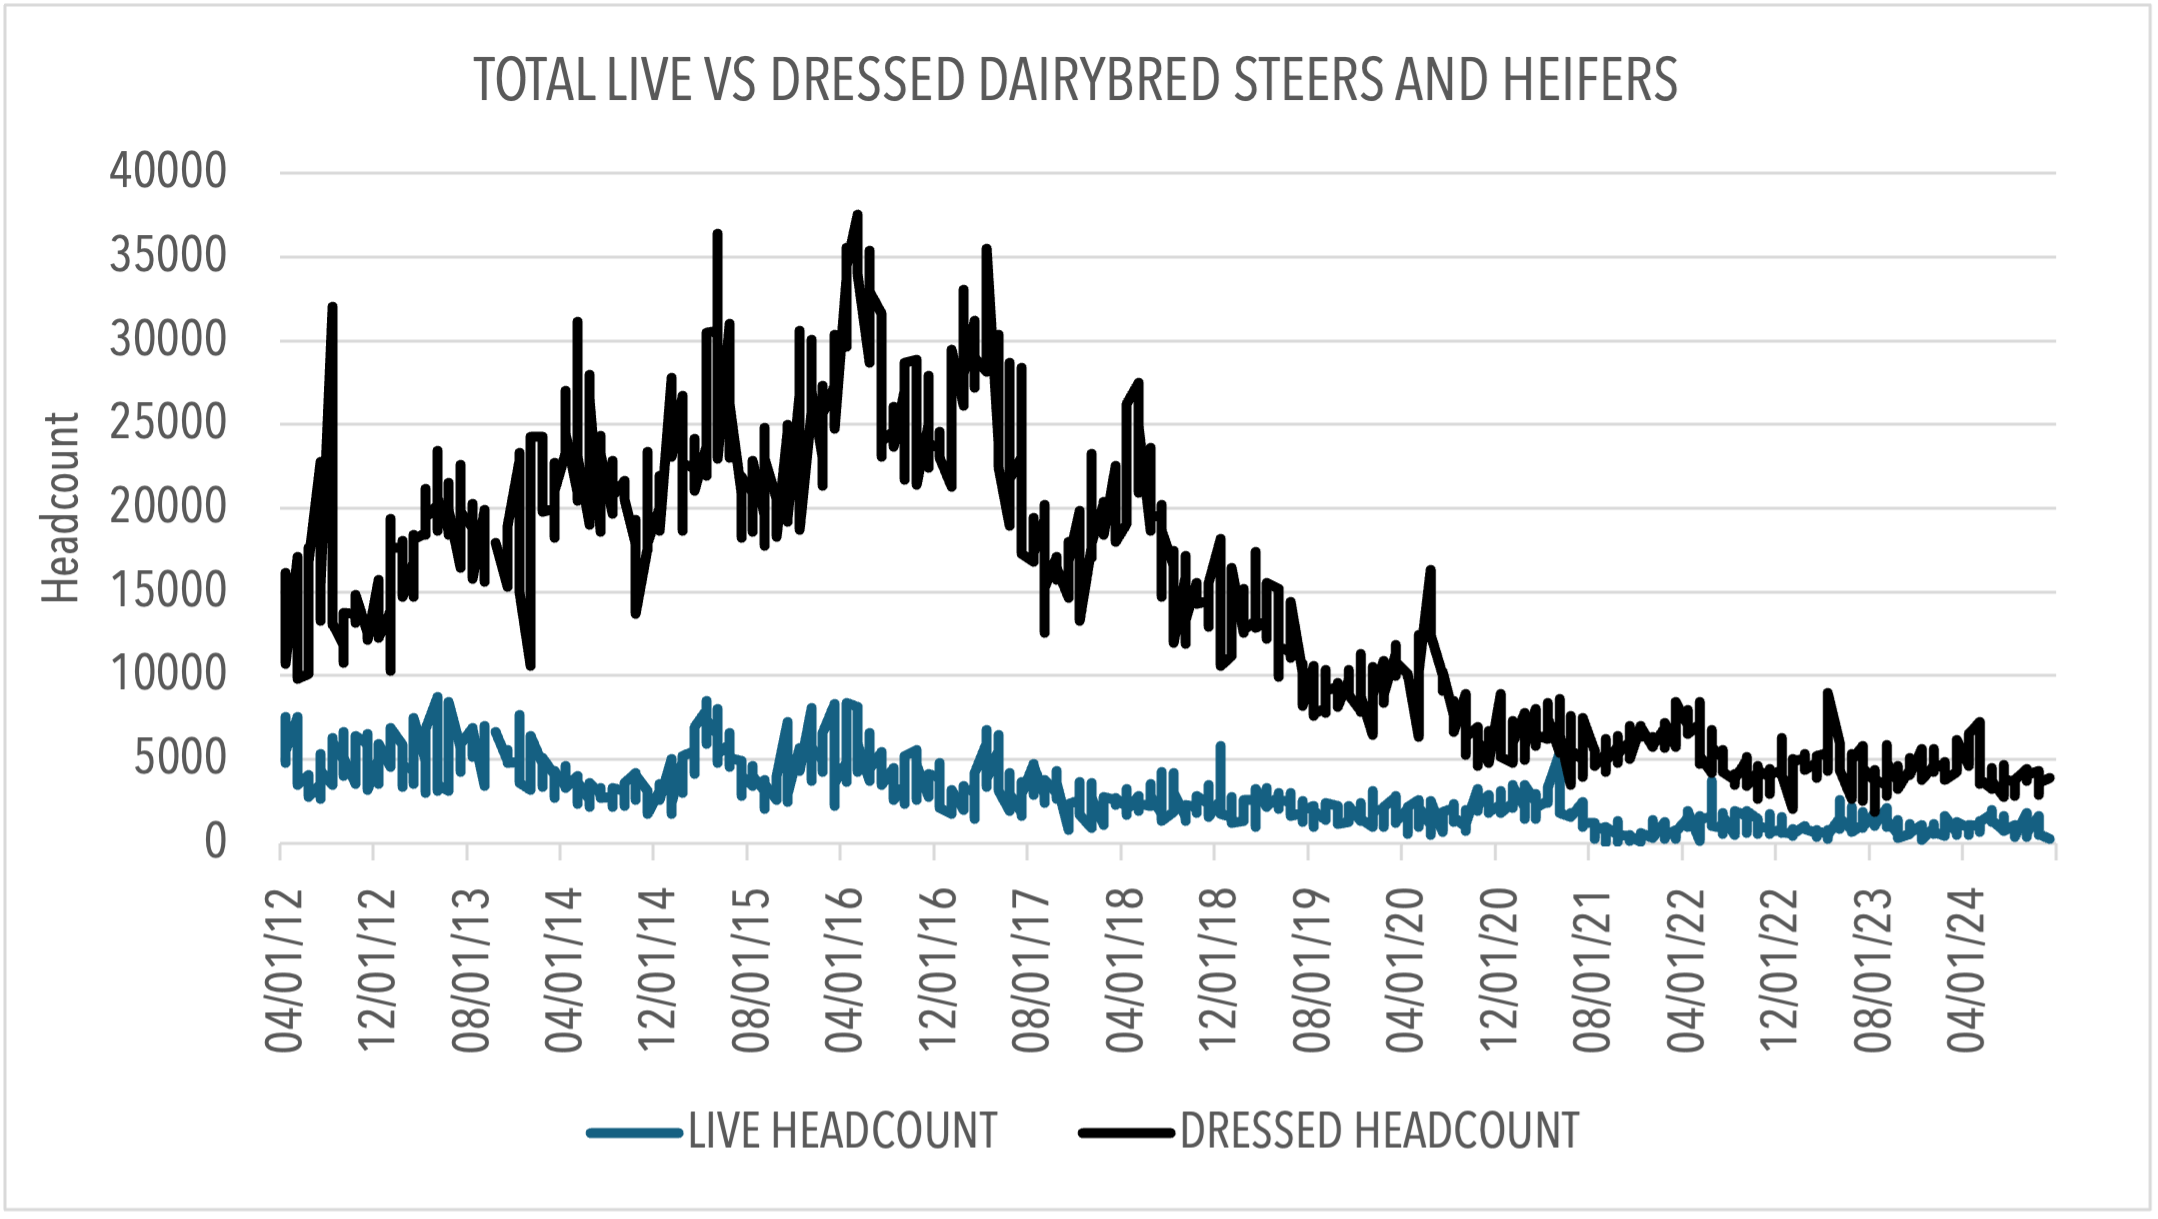
Historically (from 2001-2024), the dairy herd size has remained relatively constant at 9.2 million head. Annually, the dairy calf crop is utilized as either future replacement heifers, or they enter the beef supply chain. The ones that enter the beef supply chain are eventually harvested and marketed as fed cattle. The cattle that are straightbred dairy (majority dairy genetics) are reported by the USDA as “dairy” in the fed cattle reports. Figure 1 displays the weekly total live and dressed straightbred dairy fed cattle sales for the time frame April 2012-December 2024. The total number of straightbred dairy fed cattle peaked in May 2016. Since then, there has been a notable decrease in the total number of both live and dressed straightbred dairy in the fed cattle markets. The January 1 reports show that the difference is not due to dairy replacements. In 2016, dairy replacements were 4.81 million head and have since steadily decreased to 3.91 million head in the 2025 January 1 report. Given that the dairy calf crop has remained stable with the dairy herd, and the number of dairy replacements has not offset the decrease in straightbred dairy fed cattle, then the change in the calf crop must be BxD bred calves. With that in mind, that creates the starting point for calculating BxD estimation.
Figure 1. Weekly Total Live Vs Dressed Steers and Heifers Marketed as Straightbred Dairy in the U.S. From April 2012 through December 2024

In order to estimate the annual number of total BxD calves in a given year, we first estimate the calf crop and remove replacements by using a combination of that year and the following year’s January 1 reports. For example, to estimate the 2024 calf crop (minus replacements), we take the 2024 dairy cow inventory and subtract the 2025 dairy replacement inventory. We then adjust the calf crop estimate by subtracting the total number of cattle marketed as straightbred dairy (reported in the USDA Weekly 5 Market Area Report) for that given year (2024 in our example). This yields our estimate for the total number of BxD calves. It is important to note that we do not adjust the estimated number of possible BxD calves for calving rate and death loss. Thus, our estimate is the maximum amount of BxD calves possible. Table 1 displays BxD headcount estimates by year.
Table 1. Annual Beef x Dairy (BxD) Headcount Estimates
| 2016 | 2017 | 2018 | 2019 | 2020 | 2021 | 2022 | 2023 | 2024 |
| 2,879,077 | 3,239,703 | 3,695,863 | 4,058,416 | 4,296,389 | 4,824,271 | 4,975,405 | 5,046,508 | 5,178,194 |
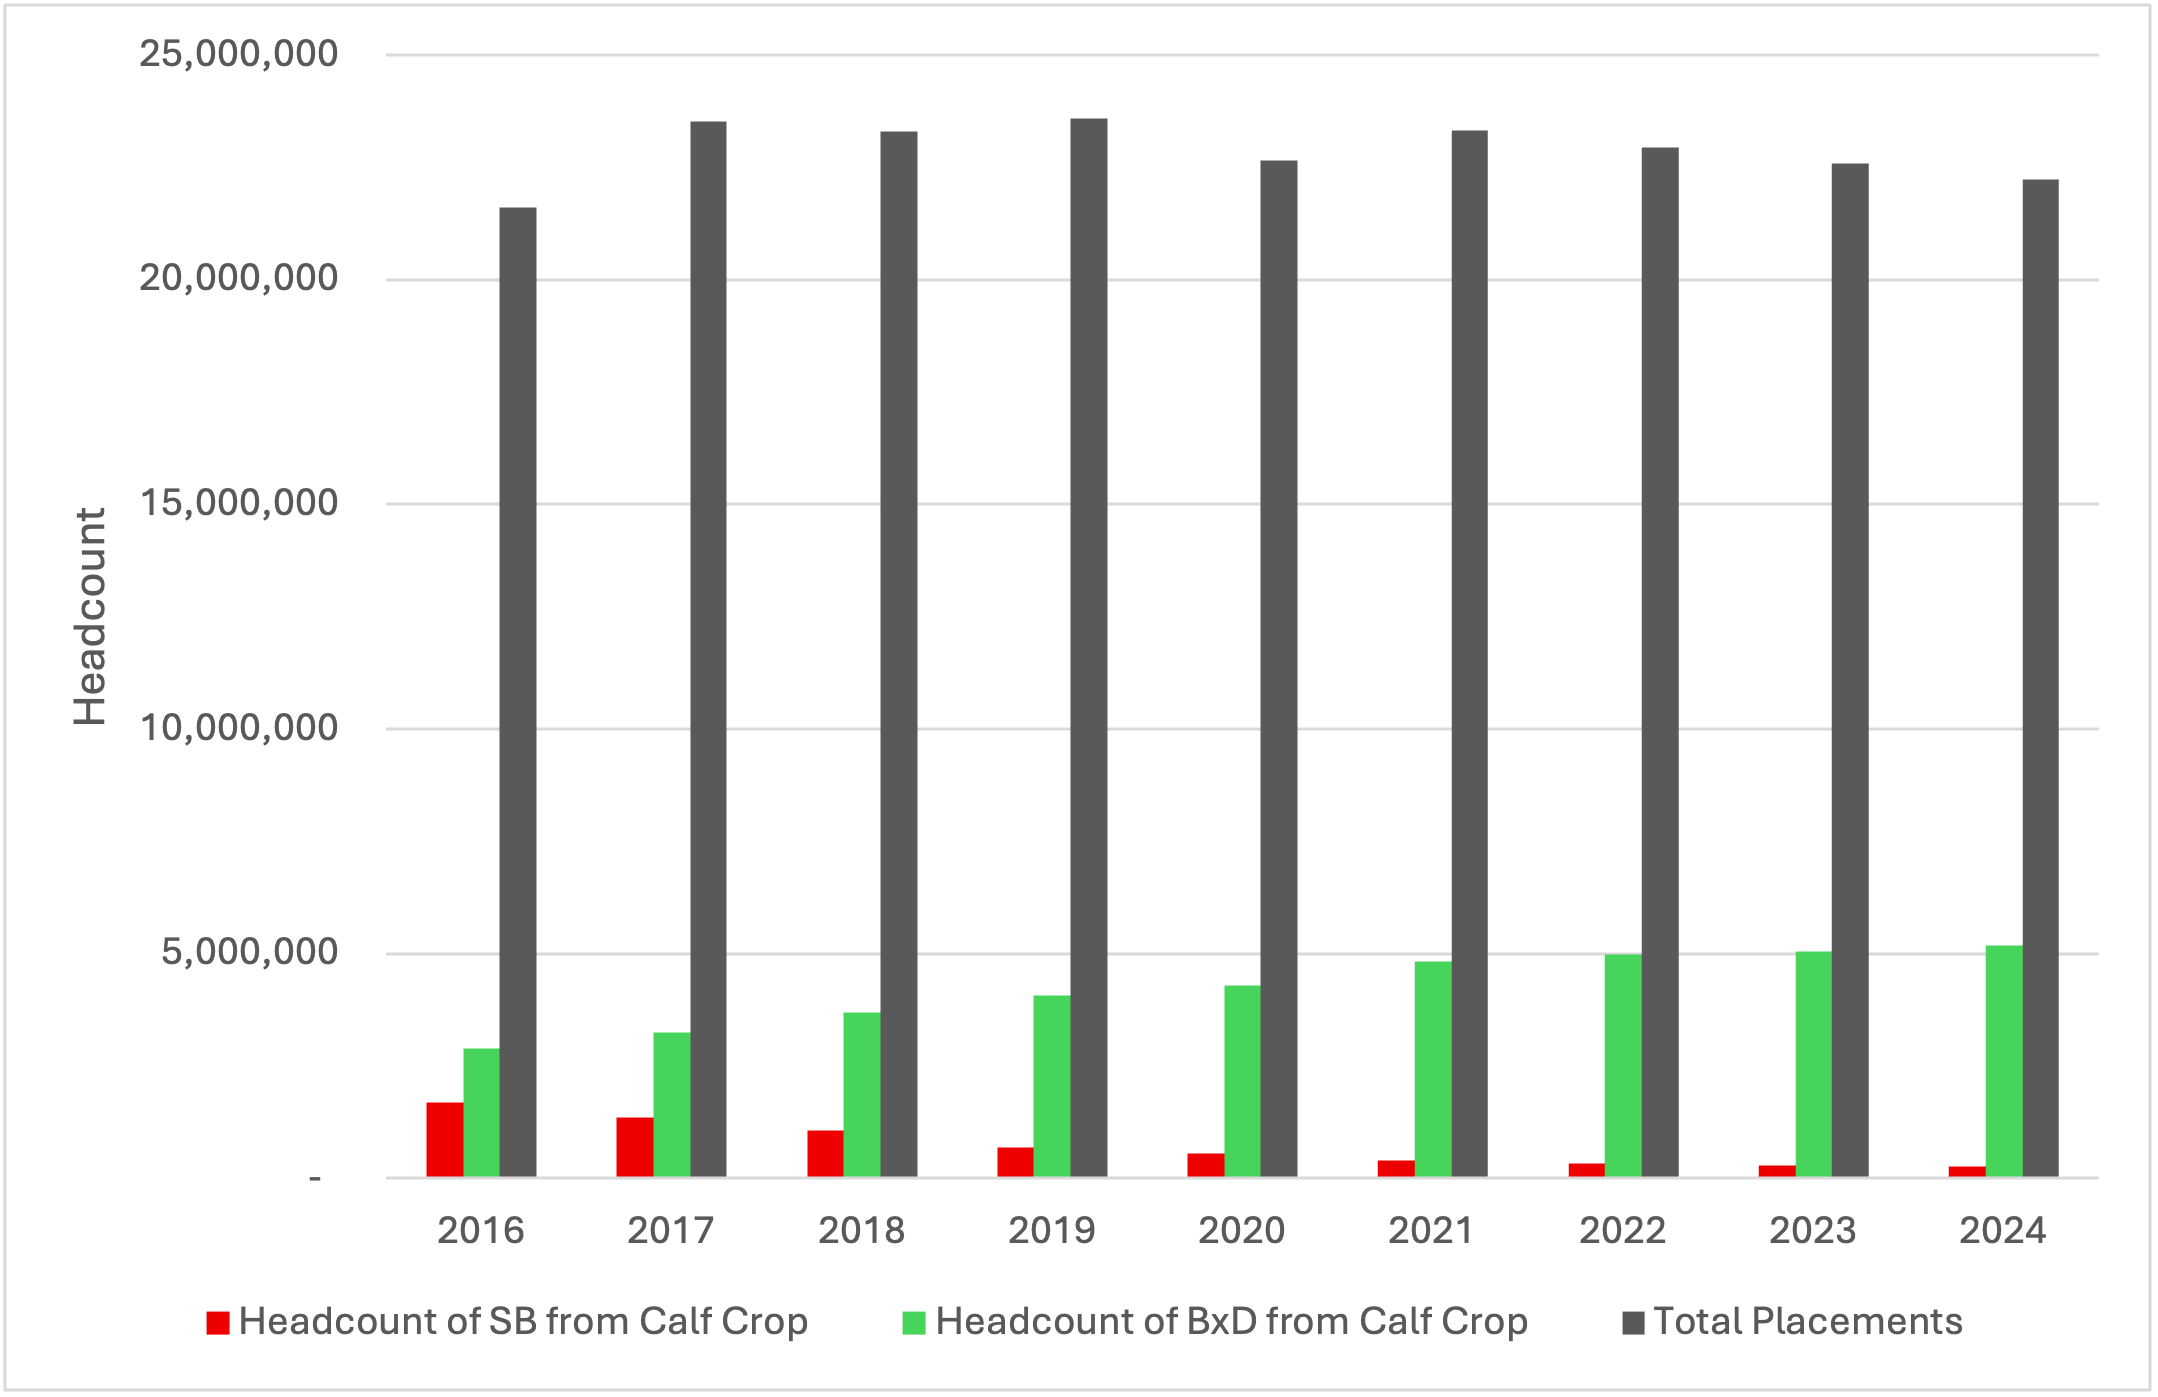
In 2016, maximum BxD headcount estimates were approximately 2.9 million. This number steadily rises to 5.2 million head in 2024. How do these estimates relate to total annual placements? By calculating annual placements from monthly Cattle On Feed reports, and comparing estimates in Table 1, we can estimate the maximum percentage of BxD calves placed in the feedyard annually. Figure 2 displays total annual number of straightbred (SB, red bars) and BxD (green bars) cattle relative to total placements (dark gray bars). While BxD placements have been increasing since 2016, the total number of placements has trended downward since 2021 due to a shrinking national beef herd. This has allowed for a steady increase in the percentage of placements being BxD cattle.
Figure 2. Annual Headcount for Straightbred (SB), Beef x Dairy (BxD), and Total Placements (2016-2024)

Table 2 displays the annual percent of placements that could have been BxD cattle. Current estimates show roughly 23% of the total calf crop in 2024 was available for beef on dairy. This number has increased from 13% in 2016.
Table 2. Annual Percent Estimates of Total Placements that are BxD Cattle
| 2016 | 2017 | 2018 | 2019 | 2020 | 2021 | 2022 | 2023 | 2024 |
| 13% | 14% | 16% | 17% | 19% | 21% | 22% | 22% | 23% |
Given that the national beef herd has shown no signs of rebuilding, and that the number of BxD cattle has increased each year since 2016, we can expect the percentage of placements that are BxD cattle to remain at least steady, if not to increase in the coming years. Because of this expectation, it might be beneficial for fed cattle marketing reports to indicate if marketed cattle are BxD, instead of the current reporting of them as “beef” cattle. This would also make the question posed in the introduction much easier to answer in the future.
Wyatt, Parker. “Beef x Dairy Placements.” Southern Ag Today 5(29.2). July 15, 2025. Permalink
