Author: Robert Ellis

  • Economic vs. Tax Depreciation: Understanding Which to Use for Determining Farm Profitability

    Economic vs. Tax Depreciation: Understanding Which to Use for Determining Farm Profitability

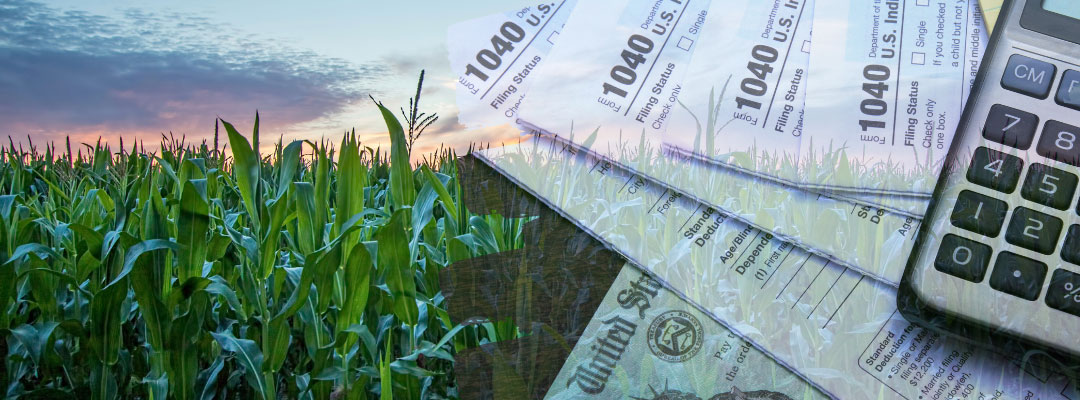
    Economic depreciation is often overlooked when it comes to the profitability of a farming operation since it is a non-cash expense. One reason is when farmers hear depreciation, they think of tax depreciation. Tax depreciation is an essential tool to lower before-tax income (Tax depreciation and guidelines can be found through the IRS, and application of tax depreciation methods should be discussed with a tax professional). However, the tax depreciation value does not accurately reflect the “real” annual value loss of an asset. For this reason, using tax depreciation to assess profitability will lead to inaccurate calculations. Instead, economic depreciation should be used for farm financial statements. 

    Economic depreciation differs from tax depreciation by estimating the actual reduction in the value of an asset over time. The value lost depends on use, wear and tear, age, and technical obsolescence. Annual economic depreciation will also vary based on purchase price, the estimated value when sold, and the length of ownership for each asset.  

    An example of the difference between tax and economic depreciation is when looking at an operation’s purchase of a new grain truck. For tax purposes, the farmer can use Additional First-Year Depreciation (Section 179), which will allow them to deduct the entire cost of the truck within the year of purchase. However, if the farmer wanted to sell that truck after one year, it would still have considerable value. The difference between the purchase and resale prices is the value lost for that one year of use. This difference is the economic depreciation and should be used in farm financial statements to more accurately determine profitability.  Figure 1 illustrates how economic depreciation on farm machinery has increased over time for grain farms in Kentucky.  On average, machinery depreciation represents eight percent of the total cost of production (variable and fixed costs) for Kentucky grain farms.

    A more in-depth discussion of tax depreciation vs. economic depreciation, and comparing depreciation for new or used machinery with guided examples can be found here.

    Figure 1. Average annual machinery depreciation for Kentucky grain farms by size ($/ac)

    Source: Kentucky Farm Business Management Program’s Annual Summary Data:
    http://agecon.ca.uky.edu/KFBM-pubs

    Ellis, Robert, and Jordan Shockley. “Economic vs Tax Depreciation: Understanding Which to Use for Determining Farm Profitability.” Southern Ag Today 2(38.3). September 14, 2022. Permalink

  • Examining the Used Combine Market

    Examining the Used Combine Market

    Buying and selling equipment is an important aspect of row crop production. Combine purchasing and resale represent one of the largest decisions row crop operators must make. These decisions can impact the overall profitability of an operation. Used combine prices continue to rise as ongoing supply chain issues ripple through the economy. While rising costs are not limited to the pandemic era, it’s clear the lack of new combines, parts delays for older combines, increasing crop prices, and increasing fuel costs continue to be factors that impact equipment prices. 

    Pre-pandemic data suggested that the average price of a combine by age sold at auction has a wider dispersion for newer combines and 2018 prices were lower than 2017. Further breakdowns of the data found little variation in average prices of older combines while finding a larger spread as the machine became newer. These averages can be seen in the graph below. With the use of auction data from Machinery Pete, factors that impact these prices are examined and used to help farmers make more informed decisions about buying machinery. Some factors are common knowledge to most farmers, such as higher prices for certain manufacturers, locations, machinery conditions, and precision equipment. The data suggest a year in age on a combine would decrease its value by just under 10%, while 1000 hours would decrease the value by around 2%.  Interestingly, we also found that the statistical connection between age and value was stronger (more important) than that of hours and value.  Presumably meaning that the market is less consistent in terms of discounts/premiums for hours used, while the age of the combine was more critical in determining value. 

    As for the post-pandemic market, farmers looking to buy or sell used machinery should consider the following suggestions. When buying a combine, farmers can expect lower sales prices through consignment sales. While farmers selling used machines should list their combines through either on-farm sales or online sales. For farmers only willing to purchase certain brands or models, their searches will need to be extended beyond their local region, but expect an even higher price than in previous years. For farmers looking for potential machinery savings, consider a combine that is older than 3 years of age and be careful not to overpay for low hours. 

    Source: Machinery Pete Auction Data of Combines Sold in the US and Canada between 2015 and 2018.

    Data Link: Machinery Pete Auction Data

    Ellis, Robert, and Tyler Mark. “Examining the Used Combine Market.” Southern Ag Today 2(17.3). April 20, 2022. Permalink