Author: Ryan Loy

  • Global Cotton Mill Use at a Six-Year High

    Global Cotton Mill Use at a Six-Year High

    Authors: Ryan Loy, Assistant Professor and Extension Economist, H. Scott Stiles, Extension Economist, and Hunter D. Biram, Assistant Professor and Extension Economist, University of Arkansas

    According to USDA’s Foreign Agricultural Service (USDA-FAS), world cotton mill use is projected to reach 121.95 million bales in 2026/27, which is an increase of about 2 million bales from 2025/26 and the highest level since the 2017/18 marketing year. This increase marks the fourth consecutive year of growth in global mill use (Figure 1).

    Figure 1. World Cotton Mill Use, Million 480 Lb. Bales, 2021 – 2026

    Source: USDA, Foreign Agricultural Service, World Cotton Supply and Distribution, July 2026

    The increase in mill use this year is concentrated in a handful of countries (Figure 2): China’s mill use is forecast at 41.5 million bales, up 500,000 bales and the highest since 2020. China remains the largest supplier of apparel products to the world. India’s use is currently projected at 26 million bales, up from 25.5 million bales in 2025, matching the record set in the 2020/21 marketing year. Together, China and India are expected to account for 55 percent of global mill use in 2026/27. Pakistan is also expected to mill 10.2 million bales after a 900,000-bale decline in 2025. Similarly, Bangladesh’s use is expected to grow to 7.8 million bales, up from 7.6 million bales in 2025, but down from 8.2 million bales in 2024. Both Pakistan and Bangladesh are looking to expand their textile and apparel exports this year and into the near future. In contrast, the United States’ mill use remains a fraction of these countries’ totals, forecasted at 1.6 million bales in 2026. This is down from 2.5 million bales in 2021 (USDA-FAS, 2026). However, nearly every major milling country is projected to grow this year, with the major countries (i.e., China, India, and Pakistan) representing nearly 75% of the global mill use gain in 2026 (USDA-ERS, 2026).

    Figure 2. Mill Use by Major Spinning Country, Million 480 lb. Bales, 2021 – 2026

    Source: USDA, Foreign Agricultural Service, World Cotton Supply and Distribution, July 2026

    These gains are the result of current market forces, such as underlying consumer demand for cotton apparel, which is expected to rise with world economic growth. Cotton fiber prices were relatively stable through the 2025/26 marketing year, which supports global mill demand. Synthetic fibers, such as polyester, are strongly correlated with crude oil, which has seen a dramatic increase in 2026. As a result, cotton has become more price competitive with synthetic fibers (Metcalfe, 2025). Additionally, mills are working through low yarn and fabric inventories from previous years, creating a restocking demand. Mill restocking, combined with tighter supply from lower production this year, is a major reason world ending stocks are projected to fall to 71.1 million bales (down from 75.7 million in 2025 and the lowest since the 2018/19 marketing year). The strengthening demand for cotton lint is expected to provide sustained upward pressure on farm prices, as reflected in USDA’s July 2026 WASDE report, which projects the 2026/27 season-average farm price as $0.73/lb, a 10.5-cent increase over the 2025/26 marketing year. It’s worth noting the information presented here draws on the most recent data available. The August 2026 WASDE report, which is scheduled for release this afternoon, may revise these projections.

    References

    Metcalfe, S. 2025. “Understanding the forces that drive global cotton prices.” Oxford Economics. Retrieved from https://www.oxfordeconomics.com/resource/understanding-the-forces-that-drive-global-cotton-prices/

    USDA – Economic Research Service (ERS). 2026. “Cotton and Wool Outlook: July 2026.” Retrieved from https://www.ers.usda.gov/publications/115080

    USDA – Foreign Agricultural Service (FAS). 2026. “Production, Supply, and Distribution: Cotton.” Retrieved from https://apps.fas.usda.gov/psdonline/app/index.html#/app/downloads

    USDA – World Agricultural Supply and Demand Estimates. 2026. “July 2026 WASDE Report.” Retrieved from https://www.usda.gov/oce/commodity/wasde/wasde0726.pdf


    Recommended citation format: Loy, Ryan, H. Scott Stiles and Hunter Biram. “Global Cotton Mill Use at a Six-Year High.Southern Ag Today 6(33.3). August 12, 2026. Permalink

  • What Lower Interest Rates Mean for 2026 Budgets

    What Lower Interest Rates Mean for 2026 Budgets

    Following the benchmark rate reductions in 2025, the Federal Open Market Committee (FOMC) left the federal funds target rate unchanged at 3.50–3.75% at its March 2026 meeting (Federal Reserve, 2026). While benchmark rates have come down from post-pandemic highs, borrowing costs continue to remain elevated compared to the low-interest-rate environment before 2022. For farmers across the country, this poses a significant challenge, as interest expenses remain a notable portion of crop budgets while trying to balance the drastic increase in operating expenses. The expectation of near-zero rates might be unrealistic, but it’s important to highlight that even with lower rates, interest expense continues to contribute to the on-farm price-cost squeeze.

    Table 1 is derived from a previous article (see Loy, 2023) and updated to reflect an average budget for a Midsouth corn, cotton, rice, or soybean farmer in 2026. Interest expenses are based on the average fixed operating loan rates from the Federal Reserve Bank of Kansas City Agricultural Credit Survey. Operating loan terms are assumed to have a 9-month payback period and include select 2026 pre-harvest production expenses.

    Table 1. Southern Region, Select 2026 Pre-Harvest Production Expenses ($/acre)

     CornCottonRice Soybeans
    Seed$125.00$113.00$130.00$91.00
    Fertilizer$360.00$290.00$258.00$117.00
    Pesticides$54.00$205.00$118.00$93.00
    Fuel $29.00$52.00$104.00$64.00
    Operating Interest Expenses at varying rates:    
        Q1 2026 (7.20%)$29.93$34.78$32.15$19.24
        Q1 2025 (7.50%)$31.98$37.16$34.34$20.55
        Q1 2024 (8.20%)$34.19$39.73$36.72$21.97
        Q1 2023 (7.43%)$31.64$36.76$33.98$20.33

    Note: Operating Interest Expense assumes a 9-month term (e.g., 7.20% * (9/12) * principal borrowed)

    Table 1 illustrates that the benchmark rate reductions, when applied to this year’s production expenses, have provided little relief. Estimated interest expenses for 2026 are down marginally compared to the peak rate of 2024, when operating costs would have generated about $4.26, $4.95, $4.58, and $2.74 more interest expenses per acre for corn, cotton, rice, and soybeans, respectively. However, the reductions are even more modest compared to interest costs in 2023 and 2025.

    Overall, while interest expenses have eased, it remains a meaningful part of pre-harvest production planning. Recent benchmark rate reductions have provided some relief, but razor-thin on-farm margins persist. At the same time, higher input costs to grow the same crop have increased the amount that must be financed, potentially offsetting some of the benefits from a lower interest rate environment.      

    References

    Board of Governors of the Federal Reserve System, Federal Open Market Committee. 2026. Federal Reserve Press Release, January 28, 2026. Retrieved from, https://www.federalreserve.gov/monetarypolicy/files/monetary20260128a1.pdf

    Federal Reserve Bank of Kansas City. 2026. Federal Reserve Ag Credit Survey. Retrieved from, https://www.kansascityfed.org/center-for-agriculture-and-the-economy/agricultural-data-and-indicators/

    Loy, R. 2023. The Federal Funds Rate Impact on Agricultural Lending. Southern Ag Today 3(34.3). Retrieved from, https://southernagtoday.org/2023/08/23/the-federal-funds-rate-impact-on-agricultural-lending/


    Loy, Ryan. “What Lower Interest Rates Mean for 2026 Budgets.Southern Ag Today 6(14.1). March 30, 2026. Permalink

  • 2026 Rice Market Outlook

    2026 Rice Market Outlook

    Authors

    Ryan Loy, Assistant Professor, University of Arkansas

    Alvaro Durand-Morat, Associate Professor, University of Arkansas

    2025 Domestic Market Recap and 2026 Outlook

    In 2025, U.S. rice acreage amounted to roughly 2.8 million acres, of which 2.7 million acres were harvested (USDA-NASS, 2026). All rice class acreage was down about 4 percent from 2024, due in part to the generational flood event that took place in April across the Midsouth, which forced many farmers to replant, or in some cases leave ground fallow due to razor-thin margins for rice in the South (Biram et al., 2025).  Compared to 2025, the upcoming growing season preview shows tighter stocks, with a declining price environment. The January 2026 WASDE report currently pegs long grain ending stocks at about 34.6 million bushels, little changed from the 24/25 marketing year but with a significant change in average farm price, which is currently forecasted at $10.50/cwt (down from $14.00/cwt during the 24/25 marketing year) (USDA, 2026). 

    2026 International Trade Outlook 

    International rice prices remain low due to large exportable surpluses, particularly from Asian exporters, and lower import demand from Indonesia. Temporary price increases, such as those observed in Thailand in late 2025, have already reversed, and export prices across major suppliers—including the United States, Uruguay, Thailand, and Vietnam—show sharp year-on-year declines (FAO, 2026). Unless major production shocks occur in Asia, prices are expected to remain depressed through 2026.

    Global rice production for the 2025/26 campaign is projected to be near record levels (around 541 million metric tons), with demand slightly lower (538.6 million metric tons), resulting in a third consecutive year of global surplus and continued stock accumulation (USDA-FAS, 2026). India has emerged as the world’s leading rice producer, surpassing China since 2024/25, and it is expected to reach a new production record in 2025/26 (preliminary reports suggest a record high main Kharif crop harvested in 2025 and an increase in area planted of the second Rabi crop). Its rapidly growing exportable surplus makes India a decisive force in shaping global market dynamics.

    Since U.S. long-grain rice competes strongly with Mercosur rice in the Western Hemisphere, it is important to highlight that the upcoming 2025/26 Mercosur harvest is expected to be smaller due to reduced planted area and climatic challenges, although high initial stocks—especially in Brazil—will partially offset lower output (USDA-FAS, 2026). Thus, Mercosur’s lower production performance may be good news for U.S. rice, maintaining or reclaiming market share throughout the Western Hemisphere. 

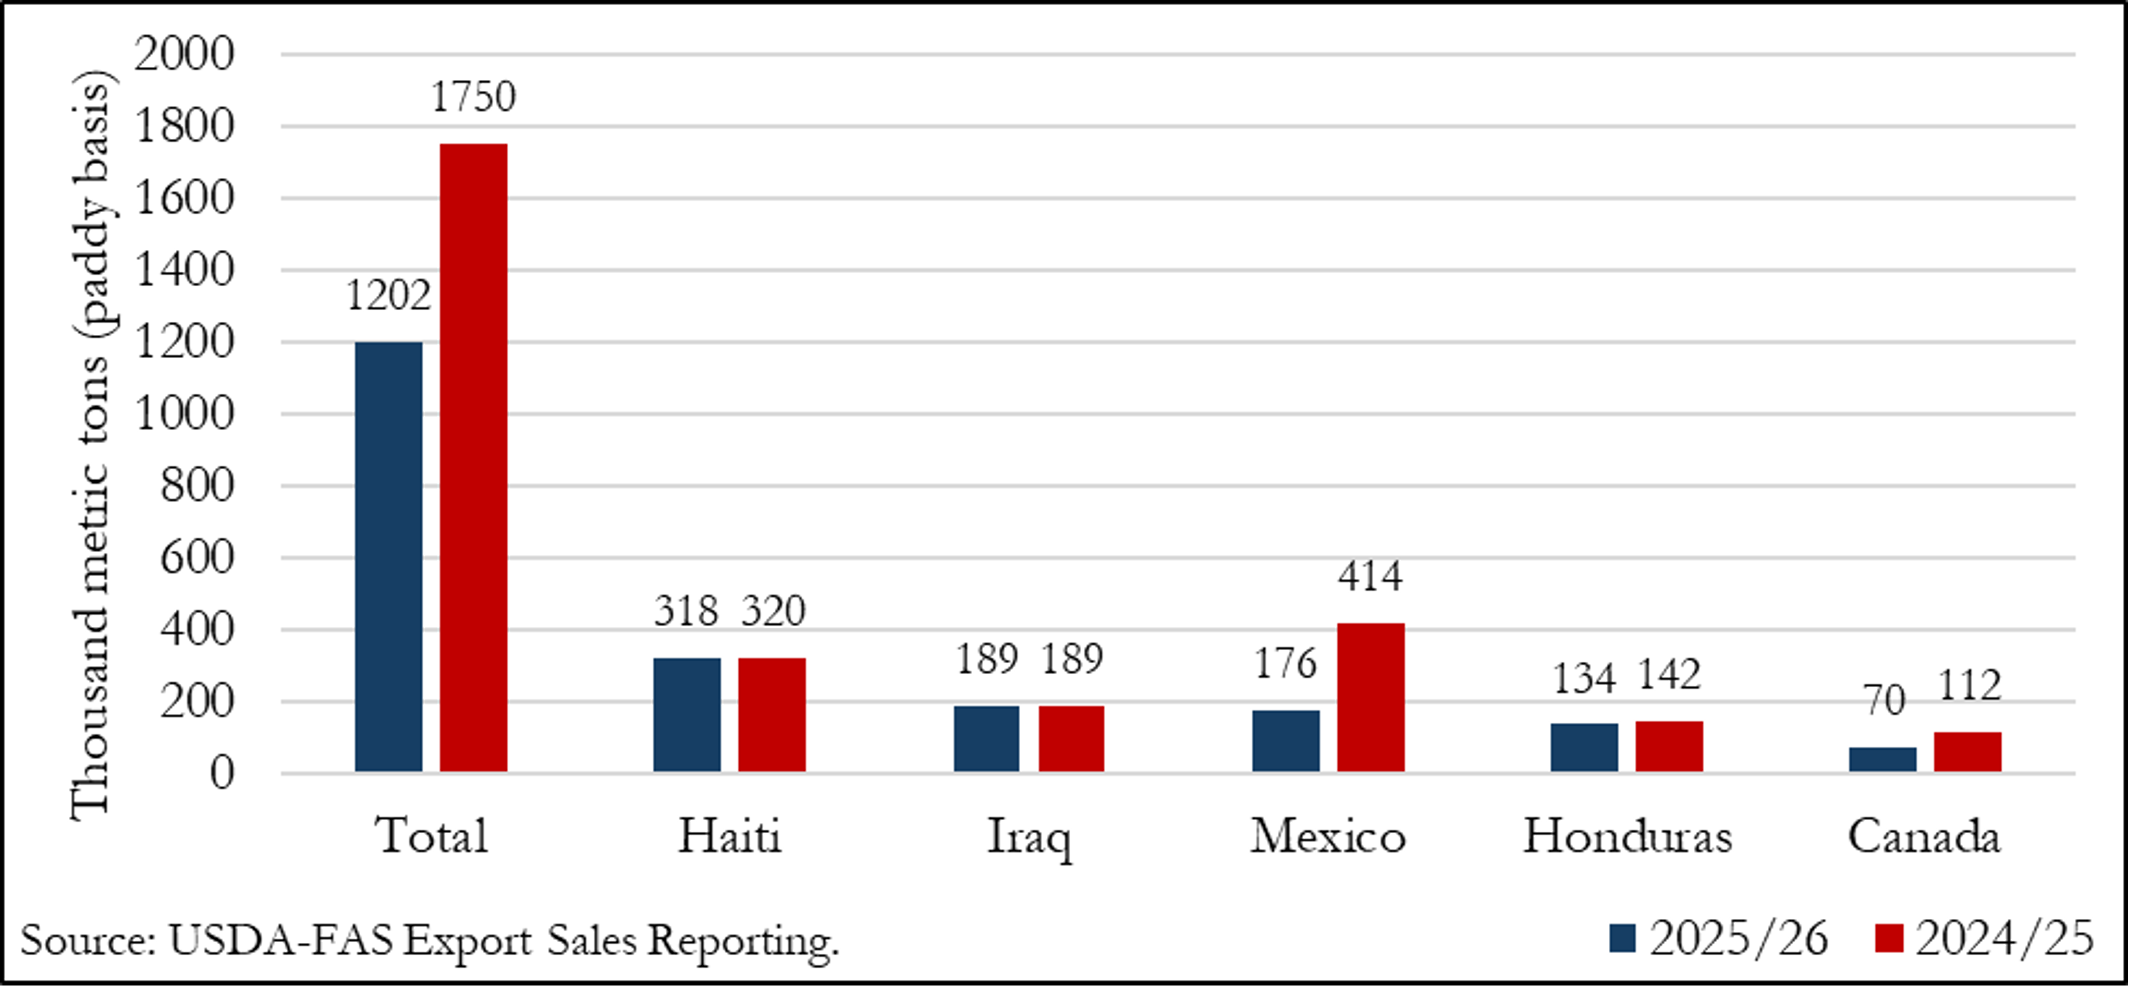
    In this international context, U.S. long-grain exports in the first half of marketing year 2025/26 (August-January) decreased 31% relative to the same period a year ago (Figure 1). While the U.S. has maintained export levels to Haiti and Iraq, it has experienced a significant drop in exports to Mexico and, to a lesser extent, to Canada and Honduras, due largely to increasing competition from South America.  

    Figure 1. U.S. long-grain exports during August-January of the marketing year – total and by top five destinations.

    References

    Biram, H.D., Loy, R., Hardke, J., Kelley, J., Ross, J., and Davis, J. 2025. Analysis Suggests Historic Flooding Results in $99 Million in Crop-Related Damages. University of Arkansas Factsheet. FSA93. Available online at, https://uaex.uada.edu/publications/PDF/FSA93.pdf.

    United States Department of Agriculture, National Agricultural Statistics Service. 2026. Crop Production: 2025 Summary. Available online at, https://esmis.nal.usda.gov/sites/default/release-files/795725/cropan26.pdf.

    United States Department of Agriculture. 2026. World Agricultural Supply and Demand Estimates. Available online at, https://www.usda.gov/oce/commodity/wasde/wasde0126.pdf.

    FAO Rice Price Update. Available online at https://www.fao.org/markets-and-trade/commodities/rice/fao-rice-price-update/en/  

    United States Department of Agriculture, Foreign Agricultural Service. 2026. Production, Supply and Distribution Online. Available at https://apps.fas.usda.gov/psdonline/app/index.html#/app/advQuery

    United States Department of Agriculture, Foreign Agricultural Service. 2026. Export Sales Reporting. Available at https://apps.fas.usda.gov/esrquery/esrq.aspx  


    Loy, Ryan, and Alvaro Durand-Morat. “2026 Rice Market Outlook.Southern Ag Today 6(8.3). February 18, 2026. Permalink

  • 2025/26 Rice Market Outlook

    2025/26 Rice Market Outlook

    U.S. Production and Harvest Acres

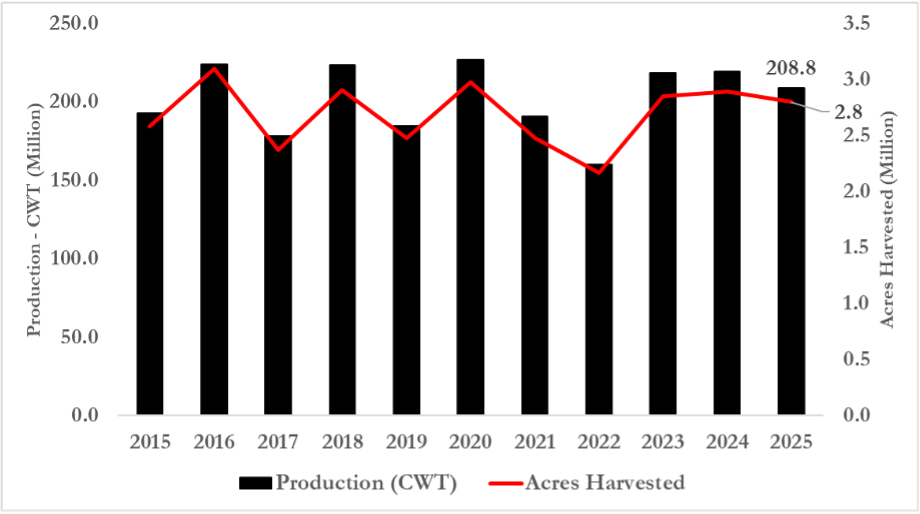
    The 2025 planting season was marked by considerable challenges. Farmers in the Midsouth faced historical flooding in April that forced replanting across a significant portion of the Mississippi delta region. As farmers put planting behind them, the growing season brought extreme heat and a prolonged drought. In contrast, California experienced a relatively normal year with ideal planting temperatures and no surface water allocation issues (USA Rice, 2025).  Even with California’s improved season, the production setbacks in the Mississippi delta region offset those gains, and, as a result, U.S. rice production is expected to decline roughly 10 million cwt from 2024 levels, falling to 208.8 million cwt in 2025 (Figure 1). Over the past decade, production has fluctuated between 160 and 230 million cwt, with acreage shifting between 2 – 3 million acres. Peaks in 2016, 2018, and 2020 reflect the typical crop rotation across the midsouth. However, with high input costs and weaker rice prices, 2022 marked a contraction in production at 160 million cwt. Production has since recovered, due in part to more favorable returns for a rice crop compared to other Midsouth commodities such as corn or cotton.  

    Figure 1. U.S. All Rice-Class Production and Acres Harvested (2015 – 2025F)

    Source: USDA-National Agricultural Statistics Service (NASS), 2025

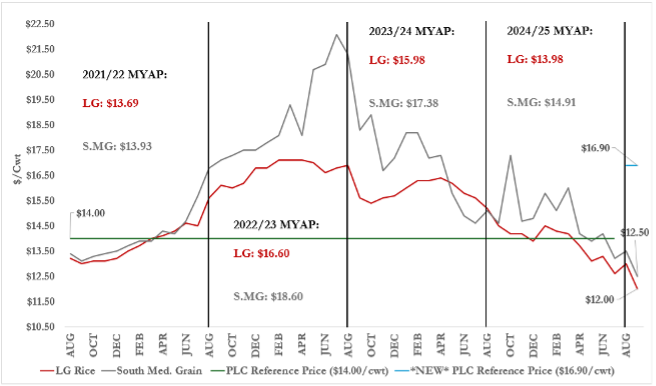
    The September 2025 World Agricultural Supply and Demand Estimates (WASDE) report forecasts a 35% year-over-year increase in all rice-class beginning stocks. This increase in beginning stocks is almost entirely driven by the 93% year-over-year increase for long grain, the result of record yields across the southern region in 2024, with Arkansas averaging 169.8 bu/acre (UADA-CES, 2025). On the other hand, medium grain is forecasted to fall by 27.5%. The current outlook is for a slight rise in overall exports and a relatively minor decrease (~0.9%) in ending stocks relative to 2024/25 (USDA-AMS, 2025). Ending stocks are currently forecasted at 53.4 million cwt, compared to 2024/45, which was 53.9 million cwt. The USDA anticipates long-grain rice exports will reach 64 million cwt, a level that hinges on maintaining price competitiveness in global markets. As a result, farm prices for long-grain rice are forecast to decline to $12.00/cwt, while the prices for Southern medium & short-grain rice are forecast at $12.50/cwt (Figure 2). These expectations represent a severe decline from the 2024/25 marketing year, with long grain and Southern medium & short grain prices falling 14% and 18%, respectively. It’s worth noting that the effective reference price has increased from $14.00/cwt to $16.90/cwt for the 2025/26 marketing year (One Big Beautiful Bill Act, 2025). Figure 2 highlights this change, showing that current forecasts indicate a possible PLC payment under the new effective reference price. 

    Figure 2. Rice Marketing Year Average Farm Prices (2021/22 – 2025/26F)

    Source: USDA-National Agricultural Statistics Service (NASS), 2025

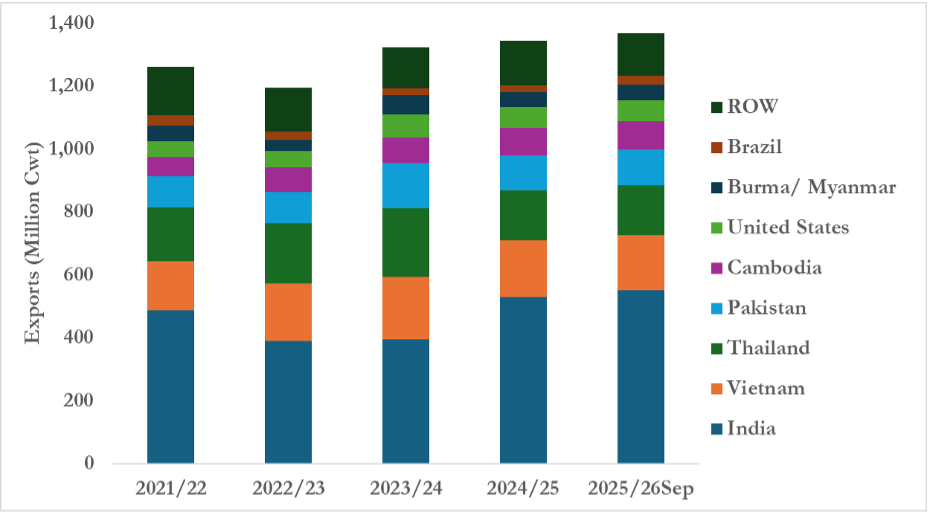
    Figure 3 highlights a modest increase in exports across major rice-supplying countries. However, global rice prices have trended downward throughout 2025, primarily due to weaker global demand, India resuming rice exports, much lower import demand from Indonesia, and a temporary ban on rice imports in the Philippines, which is expected to lift in November (USDA-FAS, 2025). U.S. long-grain rice is currently priced around $585/ton[1], which represents the most expensive rice on the world market. In contrast, India, Pakistan, and Thailand are all competing for the cheapest rice on the market, priced at around $360/ton. The broad decline in the world rice price has been from India’s decision to lift its rice export ban in September 2024. Nearly a year later, Indian exports continue to exert downward pressure on international markets.

    Figure 3. Milled Rice Exports (2021/22 – 2025/26Sept)

    Source: USDA-Foreign Agricultural Service (FAS), 2025

    [1] This price reflects #2, 4-percent brokens, sacked FOB, Gulf Coast (Childs and Abadam, 2025)


    References

    Childs, N., and Abadam, V. (2025). Rice Outlook: September 2025 (Report No. RCS-25H). U.S. Department of Agriculture, Economic Research Service. Retrieved September 2025, from, https://downloads.usda.library.cornell.edu/usda-esmis/files/dn39x152w/j9604180m/w0894b61f/RCS-25H.pdf

    University of Arkansas – Cooperative Extension Service. (2025). Rice Production in Arkansas. Division of Agriculture. Retrieved September 2025, from, https://www.uaex.uada.edu/farm-ranch/crops-commercial-horticulture/rice/#:~:text=In%202024%2C%20Arkansas%20rice%20producers,lb%2Facre)%20in%202021.

    United States Department of Agriculture, Agricultural Marketing Service. (2025). World Agricultural Supply and Demand Estimates (WASDE-664). Retrieved September 15, 2025, from, https://www.usda.gov/oce/commodity/wasde/wasde0925.pdf

    United States Department of Agriculture, Foreign Agricultural Service – PSD Reports. (2025). World Rice Trade. Retrieved September 12, 2025, from, https://apps.fas.usda.gov/psdonline/app/index.html#/app/downloads

    United States Department of Agriculture, National Agricultural Statistics Service. (2025). Rice Production and Acres Harvested. Retrieved September 2025, from, https://quickstats.nass.usda.gov/

    USA Rice. (2025). Spring Planting Report. Retrieved September 2025, from, https://www.usarice.com/news-and-events/publications/usa-rice-daily/article/usa-rice-daily/2025/04/25/spring-planting-report


    Loy, Ryan, and Alvaro Durand-Morat. “2025/26 Rice Market Outlook.Southern Ag Today 5(40.3). October 1, 2025. Permalink

  • Tracking Chapter 12 Bankruptcies in the South: 2015 – 2025 Trends and Identifying On-Farm Stress

    Tracking Chapter 12 Bankruptcies in the South: 2015 – 2025 Trends and Identifying On-Farm Stress

    What is Chapter 12 Bankruptcy?

    Chapter 12 bankruptcy is a provision under the U.S. Bankruptcy Code tailored specifically for family farmers and fishermen. Introduced in 1986 during the height of the farm crisis, Chapter 12 allows qualifying family farmers to restructure their debts while continuing to operate. It offers a more flexible repayment structure than Chapter 11 or Chapter 13. 

    Chapter 12 Filings in the Southern Region 

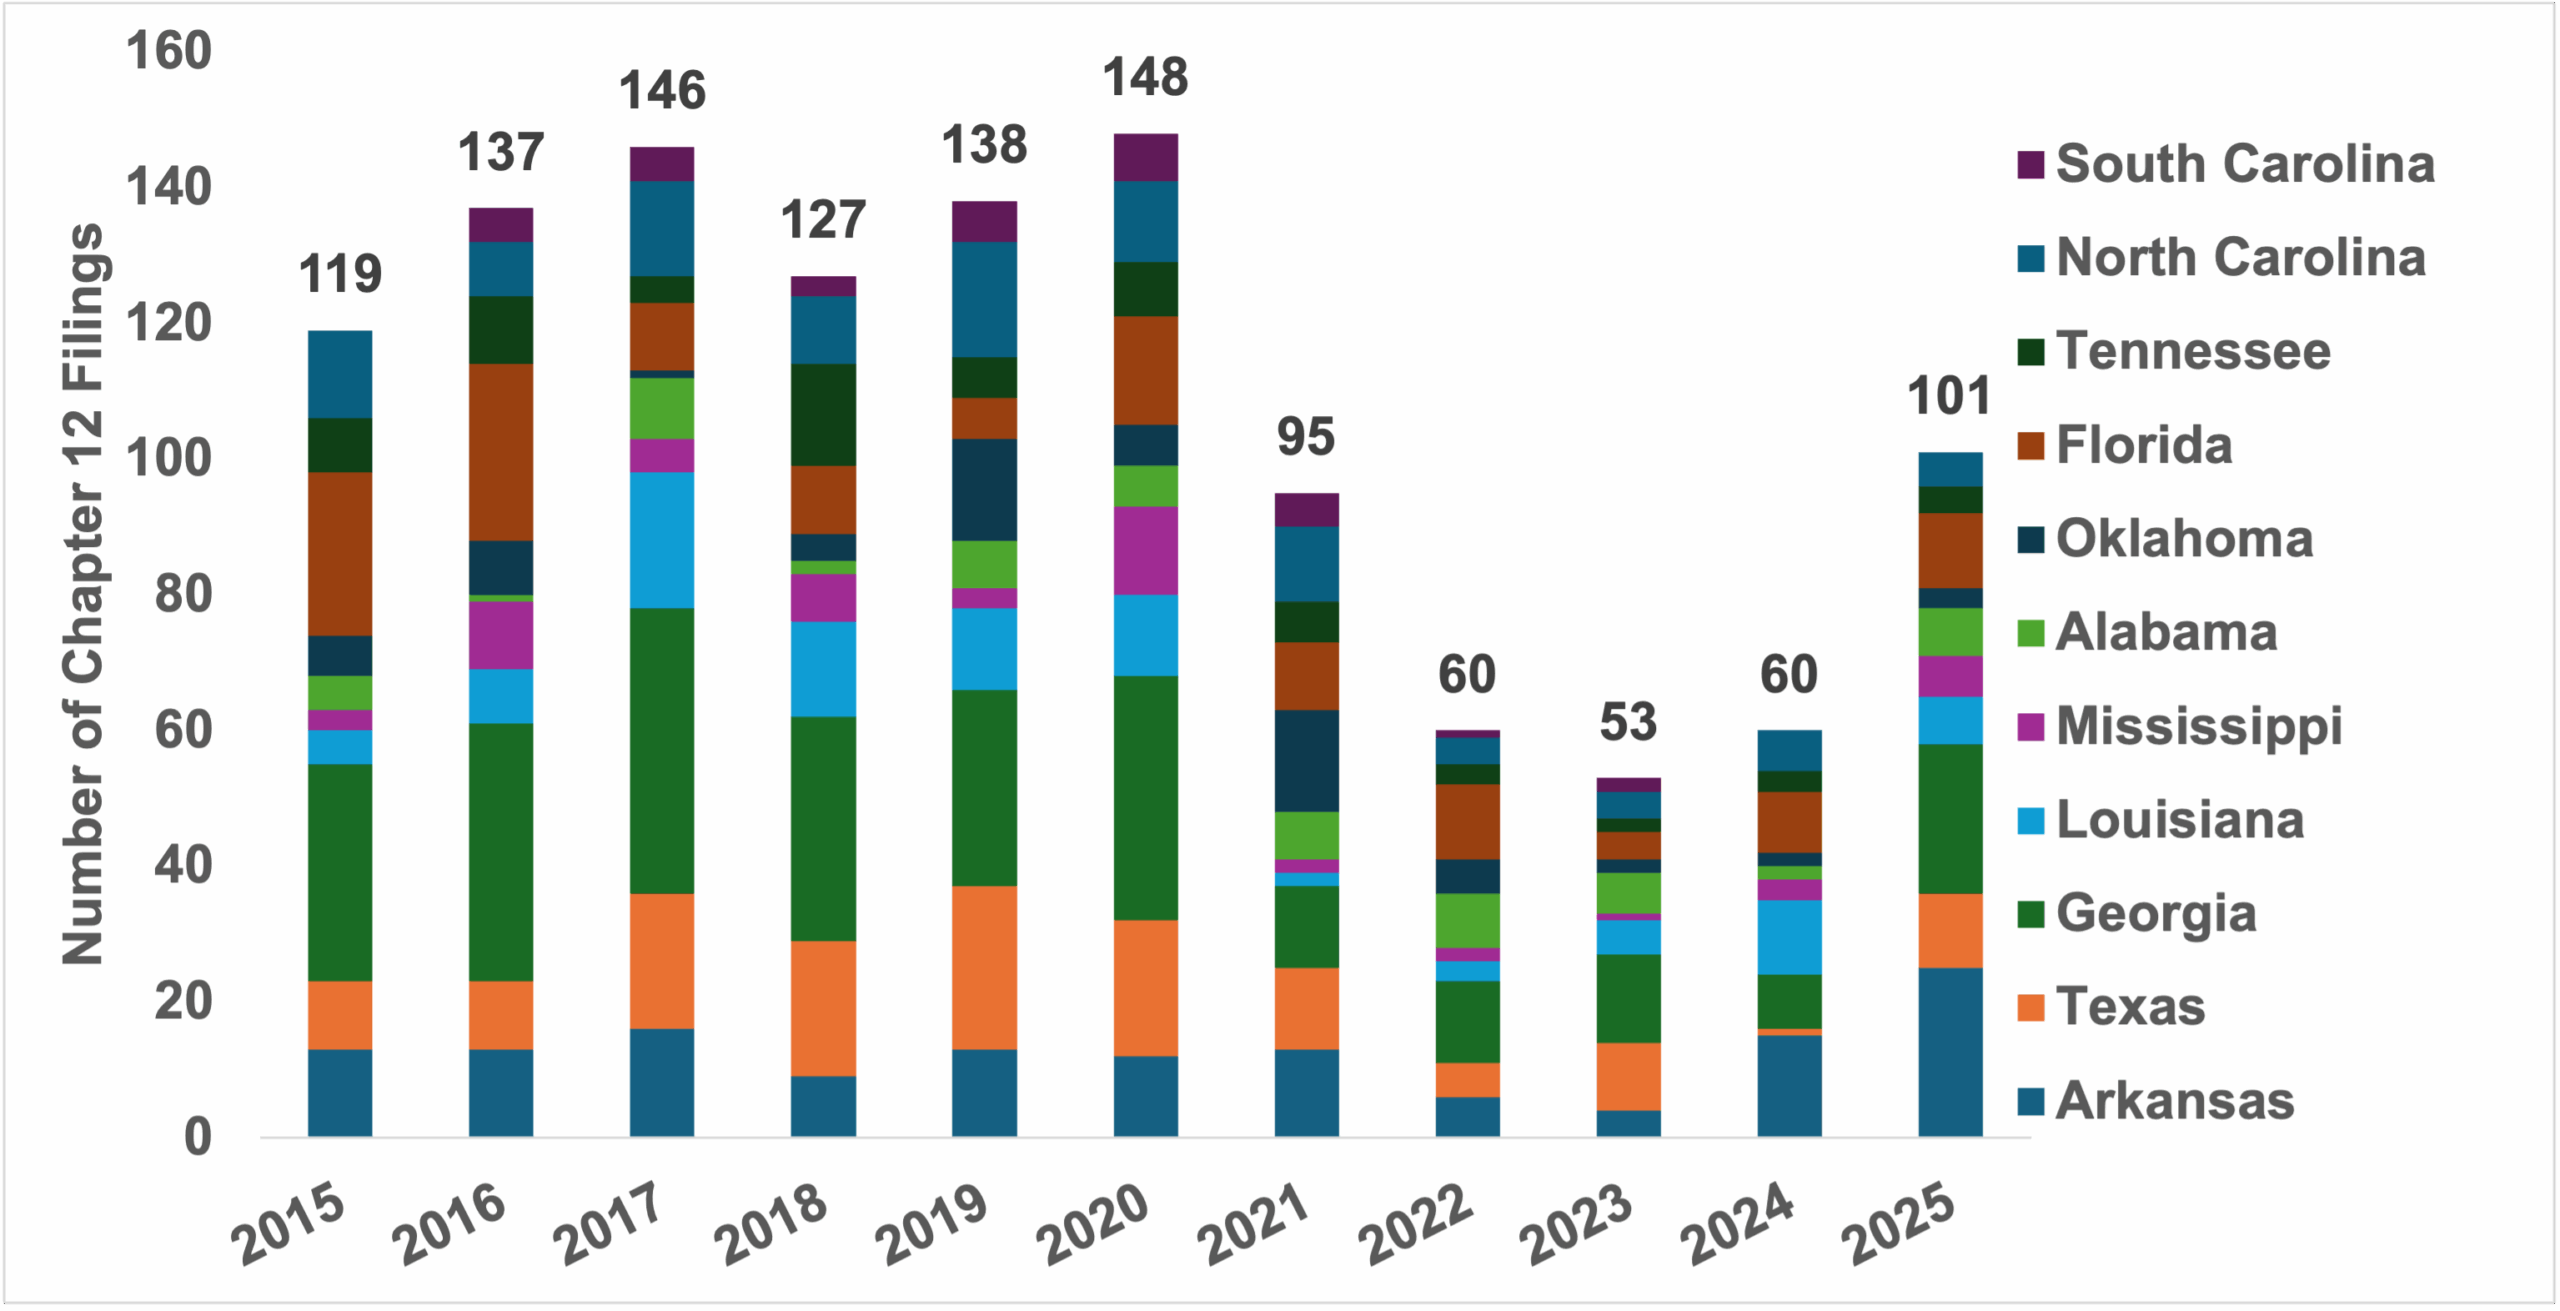
    Data from 2015 to 2025 (measured from July 1 of the preceding year to June 30 of the labeled year) highlight important developments in Chapter 12 bankruptcy trends across the southern United States. Total Chapter 12 filings in the south have fluctuated over the past decade, peaking at 148 filings in 2020 before sharply declining to 53 in 2023 (see Figure 1). This decline aligns with post-pandemic trends across the United States due in part to government assistance and higher commodity prices, which improved short-term farm financial conditions. However, the most recent year of data (e.g., July 1, 2024 – June 30, 2025) shows a rebound to 101 filings. This may suggest that on-farm financial pressures are intensifying for southern producers. 

    Figure 1. Total Chapter 12 Filings for the Southern Region, 2015 – 2025

    *Note: 2025 = July 1, 2024 – June 30, 2025
    Source: UScourts.gov

    Digging deeper into state-level filings reveals that Georgia, Texas, and Arkansas account for a large share of filings over the 2015 to 2025 period. Georgia recorded the highest total filings, with more than 30 annually through 2018 and peaking at 42 in 2017. Arkansas has shown a significant surge in the most recent reporting period from 4 filings in 2023 to 25 in 2025 (Figure 1). This increase in Chapter 12 filings signals financial stress in Arkansas despite more stable trends in neighboring states (e.g., Mississippi). The current state-level differences may point to uneven financial pressures within the southern region, which is likely shaped by crop mix, farm size, or local crop production systems. The 2025 rebound in filings could be due to the cyclical nature of agriculture following several years of low bankruptcy filings.  But the increase also raises concerns about on-farm financial stress in southern agriculture. For smaller family-owned operations with limited liquidity, these pressures can become untenable, making bankruptcy not just an option, but a necessity. 

    Farm operations are often generational legacies, woven into family identity and rooted in the community. For many, bankruptcy is not only a financial loss but also an emotional burden. Bankruptcies serve as a reminder that financial stress in agriculture extends beyond the farm. It often impacts families, rural communities, and personal well-being. Tight (or non-existent) margins, increasing input costs, and mounting debt pressures can erode both financial stability and a producer’s sense of identity. These realities highlight the importance of timely support through open conversations, proactive engagement, and access to financial and mental health resources, including dedicated services such as the National AgriStress Helpline (1-833-897-2474) and the SAMHSA Disaster Distress Helpline (1-800-985-5990), both of which are available 24 hours a day, seven days a week. As pressure continues to mount, directly addressing farm stress is essential to sustaining farm operations and safeguarding the vitality of families and rural communities. 


    References

    Loy, Ryan, and Hunter Biram. “The Disparity Between Crop Prices Received and Input Prices Paid.” Southern Ag Today 4(28.3). July 10, 2024. Permalink

    Fields, Erica, and Ronald Rainey. “Identifying Financial Stress in Farmers and Ranchers: A Guide for Families, Friends, and Agricultural Community Stakeholders.” University of Arkansas Factsheet. Retrieved from: https://www.uaex.uada.edu/publications/pdf/FSA96.pdf

    USDA-Economic Research Service (2025). Farm Sector Income & Finances: Highlights from the Farm Income Forecast. Retrieved from: https://www.ers.usda.gov/topics/farm-economy/farm-sector-income-finances/highlights-from-the-farm-income-forecast/

    USDA- Economic, Statistics, and Market Information System. (2025). Agricultural Prices. Retrieved from: https://usda.library.cornell.edu/concern/publications/c821gj76b?locale=en

    United States Courts. (2025). Caseload Statistics Data Tables. Retrieved from: https://www.uscourts.gov/statistics-reports/caseload-statistics-data-tables


    Loy, Ryan, Erica Barnes Fields, and Ronald Rainey. “Tracking Chapter 12 Bankruptcies in the South: 2015 – 2025 Trends and Identifying On-Farm Stress.Southern Ag Today 5(37.1). September 8, 2025. Permalink