Author: H. Scott Stiles

  • Examining August FSA Data to Forecast Final Cotton Acreage

    Examining August FSA Data to Forecast Final Cotton Acreage

    Since 2011, the USDA’s Farm Service Agency (FSA) has provided monthly reports of crop acreage beginning in August.   This information is based on farmer reports of planted, prevented planted, and failed acres received and summarized to date.  A final acreage summary is released in January.  Beginning in October (occasionally in September), these data are used by USDA’s National Agricultural Statistics Service (NASS) for comparison to survey-based planted acreage estimates in the monthly Crop Production report. 

    In this article, we examined the relationship between the preliminary August FSA planted acreage and final FSA planted acreage for cotton.  We also looked at the relationship between final FSA planted acreage and NASS planted acreage.

    While FSA acreage data represents a census of planted acreage enrolled in farm programs, the FSA acreage data does not function as official USDA planted acreage estimates (because not all farms are enrolled in the farm programs administered by the FSA). The official planted acreage estimates are the responsibility of NASS, the statistical agency of the USDA.  

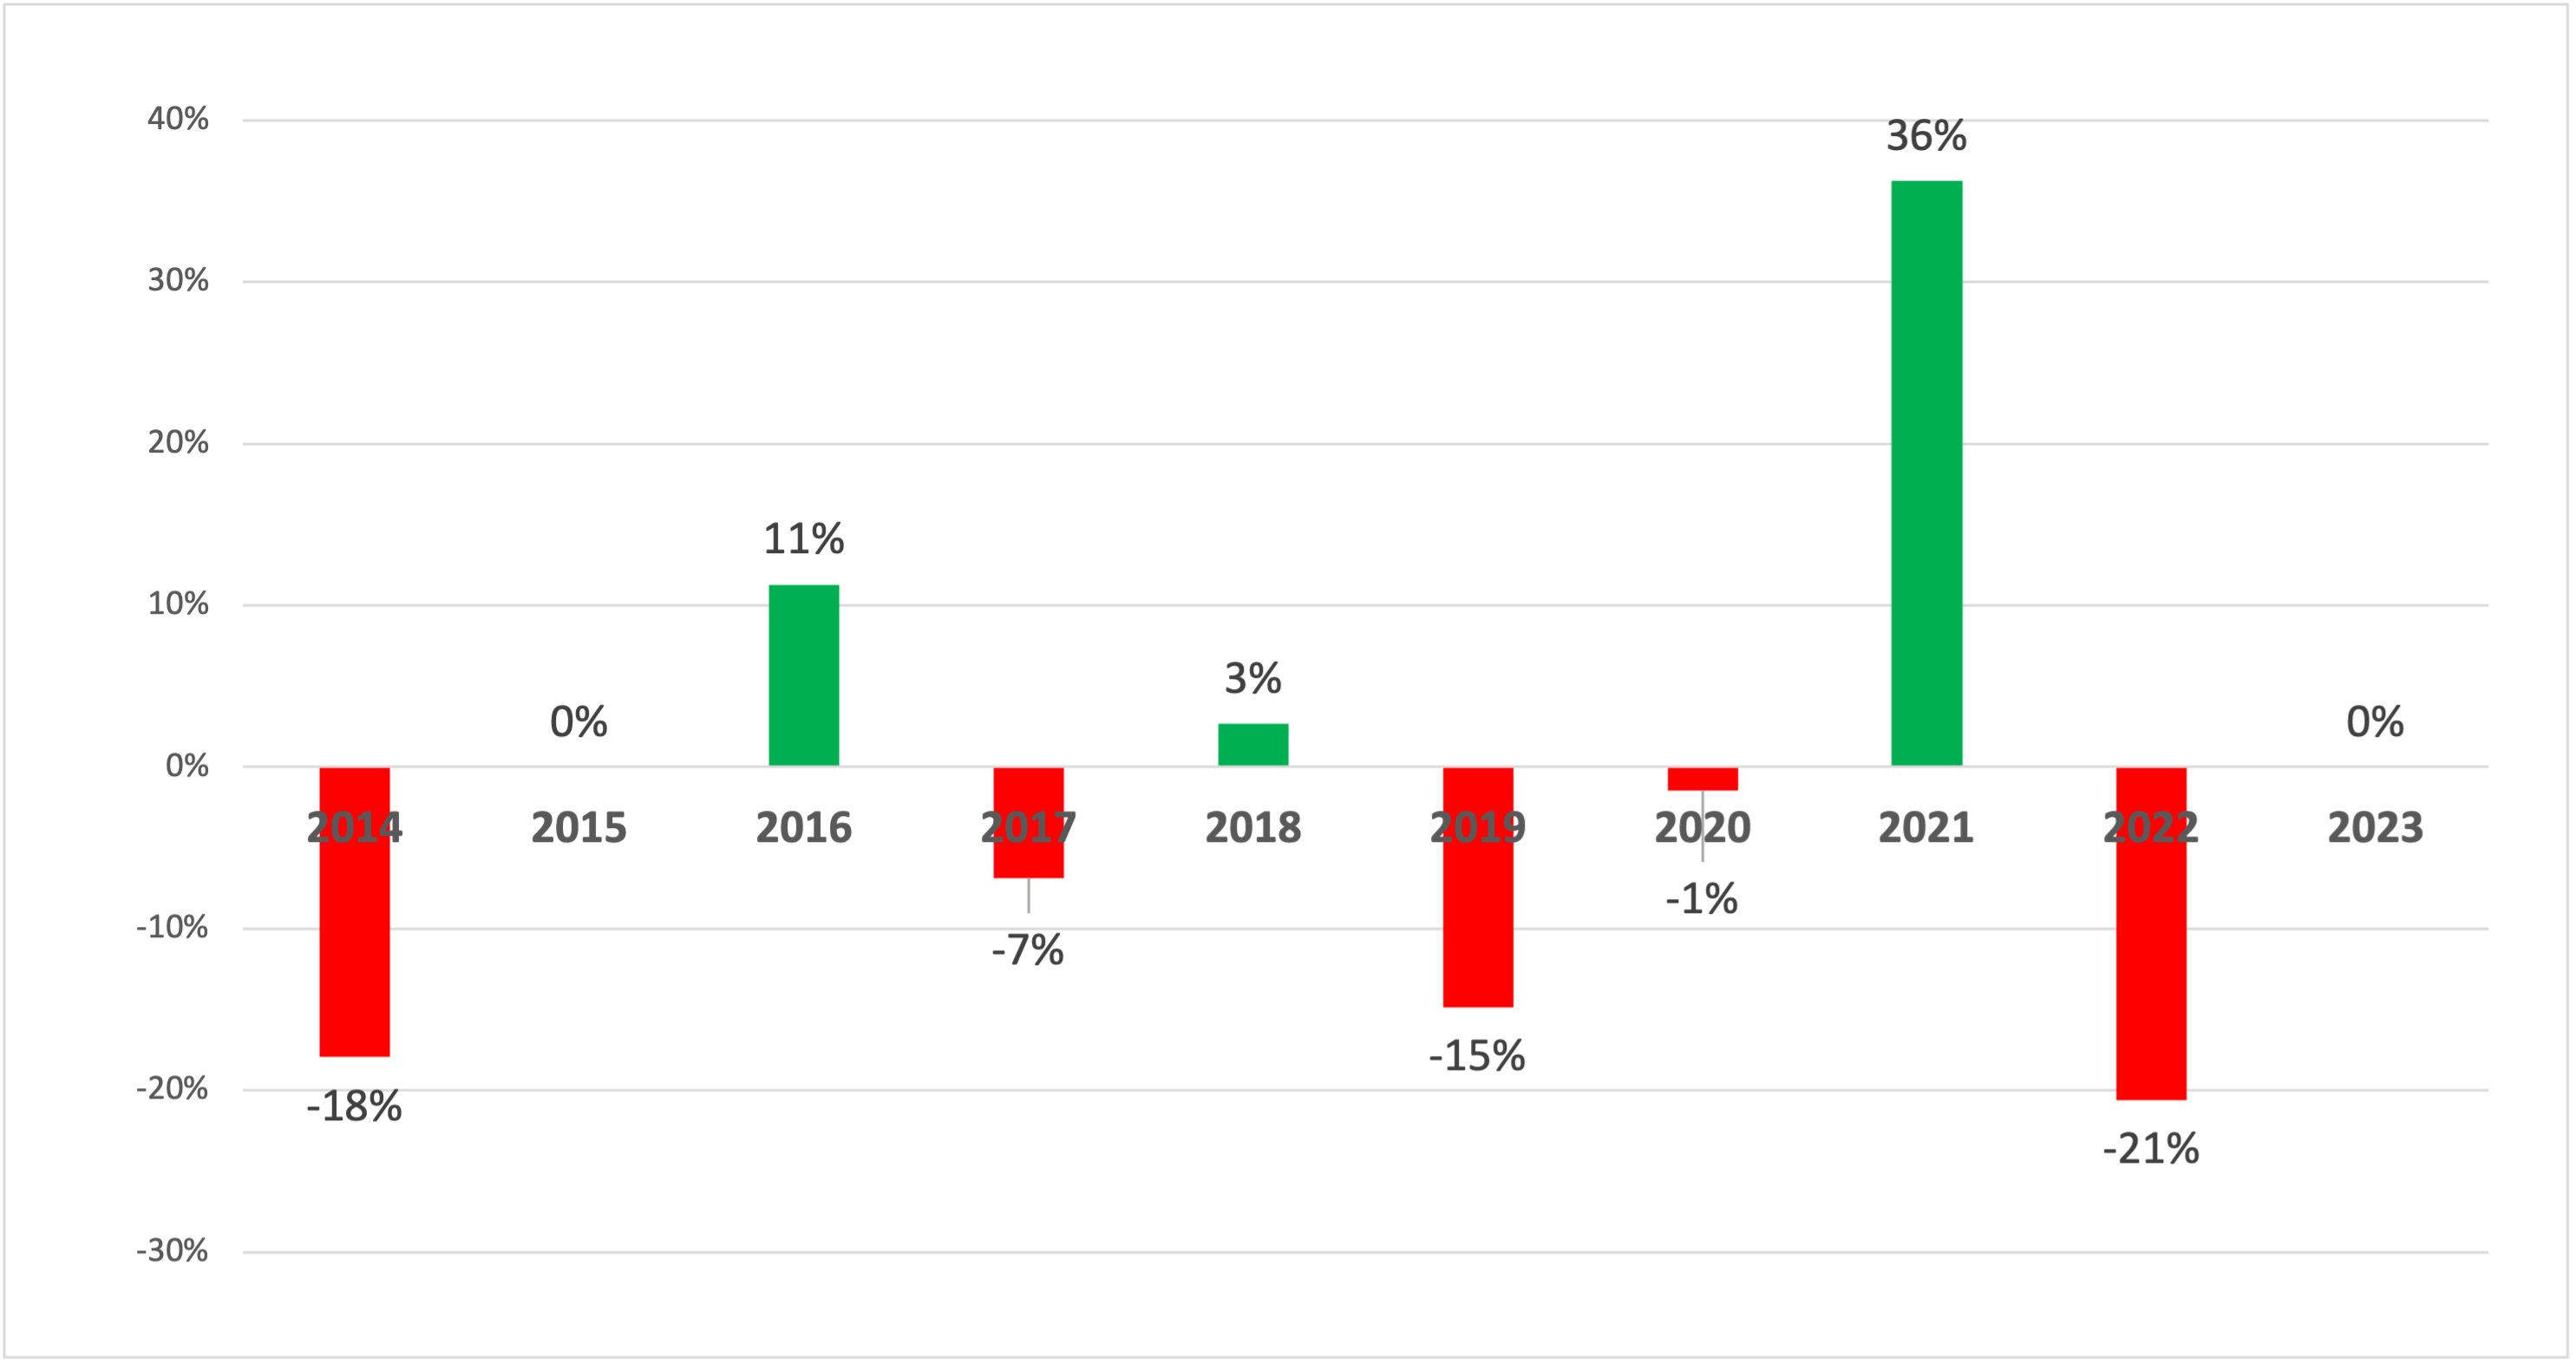
    As a starting point, we reviewed the relationship between the August and final (i.e., January) FSA planted acreage estimates for cotton (upland and Pima combined).  As noted in Figure 1, reporting during August 2020 was off significantly due to the reporting extension during the COVID pandemic. The data pre-2020 and post-2020 indicate all but a small percentage of planted acreage for cotton is generally reported to the FSA by August.  For example, over the 2015-2019 period, the average ratio of preliminary to final FSA planted acreage for cotton was 98.9 percent.  In recent years, 2021-2024, the average ratio increased to 99.7 percent in August. Arguably the period 2021-2024 is the most representative part of the sample for making 2025 forecasts. 

    Figure 1. Ratio of August to Final January FSA Estimate of U.S. Cotton Planted Acreage, 2015-2024

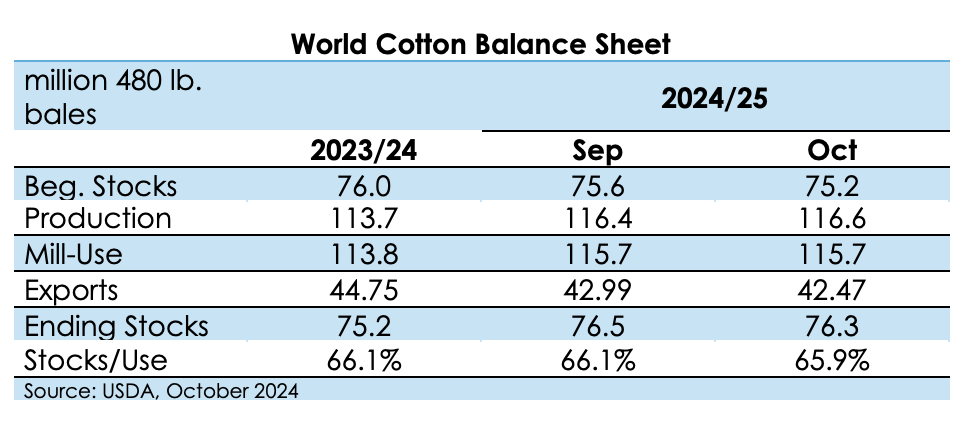
    We also looked at the relationship between the final FSA planted acreage and final NASS planted acreage (Table 1).  In the years 2015-2024, the acreage relationship is quite consistent.  For cotton, the final FSA estimate of planted acreage averages 98.2 percent of final NASS planted acreage with a range of 0.9 percent.   The consistency of the relationships can be attributed to the fact that enrollment in FSA farm programs varies relatively little from year to year.

    TablTable 1. U.S. Planted Acres of Cotton Estimated by NASS and Reported to FSA, 2015-2024

    YearNASSFSADifferenceFSA/NASS(%)
    20158,580,5008,450,939129,56198.5%
    201610,073,5009,927,191146,30998.5%
    201712,717,50012,413,314304,18697.6%
    201814,081,30013,824,448256,85298.2%
    201913,722,70013,405,957316,74397.7%
    202012,086,00011,834,619251,38197.9%
    202111,206,50011,025,710180,79098.4%
    202213,749,00013,530,779218,22198.4%
    202310,230,00010,077,091152,90998.5%
    202411,183,00010,997,089185,91198.3%
         
    Average  214,28698.2%
    Low  129,56197.6%
    High  316,74398.5%
    Source: USDA Farm Service Agency and National Agricultural Statistics Service.

    In 2025, historic spring rainfall disrupted cotton planting in some states, which has made for a challenging year.  Many industry observers questioned the NASS June Acreage survey that delivered much higher-than-expected cotton acreage estimates for the Midsouth region. The findings in USDA’s first monthly acreage report of 2025 will be of particular interest to the cotton industry.  The report will be released on August 12th and can be found at this link:  FSA Crop Acreage Data. The information in these reports is widely followed by the market for clues about possible future revisions to the official USDA planted acreage estimates. Based on recent history, this report is expected to provide a strong indicator for overall cotton acreage in 2025. 


    Stiles, H. Scott. “Examining August FSA Data to Forecast Final Cotton Acreage.Southern Ag Today 5(32.3). August 6, 2025. Permalink

  • June WASDE Delivers Sharp Reduction in U.S. Rice and Cotton Crops

    June WASDE Delivers Sharp Reduction in U.S. Rice and Cotton Crops

    The USDA’s June Supply and Demand report (WASDE) is generally characterized as a “quiet” report with few, if any, changes from the previous month.  That held true for the U.S. corn and soybean outlook.  The only adjustments USDA made to the 2025/26 corn balance sheet included a 50-million-bushel reduction in beginning stocks.  This reflected an increase in exports for 2024/25. With no demand changes for 2025/26, ending stocks were lowered 50 million bushels to 1.75 billion. The season-average farm price received by producers was unchanged at $4.20 per bushel. There were no changes this month to the U.S. 2025/26 soybean outlook, with new crop ending stocks remaining at 295 million bushels. The U.S. season-average soybean price is forecast at $10.25 per bushel.  On the World balance sheet, Brazil’s production estimate was unchanged at 169 million metric tons and Argentina’s was also unchanged at 49 million metric tons.

    One of the big surprises in the June WASDE was the aggressive cut to 2025 long-grain rice production.  Not waiting for the June Acreage survey, USDA made note of “the excessive spring precipitation in the Delta” and anticipated this would result in lower rice acreage in the region compared to the March Prospective Plantings. On the long-grain balance sheet, production was lowered by a sizeable 7.5 million cwt. (-4.5%) this month to 159.7 million cwt (see Table 1).  Partially offsetting the sharp production cut was a 1 million cwt. increase in imports and a 3 million cwt. reduction in domestic and residual use.  The net result was a 3.5 million cwt reduction in 2025/26 ending stocks to 34 million. This is slightly below the 35.3 million ending stocks of 2024/25.  The projected 2025/26 long-grain season-average farm price was increased by $0.50 per cwt to $12.50 or $5.63 per bushel.

    In another surprise move, USDA wasted no time lowering their expectations for the 2025/26 U.S. cotton crop.  Pointing to the excessive rain and planting delays in the Delta, harvested acreage was lowered 2 percent this month to 8.19 million acres (see Table 2). The national average yield for 2025/26 was reduced more than 1 percent from last month to 820 pounds per acre, also because of the conditions in the Delta. As a result, the production forecast was reduced 500,000 bales to 14.0 million, below the 14.4 million bales produced in 2024/25 and the second smallest crop in the past decade. Beginning stocks for 2025/26 were reduced 400,000 bales following a corresponding increase in projected exports for 2024/25. The net result being a 900,000 bale reduction in 2025/26 ending stocks to 4.3 million bales, very close to the 4.4 million bale 2024/25 carry-over. The projected season-average price for 2025/26 was unchanged this month at 62 cents per pound.

    As a reminder, USDA will release its Acreage report on June 30. It will provide survey-based indications of planted and harvested area.  The acreage findings of the survey will be used in the July 11th WASDE. A link to the June 2025 WASDE report may be found here.

    Table 1. U.S. Long-Grain Rice Supply and Demand
    2025/26Monthly Change 
    unit: million cwt.2024/25MayJune
    Beginning Stocks19.335.335.30.0 
    Production172167.2159.7(7.5)
    Imports4243.044.01.0 
    Total Supply233.3245.5239.0(6.5)
    Domestic Use133140.0137.0(3.0)
    Exports6568.068.00.0 
    Total Use198208.0205.0(3.0)
    Carry-Over35.337.534.0(3.5)
    stocks-use %17.8%18.0%16.6%
    Avg. Producer Price ($/cwt.)$     14.20$           12.00$       12.50$     0.50
    Avg. Producer Price ($/bu.)$       6.39$              5.40$          5.63$     0.23
    PLC Reference Price ($/bu.)$       6.30$              6.30$          6.30$          –
    Proj. PLC Payment Rate ($/bu.)$             –$              0.90$          0.68$ (0.23)
    Source: USDA World Agricultural Supply and Demand Estimates, June 2025
    Table 2. U.S. Cotton Supply and Demand
    2025/26Monthly Change
    unit: million 480# bales2024/25MayJune
    Beginning Stocks3.154.804.40(0.400)
    Production14.4114.5014.00(0.500)
    Imports0.010.010.010.000 
    Total Supply17.5719.3118.41(0.900)
    Mill Use1.701.701.700.000 
    Exports11.5012.5012.500.000 
    Total Use13.2014.2014.200.000 
    Carry-Over4.405.204.30(0.900)
    stocks-use %33.3%36.6%30.3%
    Avg. Producer Price ($/lb.) $     0.63  $                  0.62  $          0.62 $   0.000 
    Avg. Seed Cotton Price ($/lb.) $0.3401  $            0.3299  $    0.3279 $ (0.002)
    PLC Reference Price ($/lb.) $0.3670  $            0.3670  $    0.3670 $   0.000 
    Proj. PLC Payment Rate ($/lb.) $0.0269  $             0.0371  $    0.0391 $   0.002 
    Source: USDA World Agricultural Supply and Demand Estimates, June 2025

    Stiles, Scott, and Hunter Biram. “June WASDE Delivers Sharp Reduction in U.S. Rice and Cotton Crops.” Southern Ag Today 5(25.3). June 18, 2025. Permalink

  • Key Takeaways of the 2025 Prospective Plantings Report and Revisiting Reliability

    Key Takeaways of the 2025 Prospective Plantings Report and Revisiting Reliability

    On Monday, March 31st, USDA released the Prospective Plantings report. These acreage estimates are based primarily on surveys conducted by the National Agricultural Statistics Service (NASS) from February 18 to March 18. Principal crop acres planted were projected nationally at nearly 310 million acres, down roughly 1.3 million acres compared to last year. Corn acres are estimated at 95.3 million, up 4.7 million from last year and the third highest in modern history. Soybean planted acres are estimated at 83.5 million, down almost 3.6 million from last year.  Cotton acres are projected to be down 12% from last year, at 9.867 million acres, the lowest since 2015. Peanut acreage is projected at 1.95 million acres, up 8% from last year, and rice acres are projected at 2.895 million, down 1% from last year. All wheat acreage is projected at 45.35 million, down 2% from last year. The forecasts in the Prospective Plantings report confirm recent projections released at the February USDA Outlook Forum which had 2025 corn acres increasing by 3.4 million, a 3.1-million-acre reduction in soybeans, and 1.18 million fewer acres of cotton. 

    In fact, the USDA indicated in the Prospective Plantings report an even larger increase in corn acres compared to last year. Throughout the first quarter of 2025, new crop corn-soybean futures price ratios heavily favored corn over soybeans ranging from 2.20 to 2.31, driven by tightening U.S. and World corn stocks.  In fact, the price ratio averaged 2.24 during the window of the 2025 March Prospective Plantings survey compared to 2.49 in the same time frame last year. Cotton was expected to cede acres this year due to struggling demand, intense export competition with Brazil, and lower prices compared to other commodities. All states except Arizona and Kansas are projected to reduce cotton acreage from last year. Rice acres are also expected to decline on lower prices, static input costs and fierce export competition from Asian origins.  Seed availability for long-grain rice is an additional factor reducing acres. Futures price reaction from the March 31 report was subdued, with the findings in the Prospective Plantings report mostly in agreement with pre-report industry estimates.  New crop (i.e., Fall 2025) corn settled one-half cent lower, soybeans 9 ¾ cents lower, cotton 17 points ($0.0017) lower, and rice 1 ½ cents per cwt. lower.

    We now provide a 2025 update to a 2023 Southern Ag Today article addressing the reliability of the Prospective Plantings report (Biram and Maples, 2023). The NASS planted acreage projections across the U.S. continue to hold well with low predictive error and hold especially well for corn and soybeans over the 2016-2024 time span (Figure 1). There still remains a relatively small predictive error for rice and cotton over the same time span. The larger variance can be due to (1) the smaller sample size of farms and (2) the alternative crops available to plant in place of corn and soybeans. Most of the U.S. corn and soybean acreage is grown in the upper Midwest but tends to take up acreage across the entire U.S. which allows for a larger sample of farmers and less variance. In the south, farmers rotate corn and soybean crops with cotton, peanuts, and even some vegetables.  This makes it more difficult to project acres that may shift based on rotational needs, commodity prices, input costs, and weather.  

    We re-investigate the difficulty in projecting acreage by choosing the subsample of southern states to see if 1) there is more variance across the changes in corn and soybean acreages given a smaller sample and 2) the pattern of acreage changes across cotton and rice still holds in the subsample. We find this to continue to hold (Figure 2). We see more differences each year between prospective and actual planted acreages in corn and soybeans across southern states, and the general pattern of differences each year for cotton and rice still holds between the full U.S. sample and the southern subsample. This implies that we should generally not expect any significant changes in harvest price expectations driven by differences in planted acreages but rather look to future market-moving events. The continuation of drought conditions in West Texas has implications for the cotton market, while prolonged drought in the western Corn Belt has implications for corn and soybean production, as evidenced in 2023 (Gardner and Biram, 2023). Looking globally, we turn to weather-related impacts to the second Brazilian corn crop, as well as a future path on trade talks with our top trading partners (i.e., Mexico, Canada, and China). 

    Figure 1. Comparison of Prospective vs. Actual Planted Acreage across the U.S. (2016-2025)

    Figure 2. Comparison of Prospective vs. Actual Planted Acreage across Southern[1] States (2016-2025)


    [1] States included are Alabama, Arkansas, Florida, Georgia, Kentucky, Louisiana, Mississippi, North Carolina, Oklahoma, South Carolina, Tennessee, Texas, Virginia.

    References:

    Biram, Hunter, and William E. Maples. “Key Takeaways and Reliability of the 2023 Prospective Plantings Report.” Southern Ag Today 3(14.1). April 1, 2023. Permalink

    Gardner, Grant, and Hunter D. Biram. “USDA Acreage Report Results: Price and Crop Insurance Impacts.” Southern Ag Today. July 3, 2023. Permalink

    NASS/USDA. Prospective Plantings. National Agricultural Statistics Service, U.S. Department of Agriculture, March 2025. Retrieved from: https://release.nass.usda.gov/reports/pspl0325.pdf


    Stiles, H. Scott, and Hunter Biram. “Key Takeaways of the 2025 Prospective Plantings Report and Revisiting Reliability.Southern Ag Today 5(14.3). April 2, 2025. Permalink

  • October WASDE Report Decreases U.S. Cotton Production, Mill Use and Exports

    October WASDE Report Decreases U.S. Cotton Production, Mill Use and Exports

    The October 2024 WASDE report featured a sizeable cut to U.S. cotton yield and production forecasts.  This was largely the result of impacts from Hurricane Helene on the southeast region of the Cotton Belt. USDA reduced the U.S. average all cotton yield by 18 pounds to 789 pounds per acre.  If realized, this would be the lowest yield since 2015. USDA in turn lowered production by approximately 310,000 bales, which put the 2024 crop estimate at 14.2 million bales.  No adjustments were made to planted and harvested area estimates.  Beginning Stocks were left unchanged at 3.15 million bales.  Total supply was reduced to 17.36 million bales on this lower production estimate. 

    On the demand side of the U.S. balance sheet, USDA reduced 2024/25 domestic mill use by 100,000 bales to 1.8 million and lowered its export forecast by 300,000 bales to 11.5 million. The current mill use estimate would be the lowest since the 1884/85 marketing year, when approximately 1.7 million bales were used (Meyer and Dew, 2023).  U.S. cotton export weekly net sales are off to a sluggish start in the new crop (2024/25) marketing year. Cumulative export sales for the 2024/25 crop are down 10 percent from last year, as of the week ending October 3rd.  Notably, U.S. cotton sales to China are off 74 percent from a year ago, reflecting USDA’s outlook for a 6-million-bale reduction in China’s import needs this year. In recent years, China has consistently been the single largest buyer of U.S. cotton.  However, in the current marketing year, China purchases lag Pakistan, Vietnam, Mexico and Turkey. Of note, in 2023/24, China’s imports reached an 11-year high of 15 million bales.  A few key factors led to last year’s surge in imports, including purchases for government reserves, lower domestic production, and lower foreign prices relative to domestic prices.  Imports for government reserves in 2023/24 amounted to one-third of China’s total imports, or roughly 5 million bales. With an increase in government reserves and an 800,000-bale increase in cotton production this year, China’s imports are expected to decline sharply in 2024/25, falling below the 5-year average of 9.8 million bales. 

    Total demand for U.S. cotton was lowered 400,000 bales this month, which left 4.1 million bales in ending stocks. Despite a large cut in production, ending stocks were increased 100,000 bales from the September estimate as larger reductions in mill use and exports offset sizeable productions losses in Georgia and the Carolinas. 

    The 2024/25 season average upland farm price was unchanged at 66 cents per pound, down 13.3 percent from last year’s 76-cent average.  This price would be the lowest season average farm price since 2019/20. There were no revisions to the 2023/24 U.S. cotton balance sheet.

    USDA’s October projections for the world cotton balance sheet included a decrease in beginning stocks, an increase in production, stable consumption, and slightly lower ending stocks.   World production was increased over 200,000 bales to 116.64 million bales from 116.42 million last month. Notable increases were in China (+400,000 bales) and Brazil (+100,000 bales) which more than offset the 300,000 bale reduction in the U.S. crop.  Brazil is expected to produce a second consecutive record crop of 16.8 million bales in 2024/25.  Brazil surpassed the U.S. last year in cotton production and exports, becoming the world’s largest cotton exporter and third largest producer, behind China and India.

    World cotton trade was reduced over 510,000 bales to 42.47 million, mainly due to a 500,000-bale reduction in China’s imports.  For 2024/25, China’s imports are estimated at 9 million bales, down from 9.5 million last month and 15 million bales last year.  China’s cotton inventories relative to use are comfortable. With production of 28.2 million bales, ending stocks in China are expected to be 36.24 million at the end of the marketing year.  Thus, domestic stocks would be equivalent to 95 percent of China’s 38 million bale projected mill use.  World ending stocks were reduced 160,000 bales from last month to 76.3 million, up from 75.2 million in the 2023/24 marketing year. There were no significant revisions to the 2023/24 global balance sheet.

    USDA did note in its October Crop Production report that survey work for the field crop forecasts occurred primarily from September 28 to October 7. While much of the survey work did occur after the most severe weather from Hurricane Helene, the full impact of the storm may not be reflected in the current report.

    Reference:

    Meyer, L., & Dew, T. (2023). Cotton and wool outlook: December 2023 (Report No. CWS-23k) U.S. Department of Agriculture, Economic Research Service.

    USDA. (2024). World Agricultural Supply and Demand Estimates. (WASDE-653) U.S. Department of Agriculture, World Agricultural Outlook Board. October 11.


    Stiles, Scott. “October WASDE Report Decreases U.S. Cotton Production, Mill Use, and Exports.” Southern Ag Today 4(43.3). October 23, 2024. Permalink

  • Review of 2023 STAX Payments and Implications for Price Risk Management in Cotton

    Review of 2023 STAX Payments and Implications for Price Risk Management in Cotton

    The USDA Risk Management Agency (RMA) published final 2023 county yields for upland cotton on July 3, 2024.  Upland cotton producers who purchased 2023 crop year Stacked Income Protection Plan (STAX) policies are now receiving final indemnity payments, thus contributing to current cash flow.  Based on RMA’s Summary of Business reporting as of July 15, total STAX indemnities across all states for 2023 will slightly exceed $352.7 million dollars.

    STAX is a crop insurance product for upland cotton that provides coverage for a portion of the expected revenue in an area. Most often, the “area” will be a specific county, but may include other counties or production practices as necessary to obtain a credible amount of data to establish an expected yield and premium rate. STAX coverage is available in all counties where crop insurance for upland cotton is currently offered.

    According to USDA-RMA data, 4.87 million acres of upland cotton were insured under STAX in 2023 (Figure 1).  This was 48 percent of nearly 10.1 million planted acres.  In the majority of cotton producing states, STAX participation is much lower than 48 percent.  The high concentration of U.S. cotton acreage in Texas inflates the level of total participation in the STAX program.  On a regional basis, the Southwest (Kansas, Oklahoma, and Texas) accounted for 70 percent of the total acres enrolled in STAX last year.  This region also has the largest concentration of upland cotton acreage in the U.S at almost 6.1 million acres.  Texas alone planted over one-half or 5.55 million acres of the U.S. upland cotton total in 2023. Furthermore, Texas accounted for 66 percent, or 3.2 million of the 4.87 million total acres insured under STAX. 

    Figure 1. State-Level Percentage of Upland Cotton Planted Acres Enrolled in STAX (2023)

    STAX pays a loss on an area-wide basis, and an indemnity is triggered when there is an area loss in gross revenue. Gross revenue is a function of both yield and price.  Common to many crop insurance products, STAX utilizes a futures price (i.e. December cotton futures) to determine the Projected and Harvest prices used to calculate indemnity payments.  For most states in 2023, revenue losses resulted solely from below-average yields, which means that Projected and Harvest prices in those states were either the same or Harvest prices were higher than Projected prices.  

    The state level price discovery periods and the 2023 Projected and Harvest prices for cotton are summarized in Table 1.  Only Kansas, New Mexico and Oklahoma had a lower Harvest Price that may have contributed to revenue losses. Thus, for fourteen (14) of the seventeen (17) cotton producing states, any STAX payments were the result of actual yields being at least 10 percent less than the expected county/area yield (assuming the 90 percent area loss trigger was selected).

    Table 1. State Level Crop Insurance Price Discovery Periods for Cotton.

    State(s)Projected Price Discovery PeriodHarvest Price Discovery Period2023 Projected Price/lb2023 Harvest Price/lb
    Southern TX12/15 – 1/149/1 – 9/31$0.81$0.87
    AL, AZ, AR, CA, FL, GA, LA, MS, NC, SC, central TX1/15 – 2/1410/1 – 10/31$0.85$0.85
    MO, northern TX, TN, VA2/1 – 2/2810/1 – 10/31$0.84$0.85
    KS, NM, OK2/1 – 2/2811/1 – 11/30$0.84$0.78
    Source: USDA, Risk Management Agency

    Since the inception of the STAX program ten years ago, in response to the provisions in the 2014 Farm Bill, some consideration can be given to how effective the product is as a price risk management tool.  Although coverage levels can vary, the majority of STAX policies in the U.S. would see indemnities begin when area revenue falls below 90% of its expected level.  In selecting a crop insurance product, growers may consider the likelihood of a STAX revenue loss being generated solely by declining prices.  Figure 2 illustrates that over the past decade Harvest Prices relative to Projected Prices have experienced a 10 percent or greater decline in three crop years in the period 2014 to 2023, with an average change of -1.2%. Thus, similar to 2023, STAX most often protects against either only yield effects or a combined yield and price effect.  

    Figure 2. Percent Price Change from Projected to Harvest Price*, December Cotton Futures (2014 – 2023)

    Source: USDA, Risk Management Agency.
    *Price discovery periods for: AL, AZ, AR, CA, FL, GA, LA, MS, NC, SC, central TX.

    References

    USDA-RMA (2024, July). USDA Risk Management Agency Summary of Business. 

    URL: https://www.rma.usda.gov/SummaryOfBusiness.

    USDA-RMA (2024, July). USDA National Agricultural Statistics Service QuickStats. 

    URL: https://quickstats.nass.usda.gov/.


    Stiles, H. Scott, and Hunter D.Biram. “Review of 2023 STAX Payments and Implications for Price Risk Management in Cotton.Southern Ag Today 4(31.1). July 29, 2024. Permalink