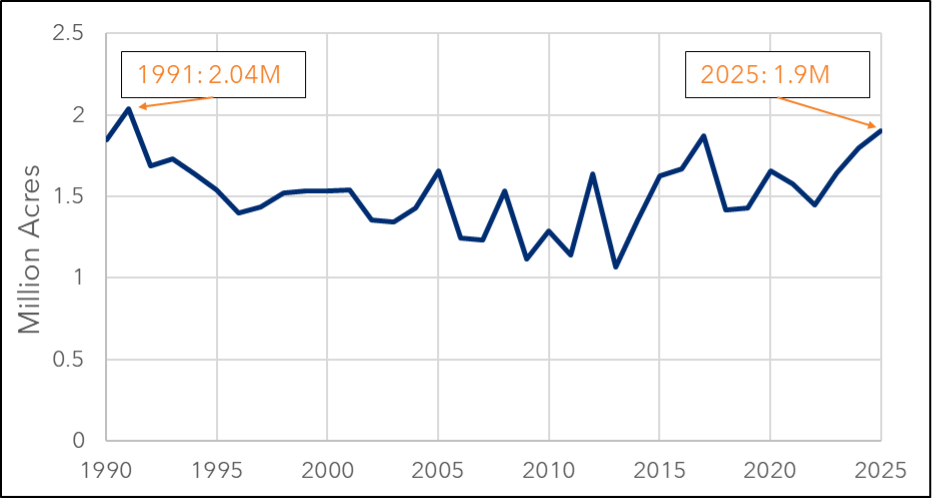
In 2025, U.S. peanut planted area reached its highest mark since 1991, at 1.95 million acres, as was confirmed by the recently released Crop Production Annual Summary. This increase in peanut acreage was driven by a 70,000-acre jump in Georgia and a 45,000-acre increase in Texas. Mississippi was the only major peanut-growing state that had a decrease in peanut planted area compared to 2024. At the end of the 2025 growing season, 97.6% of the area planted was harvested, which was the highest rate since 2014.
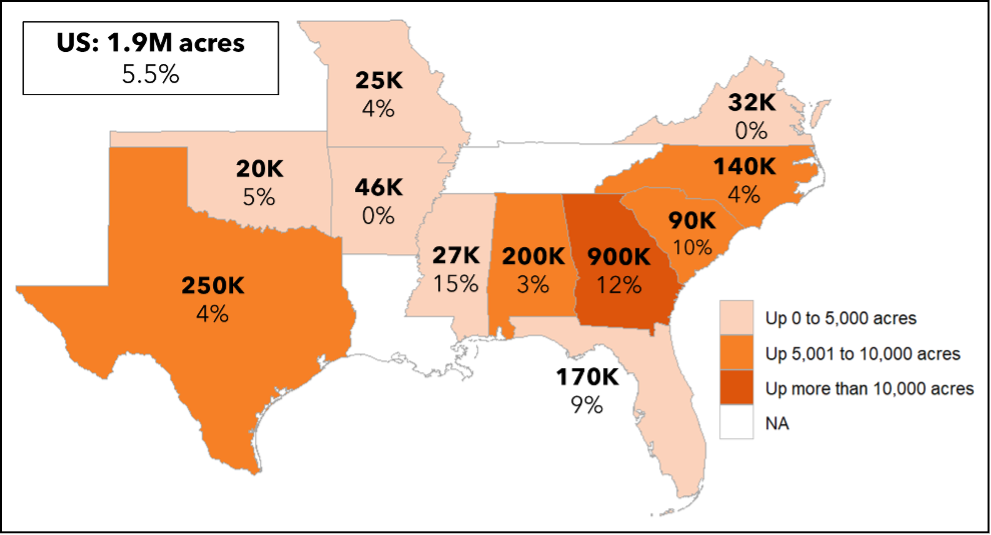
Figure 1: 2025 Peanut Yield by State (lb./acre) and Percent Change from 2024
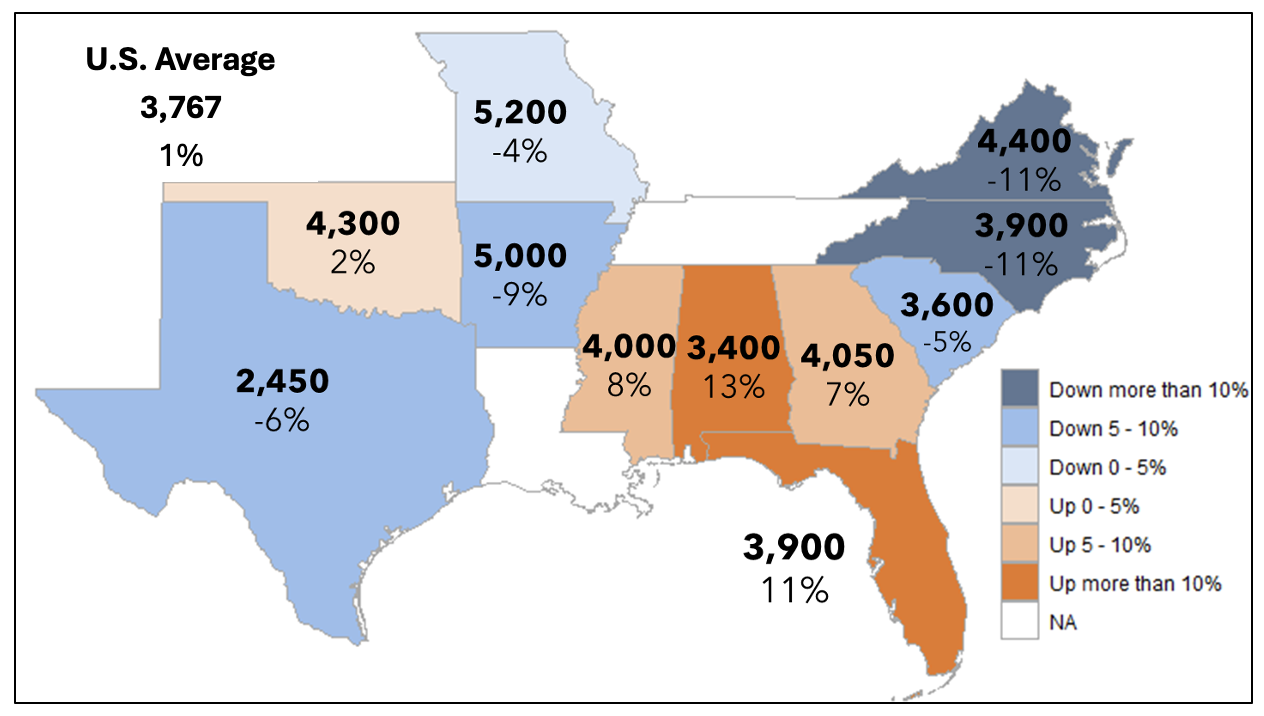
The U.S. had a middling peanut yield, averaging 3,767 lb. per acre (Figure 1). While this yield was 1% higher than 2024, it falls about 130 lb. per acre below the previous five-year average. Georgia – the leading producing peanut state – averaged 4,050 lb. per acre, which marks a 7% increase from last year’s value, but still 12% below the high in 2012. Alabama, Florida, and Mississippi observed similar yield increases. Oklahoma had a small increase of just 2%, but the second-highest yield on record for the state. In contrast, Texas had a significant decrease in yield, at 2,450 lb. per acre, the smallest state yield since 1995, when Texas farmers produced 2,000 lb. per acre.
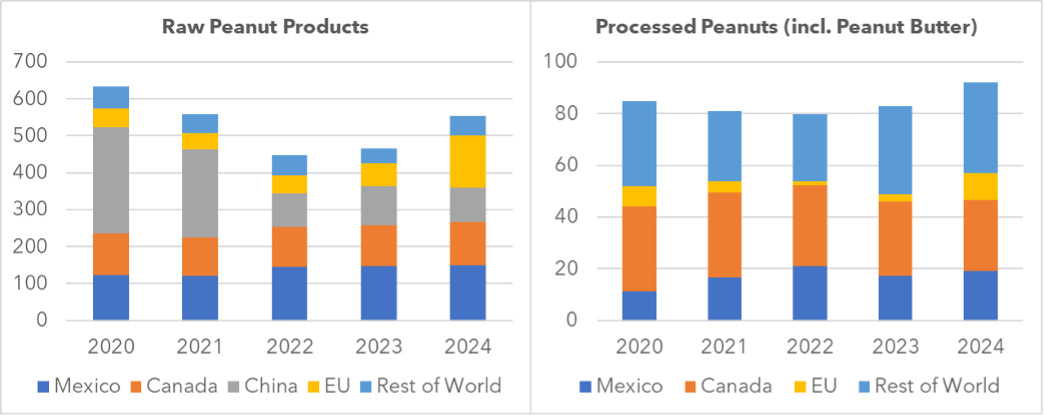
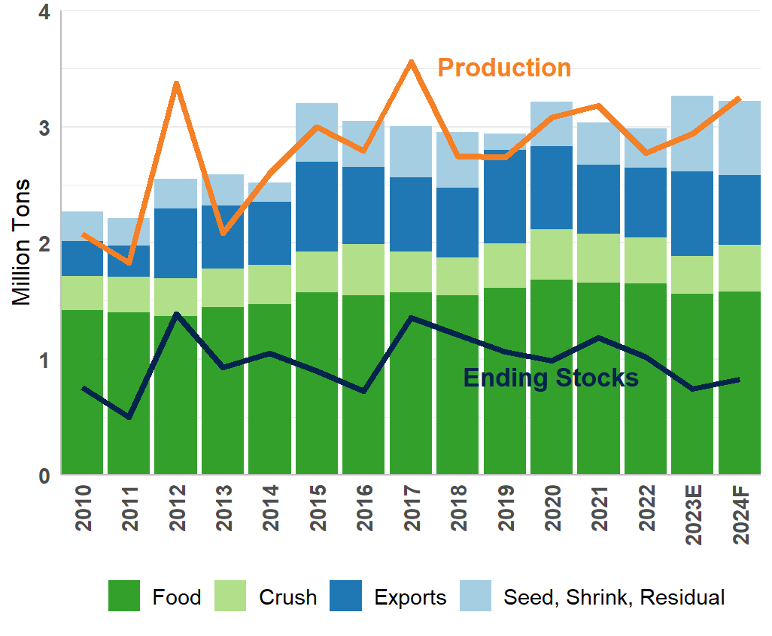
Figure 2: Peanut Production, Disappearance, and Ending Stocks by Year
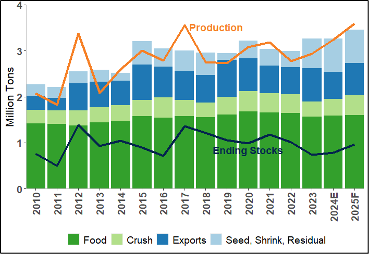
Overall, peanut production was lower than expected by about 110 thousand tons from what was forecast in September (Rabinowitz, 2025). However, at an estimated 3.59 million tons in 2025, total production was still up 11%, and edged out the 2017 total of 3.56 million tons for the highest on record (Figure 2). While total peanut disappearance is forecast to increase 6% for the 2025-26 marketing year, it is expected to fall short of production, leading to a 24% increase in ending stocks. As we look into 2026, peanut prices are lower than last year, but competing crops’ prices are not looking any better. Corn prices are slightly lower than they were last year in mid-January, with September futures prices down to around $4.40 per bushel. December cotton futures are in the 68-cent-per-lb range, similar to this point last year. As a result, I expect that we will see another sizeable peanut planted area in 2026.
References
Rabinowitz, Adam. “Will the 2025 Peanut Crop Set a New Record?” Southern Ag Today 5(44.3). October 29, 2025. https://southernagtoday.org/2025/10/29/will-the-2025-peanut-crop-set-a-new-record/
USDA-ERS. Oil Crops Outlook. January 14, 2026. Available at: https://usda.library.cornell.edu/concern/publications/j098zb08p
USDA-NASS. Crop Production Annual Summary. January 12, 2026. Available at: https://usda.library.cornell.edu/concern/publications/k3569432s
Sawadgo, Wendiam. “Coming off record peanut production, where do we go in 2026?” Southern Ag Today 6(5.3). January 28, 2026. Permalink