Author: William E. Maples

  • USDA Projects Largest Corn Supply in History

    USDA Projects Largest Corn Supply in History

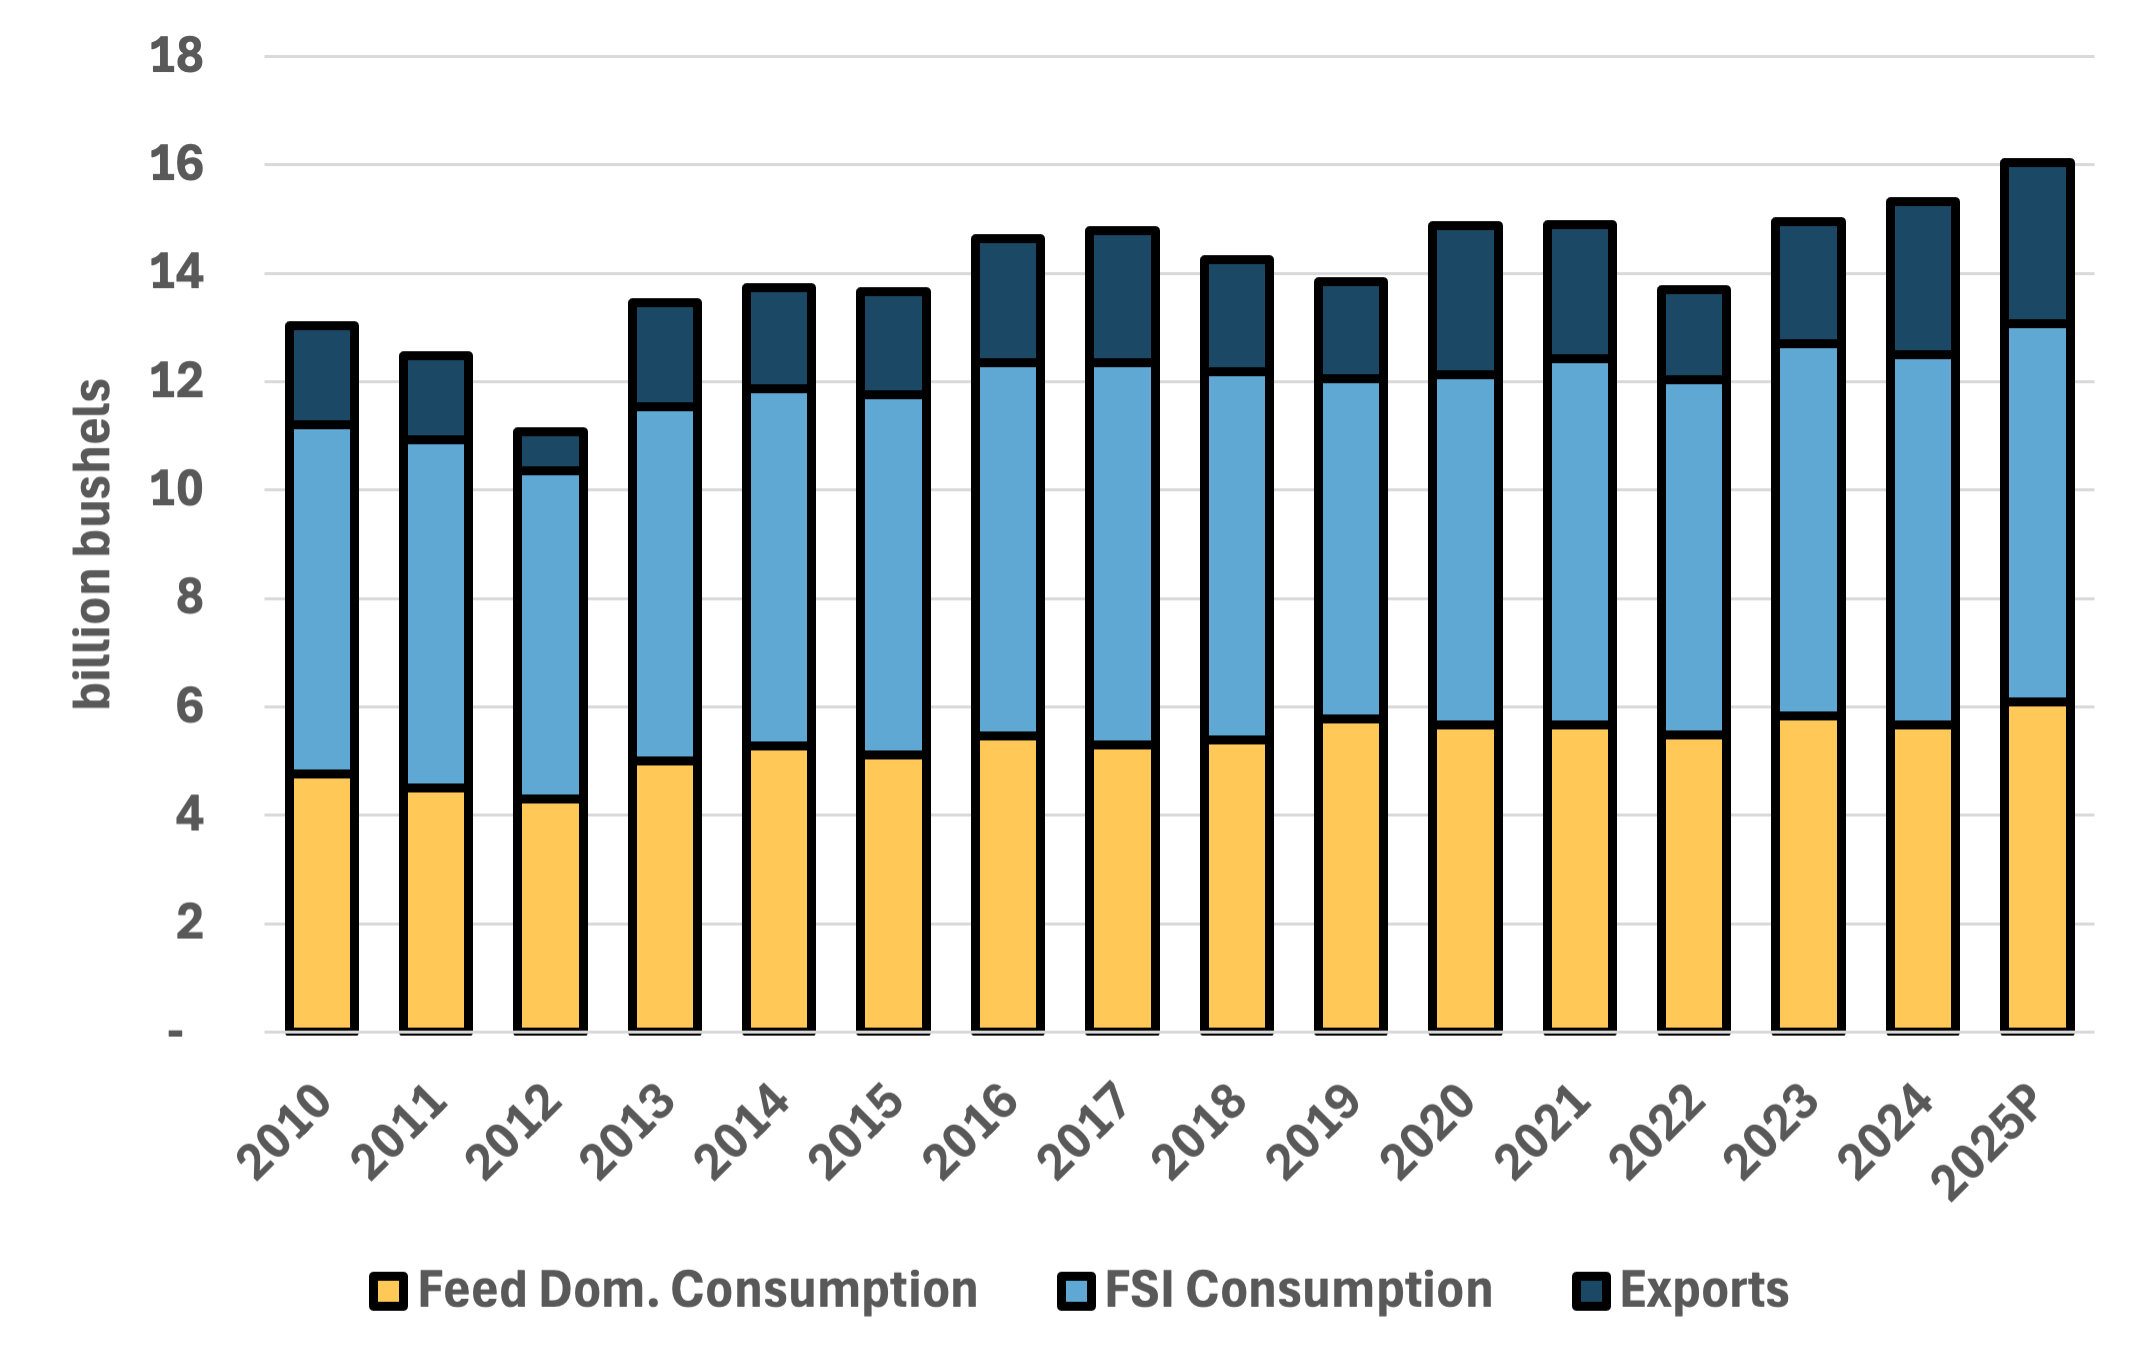
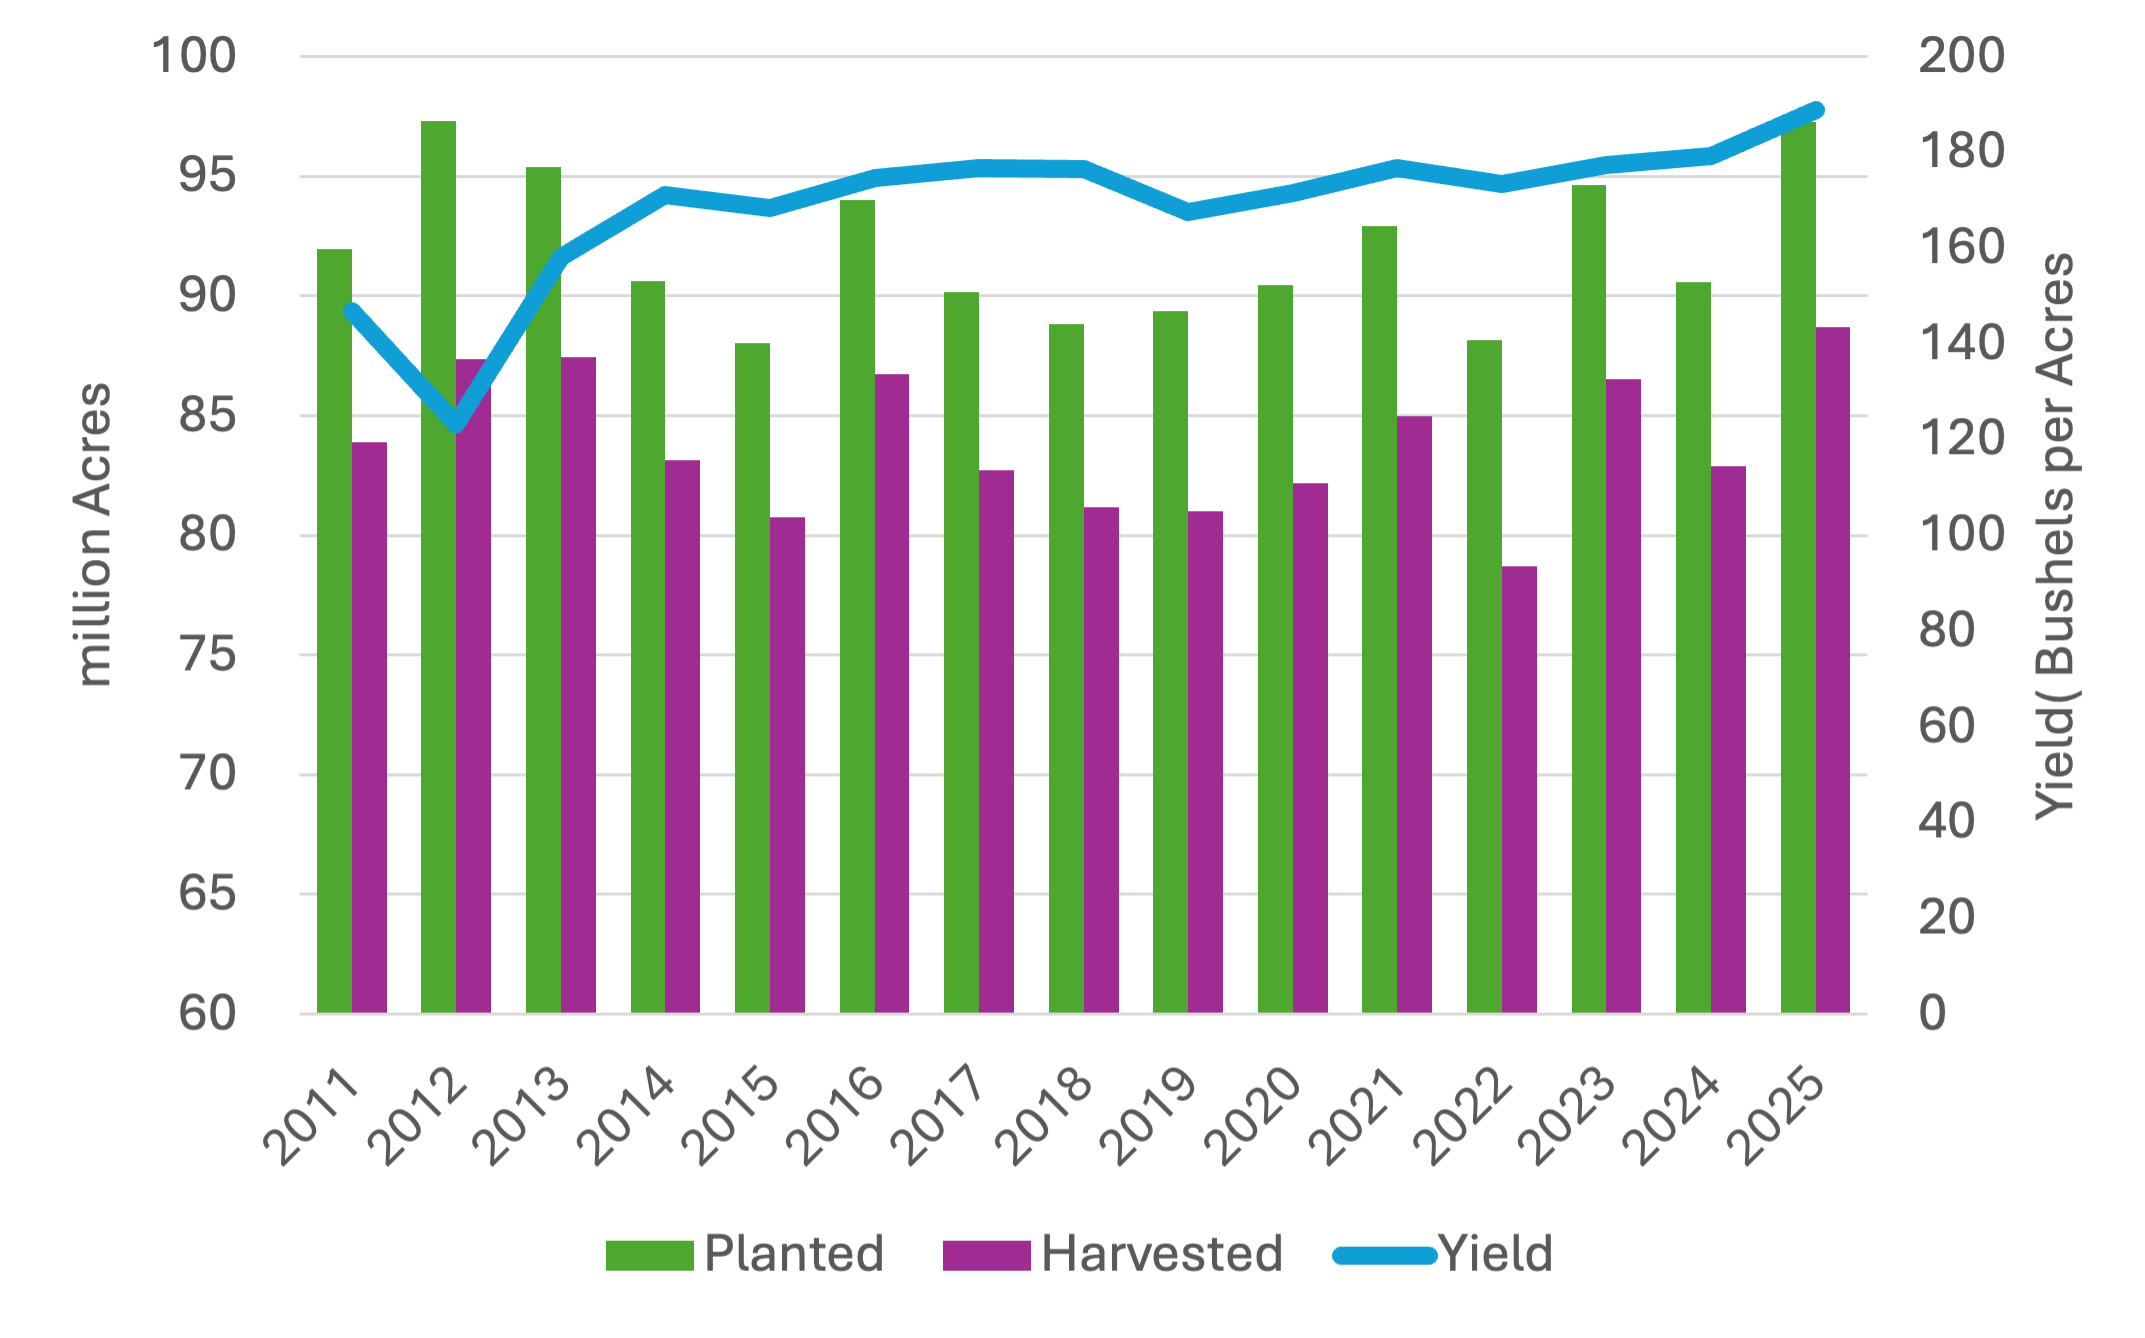
    All summer, much of the corn market conversation has focused on how strong the corn crop looks nationwide and the potential for a record-breaking harvest. The August WASDE, the first report of the year to incorporate yield estimates from the National Agricultural Statistics Service, confirmed that outlook. National corn yield was pegged at a record 188.8 bushels per acre, up 7.8 bushels from July. An additional 1.9 million harvested acres also pushed production to a forecasted 16.7 billion bushels, 1.4 billion more than the previous record set in 2023. While total U.S. corn use was raised to 16.0 billion bushels, the larger supplies still left the market facing the largest ending stocks since 2018 at 2.1 billion bushels. With that surplus, USDA trimmed the season-average price to $3.90 per bushel.                

    While corn is setting new supply records, soybean estimates were far less dramatic. USDA trimmed harvested area from 82.5 million acres to 80.1 million, but a higher yield estimate of 53.6 bushels per acre offset much of that reduction. As a result, 2025 production is forecast at 4.29 billion bushels. Lower supplies and sluggish export sales led USDA to cut export projections by 40 million bushels. Even so, the soybean balance sheet did tighten slightly, with ending stocks lowered by 20 million bushels to 290 million.

    Cotton’s supply outlook shifted sharply this month, with USDA cutting production estimates by 10 percent. Planted acres are now pegged at 9.28 million, down 9 percent from July. Persistent dryness in the Southwest pushed the abandonment rate higher, leaving harvested acres at 7.36 million. With more abandoned low-yield acres removed from the mix, the yield estimate rose to 862 pounds per acre. However, the acreage losses outweighed the yield gains and pulled production down to 13.21 million bales, 1.4 million fewer than last month. Exports were trimmed by 0.5 million bales, and ending stocks are now projected at 3.60 million bales, a reduction of 1 million from July.

    Overall, the latest WASDE report paints a mixed picture across key row crops. Corn is poised for a record harvest with ample supplies putting downward pressure on prices, while soybeans show modest tightening of the supply and demand situation. Cotton faces reduced acreage and production. As harvest progresses, market participants will be closely watching export demand and weather developments during harvest, which will play critical roles in shaping prices and supply dynamics through the rest of the year.

    Figure 1. U.S. Corn Yield, Planted Acres, and Harvested Acres, 2011–2025 (USDA – NASS)       


    Maples, Will. “USDA Projects Largest Corn Supply in History.Southern Ag Today 5(33.3). August 13, 2025. Permalink

  • Managing Crop Markets When Trade Disrupts Prices

    Managing Crop Markets When Trade Disrupts Prices

    International markets support U.S. agriculture, especially in the Southern states. Exports make up a significant portion of cash receipts for many major commodities produced in the Southern states (Figure 1). From 2010 to 2023, an average of 84% of cotton receipts came from exports, underscoring the crop’s reliance on global trade. Wheat and soybeans also depend heavily on international markets, with exports accounting for 64% and 55% of their respective receipts. In contrast, corn is less export-oriented, with just 19% of receipts linked to foreign buyers[1]. This level of exposure makes Southern agriculture especially sensitive to tariff changes and trade policy shifts. During periods of uncertainty, a well-informed marketing and risk management strategy is often the best defense producers have against market volatility.

    A well-developed marketing and risk management plan is essential for producers facing today’s volatile markets. While trade uncertainty is a significant source of price swings, volatility is a constant in agriculture—driven by weather, input costs, and global events. Trade is one of the dominant factors right now. Regardless of the cause, producers should expect uncertainty and be ready to manage price risk each crop year. A strong marketing and risk management plan is the best tool for navigating uncertainty. Crucially, the plan should be written down and shared with everyone involved in the operation to ensure clear communication and timely decisions. Growing a crop and marketing a crop involve two completely different skill sets, so communication between those in charge of production and those in charge of marketing and risk management is essential. 

    The most significant value of a marketing plan is determining sales timing, which should coincide with when production risk is reduced, and what action should be taken at different price points. Trying to time price peaks in markets shaped by unpredictable trade shifts is often ineffective and can be risky. Instead, a solid marketing plan sets decision dates, creating structure around when and how much to sell if markets achieve price targets. Dates should be tied to when production risk is reduced and be informed by realistic price targets, helping producers stay disciplined and focused on financial goals while taking some of the emotion out of pricing decisions. The key is to make sales when prices meet or exceed profit objectives at strategic points in the production/marketing year—even if prices might rise later. Especially in tight-margin years, locking in profits when available can be critical to the operation’s financial success.

    Producers may benefit from a more proactive sales strategy in today’s challenging market environment when profit opportunities arise. For instance, a summer weather rally that pushes prices higher could present a good time to forward contract or price additional bushels before harvest. While aggressiveness in pre-harvest marketing will vary depending on each producer’s risk tolerance, defining that comfort level in advance is essential. The best marketing decisions are those made with forethought—not in the heat of the moment. In years with tight margins, relying on chance is a risk most operations can’t afford.

    Figure 1. Export Contribution to Southern Ag Receipts, Observed and Average Share by Commodity, 2010-2023


    [1] Estimates do not include by products for crops such as ethanol, dried distiller grains (DDGs), soybean oil, and soybean meal.


    Maples, William E., and Grant Gardner. “Managing Crop Markets When Trade Disrupts Prices.Southern Ag Today 5(19.3). May 7, 2025. Permalink

  • Record High Global Soybean Stocks

    Record High Global Soybean Stocks

    As soybean producers prepare for the upcoming growing season, global soybean stocks are exerting a bearish influence on the market. Currently, USDA projects the 2024/25 marketing year to have a record-high level of ending stocks at 131.87 million metric tons. If realized, this would be 17.62 million metric tons greater than the previous record high in 2018. The final estimate for ending stocks will depend on how the South American crop concludes. So far, Brazil has experienced favorable weather conditions, making it likely that it will achieve its estimated record soybean production this year. The outlook for Argentina is less certain.

    The majority of the increase in global soybean stocks can be attributed to one country (Figure 1). China holds the largest share of these stocks, with 46.01 million metric tons, marking an 83% increase since 2021. This growth accounts for 53% of the overall increase in global stocks during the same period. Brazil and Argentina have seen a 22% increase in ending stocks since 2021. In contrast, of the four major countries in soybean markets, the United States maintains the smallest amount of stocks at 12.8 million metric tons, but this still reflects a 71% increase since 2021.

    Another way to analyze ending stocks is by comparing them to a country’s annual usage, which can be illustrated through the concept of days-on-hand. Figure 2 shows the days-on-hand globally and for Argentina, Brazil, China, and the United States. Global days-on-hand are projected at 119 days, the second highest on record. Before 2022, China never had more than 92 days on hand but is currently projected to have a record 132 days of soybeans on hand. Argentina has increased from a decade-low of 152 days on hand in 2022 to a record 199 days on hand in 2024. The United States is projected to have 119 days of soybeans on hand, the second-highest figure since days-on-hand peaked during the 2018 trade war with China.

    Due to the current high levels of stocks projected by the USDA, soybean prices are expected to remain weak in early 2025. With a record crop expected from Brazil, the market is unlikely to see significant upward price movements in the coming months. While changes in weather conditions or harvest delays in South America could potentially drive prices higher, producers may have to wait until the market shifts its focus to the planting of the upcoming U.S. soybean crop before witnessing any substantial increases in prices. Given the uncertainty regarding future price direction, it is essential for producers to start preparing a marketing plan for the upcoming year and be ready to take advantage of profitable prices if they arise.

    Figure 1. Global Soybean Stocks by Country; 2019-2024

    Figure 2. Soybean Days-On-Hand; World and Select Countries; 2000-2024


    Maples, William E. “Record High Global Soybean Stocks.Southern Ag Today 5(2.3). January 8, 2025. Permalink

  • Brazil Expected to Continue Dominance of Global Soybean Exports

    Brazil Expected to Continue Dominance of Global Soybean Exports

    As soybean prices for U.S. producers deteriorate, they face fierce competition from greater Brazilian production in the export market. USDA-WASDE projects the 2024/25 average farm price to be down $3.40 from two years ago, at $10.80 per bushel. U.S. soybeans rely heavily on the export market; on average, 47% of U.S. soybeans were exported in the previous five years. For over a decade, Brazil has maintained its position as the world’s largest soybean exporter, and in recent years, it has further expanded its global market share (Figure 1). USDA-WASDE projections for the 2024/25 marketing year estimate Brazil will account for 58% of global soybean exports, with the United States trailing at 28%. The remaining 14% will come from other exporting nations. While Brazil’s share has dipped slightly from last year’s peak of 59%, it continues to dominate the global soybean export market. 

    The U.S. soybean market is facing challenges with Brazil strengthening its position as China’s primary supplier. China has been working to become less dependent on U.S. soybean purchases, and increased production has allowed Brazil to become the preferred trading partner. According to the Foreign Agricultural Service’s Beijing post, in the first nine months of the 23/24 marketing year, the U.S. accounted for 26 percent of China’s soybean imports, compared to 69 percent from Brazil. Reports also indicate that China is dealing with an oversupply of soybeans, as recent high purchases come during subdued feed demand. This fact has hampered sales to China as we enter the peak marketing season for U.S. soybeans. While U.S. sales to China have risen recently, they are still trailing behind last year’s sales and the five-year average. As of the week ending 9/19/24, the total soybean commitments to China totaled 6.8 million metric tons, compared to 7.4 million for the same time last year and the five-year average of 10.6 million.  

                      The export outlook for U.S. soybeans is further complicated by the prospect of low river levels on the Mississippi River, a concern highlighted in last week’s article “Low River Levels on the Mississippi River: Not the Three-peat We Want” (southernagtoday.org). Recent rainfall from Hurricane Helene has improved the river situation, as the Mississippi River at Memphis is expected to rise above the low river threshold. Without a positive shift in the current export scenario, U.S. producers face lower prices as they harvest a record soybean crop. With Brazil now dominating the export market, the potential for price increases this year depends heavily on the progress of Brazil’s soybean planting season. Although Brazil has just entered its planting window, dry conditions in the central region could lead to delays. If drought conditions develop, it could create an opportunity for higher prices for U.S. producers. Current forecasts call for rain over the next couple of weeks, but rainfall remains below normal.  

    Figure 1. Share of Global Soybean Exports by Country, 2010-2025

    Source:  https://apps.fas.usda.gov/psdonline/app/index.html#/app/advQuery

    References 

    United States Department of Agriculture, Foreign Agricultural Service. Oilseeds and Products Update: Beijing, China – People’s Republic of China. CH2024-0116, 2024, https://apps.fas.usda.gov/newgainapi/api/Report/DownloadReportByFileName?fileName=Oilseeds%20and%20Products%20Update_Beijing_China%20-%20People%27s%20Republic%20of_CH2024-0116.


    Maples, William E. “Brazil Expected to Continue Dominance of Global Soybean Exports.Southern Ag Today 4(40.3). October 2, 2024. Permalink

  • Having a Way Out

    Having a Way Out

    The USDA Quarterly Stocks Report, representative of stocks held on June 1, indicated that both corn and soybean stocks (Figures 1 and 2) are higher than in recent years. High stocks are a bearish factor for the market as they increase the supply side of the balance sheet going into the new marketing year and have been one of many contributing factors to the price decline experienced this summer in corn and soybean markets. A significant insight from the report is how much stock is still stored on-farm versus off-farm.  On-farm corn stocks are at the highest level since 1988 and up 37 percent from last year. On-farm soybean stocks are up 44 percent from a year ago. Given the high level of stocks still being held by producers, it is appropriate to discuss the importance of having an exit strategy that allows producers to exit old crop positions in preparation for new crops. While the exit strategy ideally should be decided before grain goes into storage, some pieces of the discussion below could still be implemented this late in the marketing year. 

    An exit strategy marks the official end of marketing activities for a particular crop year. No matter what type of marketing tool is used, a basic exit strategy utilizes price-driven or time-driven methods. Specific price targets guide a price-driven exit strategy. An example would be selling stored grain at X cents over the harvest price. In this case, the harvest price would be what the grain could have been sold for at harvest. Ideally, a price-driven exit strategy would divide sales up across a range of prices; an example for corn would be selling 10,000 bushels at $4.25 per bushel, 10,000 bushels at $4.40 per bushel, and the last 10,000 bushels at $4.50 per bushel. As each price level is attained, grain is sold. This strategy diversifies price targets to ensure you are not stuck with mostly unpriced grains when transitioning into the lower price environments we are currently experiencing. Another example would be selling stored grain at X cents under the harvest price. At some point, exit strategies need to be used to cut losses. Price targets serve as bookends that guarantee the producer will not be left holding grain indefinitely, speculating on a marketing situation that never occurs.

    Another exit strategy is to set predetermined sale dates. This could be as simple as “I will sell all stored grain by July 31” or “I will sell 10,000 bushels the first of each month, with my final sale occurring July 31.” Setting a predetermined date forces the producer to take a marketing action. An exit strategy can have both price-driven and time-driven components, for example, selling all stored grain at $4.25 per bushel or higher before July 31st. Being late in the marketing year, a producer can still sell their grain and maintain a position in the market by buying a call option. If it is decided to hold on to the physical grain, producers will likely need to plan to store until after harvest, as harvest pressure will decrease the likelihood of a better pricing environment.     

    While the exit strategies discussed above may seem straightforward, they do a good job of curbing emotional hesitancy in marketing decisions. One of the most challenging emotions for producers to control is regret. A producer might feel regret if they sell right before a rally begins or decide not to sell before a market downturn. Dwelling on regret about past sales can make producers hesitant to book future sales.  A well-developed exit strategy can assist producers in coping with emotional bias in marketing decisions. A successful grain sale is based on sound reasoning, with each component of the exit strategy being grounded in price targets derived from production costs and time targets based on local market seasonality. This exit-strategy approach ensures that each marketing decision is reasonable and not regretted in hindsight. An exit strategy gives producers a way out of the old crop and allows them to focus on new crop positions. 

    Figure 1. On-Farm and Off-Farm June 1 Corn Stocks 

    Figure 2. On-Farm and Off-Farm June 1 Soybean Stocks 


    Maples, William E. “Having a Way Out.Southern Ag Today 4(30.1). July 22, 2024. Permalink