All summer, much of the corn market conversation has focused on how strong the corn crop looks nationwide and the potential for a record-breaking harvest. The August WASDE, the first report of the year to incorporate yield estimates from the National Agricultural Statistics Service, confirmed that outlook. National corn yield was pegged at a record 188.8 bushels per acre, up 7.8 bushels from July. An additional 1.9 million harvested acres also pushed production to a forecasted 16.7 billion bushels, 1.4 billion more than the previous record set in 2023. While total U.S. corn use was raised to 16.0 billion bushels, the larger supplies still left the market facing the largest ending stocks since 2018 at 2.1 billion bushels. With that surplus, USDA trimmed the season-average price to $3.90 per bushel.
While corn is setting new supply records, soybean estimates were far less dramatic. USDA trimmed harvested area from 82.5 million acres to 80.1 million, but a higher yield estimate of 53.6 bushels per acre offset much of that reduction. As a result, 2025 production is forecast at 4.29 billion bushels. Lower supplies and sluggish export sales led USDA to cut export projections by 40 million bushels. Even so, the soybean balance sheet did tighten slightly, with ending stocks lowered by 20 million bushels to 290 million.
Cotton’s supply outlook shifted sharply this month, with USDA cutting production estimates by 10 percent. Planted acres are now pegged at 9.28 million, down 9 percent from July. Persistent dryness in the Southwest pushed the abandonment rate higher, leaving harvested acres at 7.36 million. With more abandoned low-yield acres removed from the mix, the yield estimate rose to 862 pounds per acre. However, the acreage losses outweighed the yield gains and pulled production down to 13.21 million bales, 1.4 million fewer than last month. Exports were trimmed by 0.5 million bales, and ending stocks are now projected at 3.60 million bales, a reduction of 1 million from July.
Overall, the latest WASDE report paints a mixed picture across key row crops. Corn is poised for a record harvest with ample supplies putting downward pressure on prices, while soybeans show modest tightening of the supply and demand situation. Cotton faces reduced acreage and production. As harvest progresses, market participants will be closely watching export demand and weather developments during harvest, which will play critical roles in shaping prices and supply dynamics through the rest of the year.
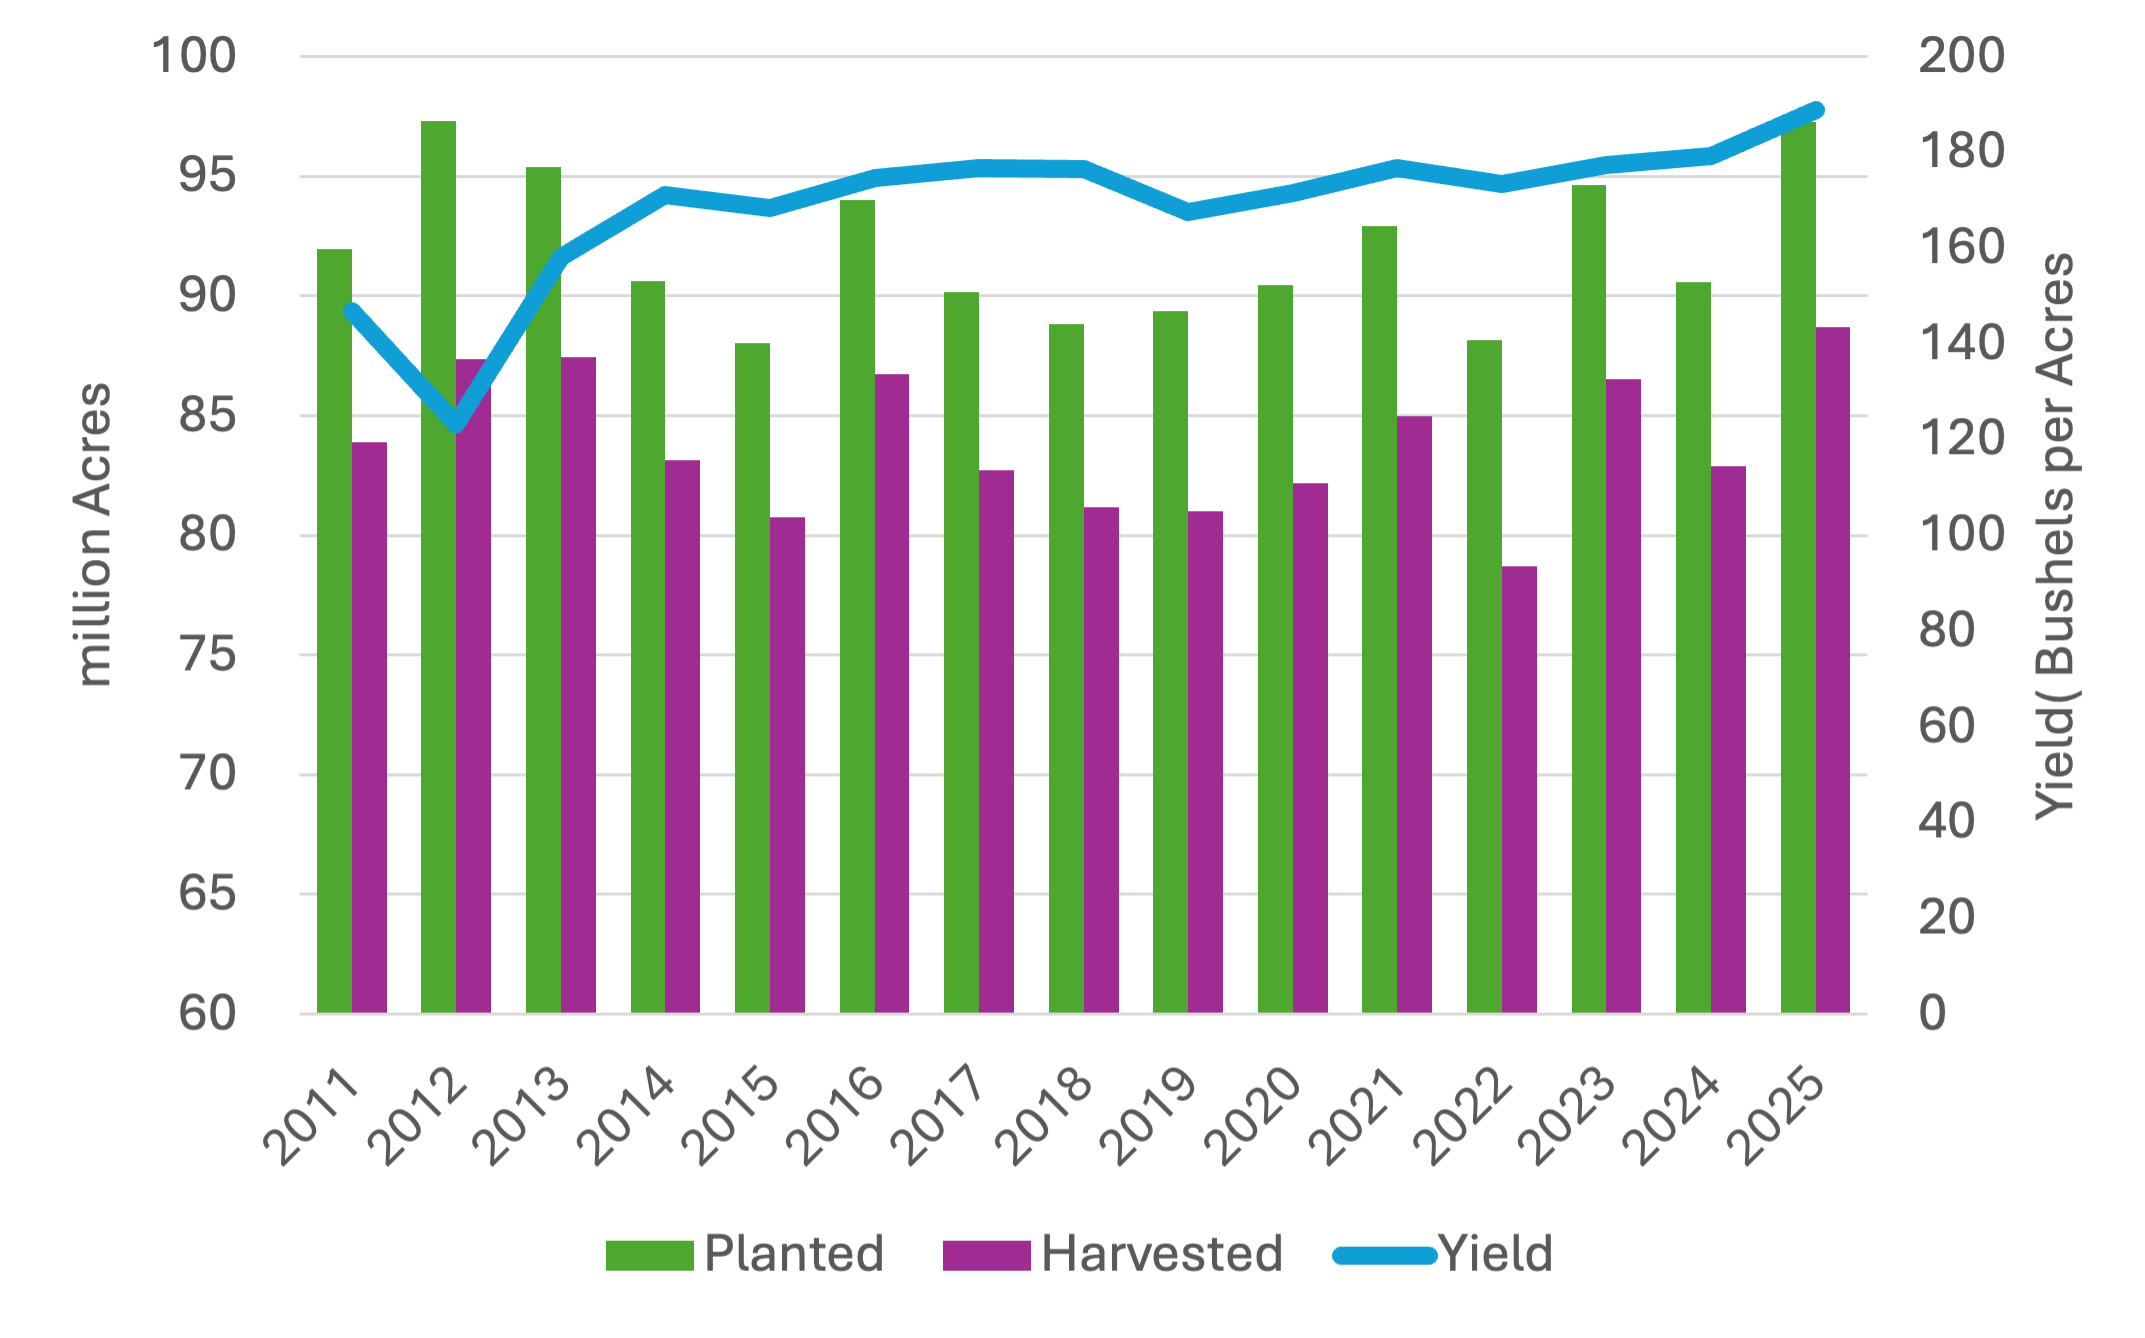
Figure 1. U.S. Corn Yield, Planted Acres, and Harvested Acres, 2011–2025 (USDA – NASS)
Maples, Will. “USDA Projects Largest Corn Supply in History.” Southern Ag Today 5(33.3). August 13, 2025. Permalink