The USDA Quarterly Stocks Report, representative of stocks held on June 1, indicated that both corn and soybean stocks (Figures 1 and 2) are higher than in recent years. High stocks are a bearish factor for the market as they increase the supply side of the balance sheet going into the new marketing year and have been one of many contributing factors to the price decline experienced this summer in corn and soybean markets. A significant insight from the report is how much stock is still stored on-farm versus off-farm. On-farm corn stocks are at the highest level since 1988 and up 37 percent from last year. On-farm soybean stocks are up 44 percent from a year ago. Given the high level of stocks still being held by producers, it is appropriate to discuss the importance of having an exit strategy that allows producers to exit old crop positions in preparation for new crops. While the exit strategy ideally should be decided before grain goes into storage, some pieces of the discussion below could still be implemented this late in the marketing year.
An exit strategy marks the official end of marketing activities for a particular crop year. No matter what type of marketing tool is used, a basic exit strategy utilizes price-driven or time-driven methods. Specific price targets guide a price-driven exit strategy. An example would be selling stored grain at X cents over the harvest price. In this case, the harvest price would be what the grain could have been sold for at harvest. Ideally, a price-driven exit strategy would divide sales up across a range of prices; an example for corn would be selling 10,000 bushels at $4.25 per bushel, 10,000 bushels at $4.40 per bushel, and the last 10,000 bushels at $4.50 per bushel. As each price level is attained, grain is sold. This strategy diversifies price targets to ensure you are not stuck with mostly unpriced grains when transitioning into the lower price environments we are currently experiencing. Another example would be selling stored grain at X cents under the harvest price. At some point, exit strategies need to be used to cut losses. Price targets serve as bookends that guarantee the producer will not be left holding grain indefinitely, speculating on a marketing situation that never occurs.
Another exit strategy is to set predetermined sale dates. This could be as simple as “I will sell all stored grain by July 31” or “I will sell 10,000 bushels the first of each month, with my final sale occurring July 31.” Setting a predetermined date forces the producer to take a marketing action. An exit strategy can have both price-driven and time-driven components, for example, selling all stored grain at $4.25 per bushel or higher before July 31st. Being late in the marketing year, a producer can still sell their grain and maintain a position in the market by buying a call option. If it is decided to hold on to the physical grain, producers will likely need to plan to store until after harvest, as harvest pressure will decrease the likelihood of a better pricing environment.
While the exit strategies discussed above may seem straightforward, they do a good job of curbing emotional hesitancy in marketing decisions. One of the most challenging emotions for producers to control is regret. A producer might feel regret if they sell right before a rally begins or decide not to sell before a market downturn. Dwelling on regret about past sales can make producers hesitant to book future sales. A well-developed exit strategy can assist producers in coping with emotional bias in marketing decisions. A successful grain sale is based on sound reasoning, with each component of the exit strategy being grounded in price targets derived from production costs and time targets based on local market seasonality. This exit-strategy approach ensures that each marketing decision is reasonable and not regretted in hindsight. An exit strategy gives producers a way out of the old crop and allows them to focus on new crop positions.
Figure 1. On-Farm and Off-Farm June 1 Corn Stocks
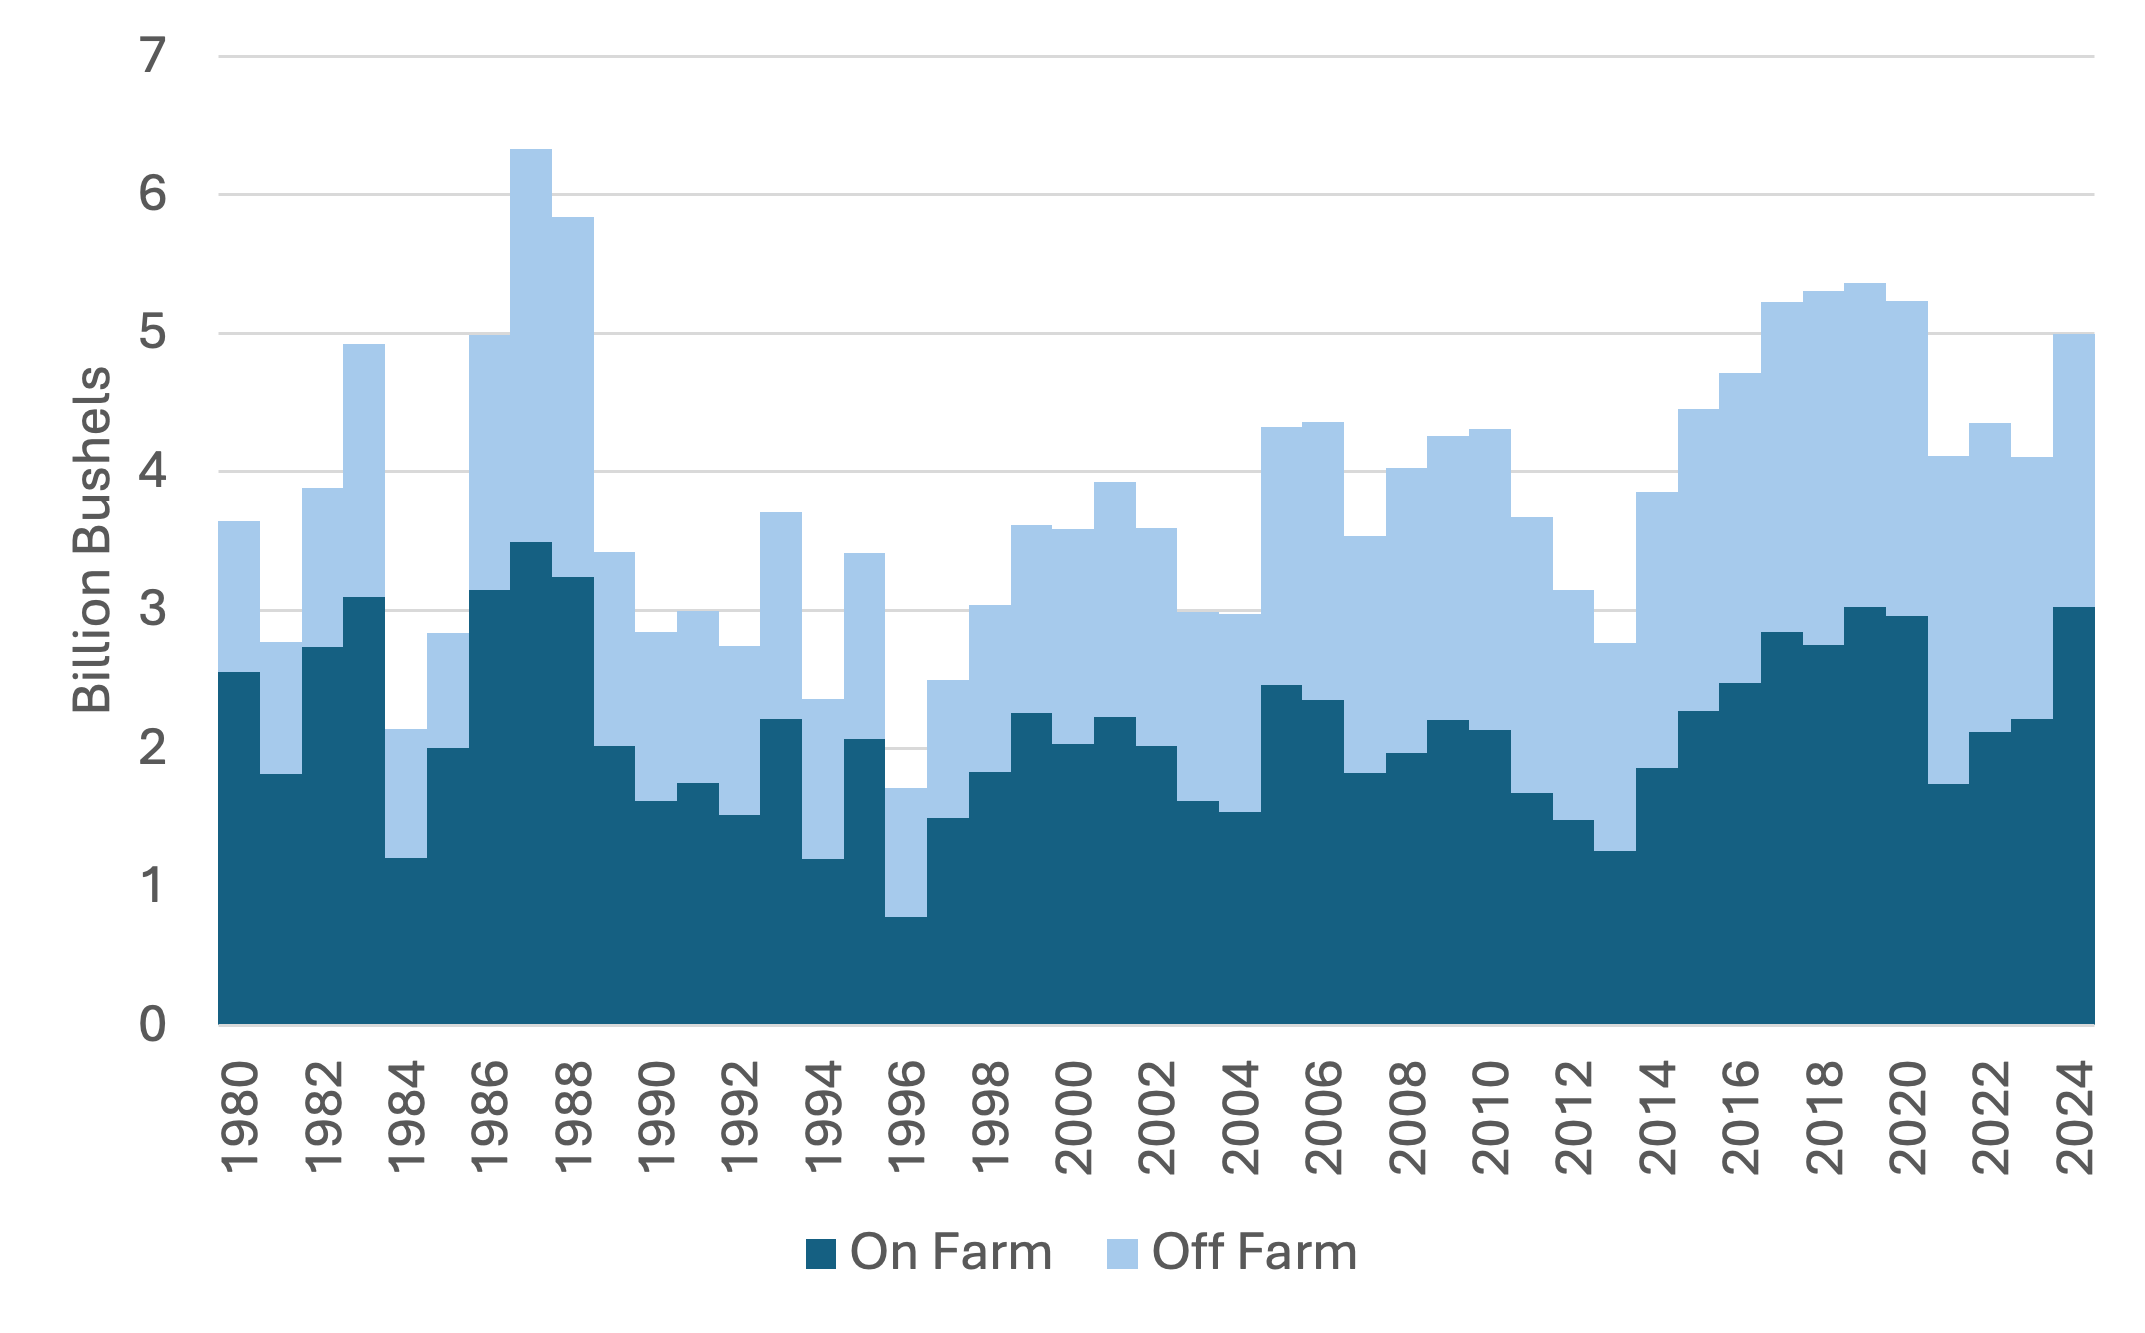
Figure 2. On-Farm and Off-Farm June 1 Soybean Stocks

Maples, William E. “Having a Way Out.” Southern Ag Today 4(30.1). July 22, 2024. Permalink