Author: William Secor

  • Cattle and Drought in the South and Southeast 

    Cattle and Drought in the South and Southeast 

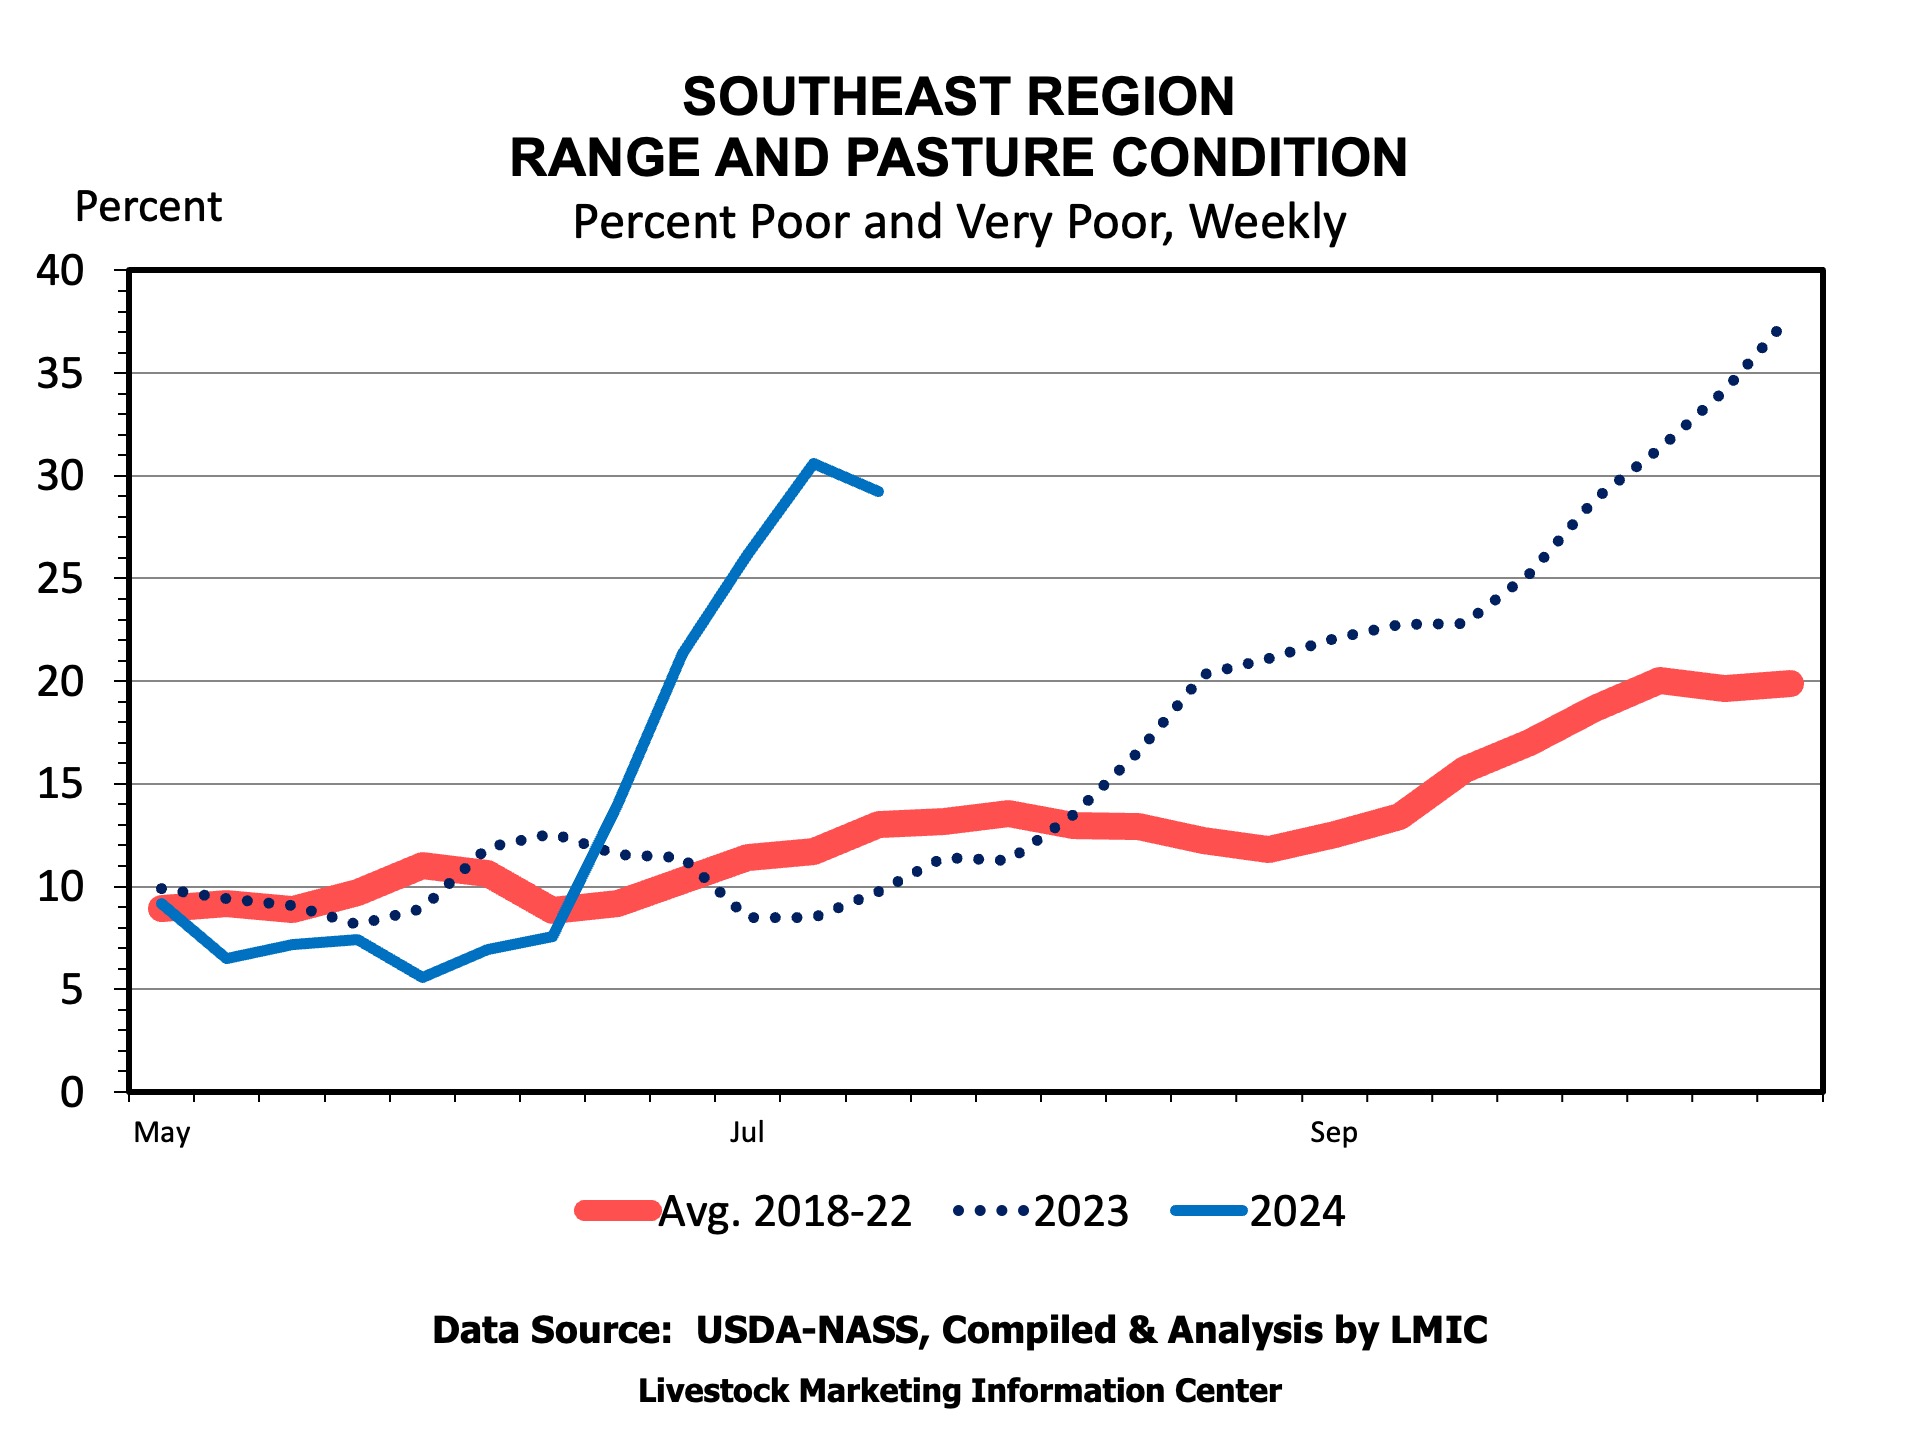
    Drought gripped the Southeast U.S. starting in June and has continued into July. More than 60 percent of the Southeast (AL, FL, GA, NC, SC, and VA) is experiencing drought. These drought conditions have hurt pasture and rangeland conditions in the Southeast. According to the USDA in mid-July, about 30 percent of the pasture in the Southeast (AL, AR, FL, GA, KY, LA, MS, NC, SC, TN, VA, WV) are in poor or very poor condition. Some drought conditions persist in other areas of the South, as well, including approximately half of Texas, 60 percent of Oklahoma, and 70 percent of Tennessee.

    Figure 1: Drought Conditions in the South
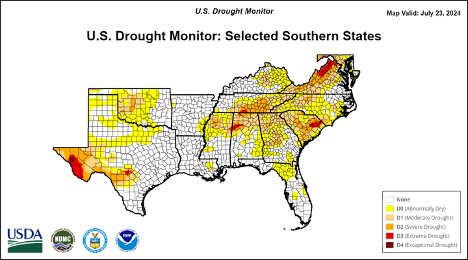
    Source: UNL Drought Monitor

    Should these drought conditions persist, producers will have several decisions to make related to feeding alternatives, forage management, marketing, and other areas. These decisions have implications for a host of different producer outcomes. Economics calls on producers to assess each decision along the following lines: How do revenues and costs change with each decision? This is the essence of a partial budget. A partial budget assesses the change in revenue and the change in costs associated with a change in practice. If changing practices increases net returns, you should change your practice. If not, continue with your baseline practice.Drought creates some uncertainty to the price outlook for this fall. If drought incentivizes producers to bring more calves to market compared to normal, while still remaining high compared to recent history, calf prices may see a more pronounced seasonal dip this fall. 

    Drought creates some uncertainty to the price outlook for this fall. If drought incentivizes producers to bring more calves to market compared to normal, while still remaining high compared to recent history, calf prices may see a more pronounced seasonal dip this fall. Timing may play a role, too. If calves are sold early, the fall low may be more spread out over time and not as deep. Lastly, if the weather improves, any expectations of more cattle this fall may evaporate pushing prices higher than expected. The next several weeks will be important in assessing where cattle markets will be in the months ahead.

    Secor, William. “Cattle and Drought in the South and Southeast.Southern Ag Today 4(31.2). July 30, 2024. Permalink

  • Mixed Impacts of H5N1 in Dairy Cows on Dairy and Beef Cattle Markets

    Mixed Impacts of H5N1 in Dairy Cows on Dairy and Beef Cattle Markets

    Over the past several weeks, H5N1 (i.e., highly pathogenic avian influenza) affecting U.S. dairy herds has been making news. The most recent came last week when the USDA ordered that lactating dairy cows must be tested for H5N1 before being transported across state lines (USDA-APHIS, 2024) and the FDA reported finding remnants of the H5N1 virus in commercial milk supplies (US FDA, 2024). Importantly, officials state that milk and beef products remain safe.

    Amid this market shock, futures price fluctuations for the dairy sector have been relatively small. Class III milk futures saw no significant price swings with March news reports, and prices on April 25 jumped by around 2.5 percent for the May contract potentially in response to lower production expectations. However, prices changed by similar or larger magnitudes five previous days since April 5. It is unclear if that price change was in line with general market uncertainty or due to the announcement.

    In contrast, both feeder cattle and live cattle contracts saw large price drops during March news events. For example, June live cattle contracts dropped by nearly 2.75 percent the day a human case of H5N1 was reported. However, live cattle and feeder cattle prices moved higher on April 25.

    For dairy markets, two things may be happening at the same time to create a relatively steady price situation. Supply may be dropping (due to lower milk production) while potential consumer fears reduce demand. In tandem, this could create relatively constant prices, but production and disappearance would drop. Production and disappearance data to support this should become available in the coming months.

    For cattle markets, the main effect appears to be speculative consumer concerns that would drive down beef demand, thus reducing the value of cattle. This has materialized to a certain extent as Colombia banned imports of U.S. beef into the country. However, the price reaction on April 25 that saw prices move higher suggest that these initial fears may be short-term.

    As more data and news come out, markets’ reactions may change. This area should be closely watched, especially given the tight supplies in the beef cattle market and production uncertainty in milk markets.

    Figure 1: Nearby Contract Prices for Cattle and Milk Futures

    Source: CME Group & LMIC

    Sources: 

    US FDA. (2024, April 23). Updates on Highly Pathogenic Avian Influenza (HPAI)https://www.fda.gov/food/alerts-advisories-safety-information/updates-highly-pathogenic-avian-influenza-hpai

    USDA-APHIS. (2024, April 24). Federal Order Requiring Testing for and Reporting of Highly Pathogenic Avian Influenza (HPAI) in Livestockhttps://www.aphis.usda.gov/sites/default/files/dairy-federal-order.pdf


    Secor, William. “Mixed Impacts of H5N1 in Dairy Cows on Dairy and Beef Cattle Markets.” Southern Ag Today 4(19.2). May 7, 2024. Permalink

  • Understanding Basis When Managing Feeder Cattle Price Risk

    Understanding Basis When Managing Feeder Cattle Price Risk

    Price risk management for beef cattle producers is an important tool in navigating cattle markets. As last week’s Southern Ag Today article on livestock marketing showed, many more producers are using Livestock Risk Protection (LRP) insurance, which correlates to program changes and a run up in cattle prices. LRP and many other price risk management tools, including futures and options contracts, mitigate futures price risk, however, it does not set the actual cash selling price for a producer. The difference between the cash price and the futures price is called basis. Basis varies from year to year, by time of year, location, weight class, and other factors.

    Figure 1. Range of Basis Values for 500-600 lb Steers in Georgia and the Average Range of Feeder Cattle Futures Prices, 2018-2022

    Source: LMIC using data from USDA-AMS and CME Group

    LRP and other price risk management tools that lock in a futures price still leave the producer exposed to basis risk. Producers are often more comfortable with taking on basis risk because basis risk is generally much smaller than futures price risk. Figure 1 presents the average range of monthly basis values and feeder cattle futures prices by month over the last five years for 500-600 lb steer calves in Georgia. As seen in Figure 1, the range of futures prices is much larger than the average range of basis values. Data from other states show similar gaps between basis variability and feeder cattle futures price variability.

    LRP, futures, options, and other price risk management tools provide protection from futures price changes but basis fluctuation may still affect the final cash selling price making it important to understand basis risk and to include it when making risk management decisions.  


    Secor, Will. “Understanding Basis When Managing Feeder Cattle Price Risk.Southern Ag Today 3(45.2). November 7, 2023. Permalink

  • Financial State of Chapter 12 Bankruptcy Filings

    Financial State of Chapter 12 Bankruptcy Filings

    At the start of the Chapter 12 bankruptcy filing process, a filer (the individual or business entity unable to pay back their debts) submits several pieces of information to officially file for bankruptcy. Included in this information is data on their assets and liabilities. The Federal Judicial Center collects and compiles selected data into a database for each case as of September 30th of each year. Figure 1 below uses data from October 1st, 2012 to September 30th, 2022.

    When analyzing these data, there are two important things to keep in mind. First, a filer is not always the whole farm. A farm may have multiple partners, and several legal entities (e.g., a sole proprietor and an LLC) involved. Therefore, the statistics presented here are strictly per filing, not per farm. Second, the data are compiled at the time of the filing with updates if the initial data has been appended. Throughout the bankruptcy process, new assets may be obtained, or new liabilities may be taken on. These data may not fully incorporate these changes.

    Assets and liabilities listed on the debtor’s filing are placed into categories. Assets may be real property or personal property. Real property includes land, buildings, homes, and other such property. Personal property includes assets such as cash, vehicles, equipment, and tools.  Farm related inventory such as crops, animals, chemicals, feed, and machinery are included in personal property.

    Liabilities or debt are categorized as secured, priority unsecured, and nonpriority unsecured. Secured liabilities are those debts with an asset used as collateral, such as a loan with farmland as the collateral. Priority unsecured debt is debt that has no collateral but has special treatment and may not simply be discharged like other unsecured debt. This type of debt includes any legal judgments or unpaid taxes. Lastly, nonpriority unsecured debt is debt that has no collateral securing it and requires no special treatment. This type of debt includes credit card and medical debt that may be eligible for discharge during bankruptcy proceedings.

    Figure 1 shows the trend in average debtor assets and liabilities disclosed at filing over the last ten years. Following broader trends across the agricultural sector, assets and liabilities have increased, especially since 2016. Assets have had a smooth upward trend, likely following higher farmland and equipment values. Note that in all years, average liabilities exceed average assets. This is expected because debtors filing for bankruptcy are often insolvent.

    On average, real property accounted for approximately 60 percent of a debtor’s total asset value. This suggests that land is an important asset that may be shielded during the bankruptcy process. On the liabilities side, secured liabilities, on average, accounted for over 75 percent of a debtor’s total liabilities. Additionally, nonpriority unsecured debt made up about 20 percent of this total, on average. This suggests that the Chapter 12 bankruptcy process is beneficial in two ways. First, secured debt may be restructured (e.g., lower interest rates or longer payment terms) or crammed down (e.g., reduction in total liability to current market value), making the debt more workable for the debtor while the debtor is able to retain ownership of the collateral (e.g., land). Second, a significant portion of total debt in the form of nonpriority unsecured liabilities may be discharged at the successful completion of the bankruptcy process.

    This work is supported by the Agriculture and Food Research Initiative (AFRI) program, grant no. 2022-67023-36112/project accession no. 1028056, from the U.S. Department of Agriculture, National Institute of Food and Agriculture.

    Any opinions, findings, conclusions, or recommendations expressed in this publication are those of the author(s) and should not be construed to represent any official USDA or U.S. Government determination or policy.


    Secor, William, Adam Rabinowitz, and Paul Goeringer. “Financial State of Chapter 12 Bankruptcy Filings.” Southern Ag Today 3(7.3). February 15, 2023. Permalink