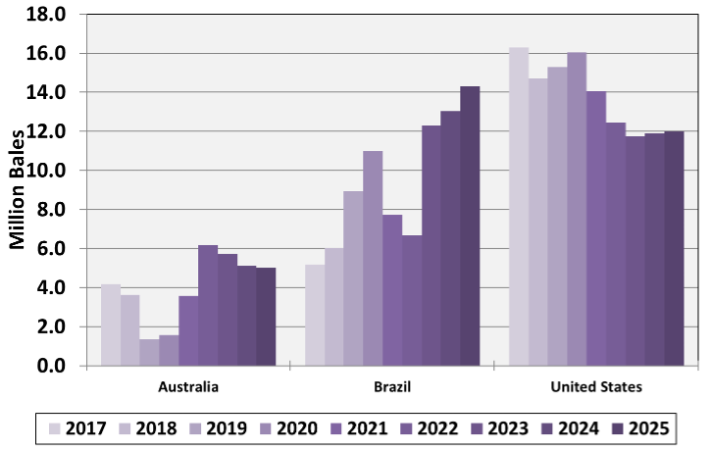
The United States had long been the world’s leading cotton exporter (Figure 1), with 87% of cotton production, on average, destined for export markets over the past decade (2016 – 2025). In 2016, U.S. cotton exports captured 39% of the global market, but this share has steadily declined since the onset of trade disputes with China. By 2023, the U.S. share in the global cotton market had fallen to 26%, its lowest point in over a decade. Although it rebounded slightly to 28% in 2024 and 2025, U.S. cotton has faced rising competitive pressures, particularly from Brazil. Brazil’s ability to double-crop cotton with other crops has driven substantial growth in its cotton production and exports. Consequently, Brazil has rapidly expanded its role in the global cotton market, surpassing U.S. cotton export volumes by 2023 and becoming the world’s leading cotton exporter. This shift is closely tied to China’s strategic diversification away from U.S. cotton, with Chinese investment in Brazilian infrastructure improving logistics, port access, and overall competitiveness.
Cotton prices received by producers across countries vary only slightly, with Brazilian cotton producers typically receiving marginally lower prices than their U.S. counterparts. Although Brazilian cotton producers face higher seasonal costs per acre for fungicides and insecticides due to the tropical climate, these expenses are more than offset by advantages in land, labor, and machinery costs. Consequently, Brazil’s overall production costs per acre for cotton are slightly lower than those of the U.S. producers, reinforcing the former’s competitiveness. Moreover, USDA FAS data indicate that Brazilian cotton yields from 2021 to 2024 averaged 1.8 times that of U.S. yields, resulting in significantly lower costs per pound of cotton produced. Since Brazil’s production costs for cotton remain below market prices, its cotton producers have continued to operate profitably, enabling expanded production. As a result, Brazil’s cotton output has surged, and by 2023, it had surpassed U.S. cotton production, becoming the world’s third-largest cotton producer after China and India. In contrast, U.S. cotton producers have faced production costs exceeding gross revenues, leading to financial losses since 2022 (Liu 2024), coincidental with a severe drought that year in the U.S. Southern Plains.
The global cotton market is undergoing significant shifts, with Brazil emerging as a leading exporter and the United States facing new competitive pressures. Brazil’s ability to expand production efficiently, combined with China’s strategic diversification, has reshaped export patterns and global market shares. For U.S. producers, this evolving landscape underscores the importance of monitoring international market trends, production costs, and trade relationships. While challenges exist, understanding these dynamics can help growers make informed planting, marketing, and risk management decisions, ensuring continued competitiveness in a changing global market.
Figure 1. Top Three Global Cotton Exporters by Country and Year.
Data from the U.S. Department of Agriculture, Foreign Agricultural Service, Production, Supply and Distribution Database.
As a leading importer of cotton, China plays a pivotal role in shaping the international cotton market (Figure 1). China’s cotton imports are highly regulated by government policy, with centralized guidance through a tariff-rate quota (TRQ) system. The TRQ allows a specified amount of cotton (quota, currently at 894,000 tons) to be imported at a lower tariff rate (1%). Imports exceeding the quota are subject to a significantly higher tariff rate (currently at 40%). China adjusts these quotas annually in accordance with World Trade Organization (WTO) rules. Through this mechanism, the government can set cotton import policies in coordination with its reserve programs.
In 2017, just prior to the first round of the U.S.–China trade war, China produced 27 million bales of cotton. This made China the second-largest cotton producer after India, which produced 29 million bales. Despite this high level of domestic production, China still ranked as the world’s third-largest importer in 2017, after Bangladesh and Vietnam. Since 2017, China’s share of global cotton imports has ranged from 12% to 34%, largely due to its cotton reserve programs and the import quota system.
In 2023, the above-noted China policies prompted a high volume of cotton imports, which significantly influenced global cotton markets. This import surge was driven by favorable (low) cotton prices and anticipation of trade uncertainties in the 2024 marketing year following the U.S. election. As a result of the large imports in 2023, China’s need for cotton imports in 2024 declined substantially, while domestic cotton production was boosted to a high level. A similar period of disruption occurred in 2012–2014, when China responded to the 2011 price spike by building up massive reserve stocks. For the next three years, those reserves were drawn down in place of imports, sharply reducing China’s buying from the world market. This shift put heavy pressure on global demand, and U.S. cotton prices eventually slid from the 80–90 cent range per pound back down to more typical long-run levels. In the 2025 crop year, China is projected to produce 31.5 million bales of cotton, the highest among all producing countries. Nevertheless, it also imported 5.3 million bales, ranking just behind Bangladesh (8.1 million), Vietnam (8.0 million), and Pakistan (5.9 million).
China’s role in the global cotton market has important implications for U.S. growers. Even as the world’s largest cotton producer, China continues to import significant volumes of cotton, and these purchases can swing sharply from year to year depending on government policies, reserve levels, and trade dynamics. These swings in demand can create added risk and unexpected price volatility, even during the fall season, when U.S. growers typically anticipate harvest-time pressures. For U.S. growers, keeping an eye on China’s policy changes and trade relations is critical, as these factors directly affect global cotton prices and export opportunities. Ultimately, China’s decisions will remain a key driver of market conditions that shape the fortunes of cotton producers worldwide.
Figure 1. Top Five Global Cotton Importers by Country and Year
Data from the U.S. Department of Agriculture, Foreign Agricultural Service, Production, Supply and Distribution Database.
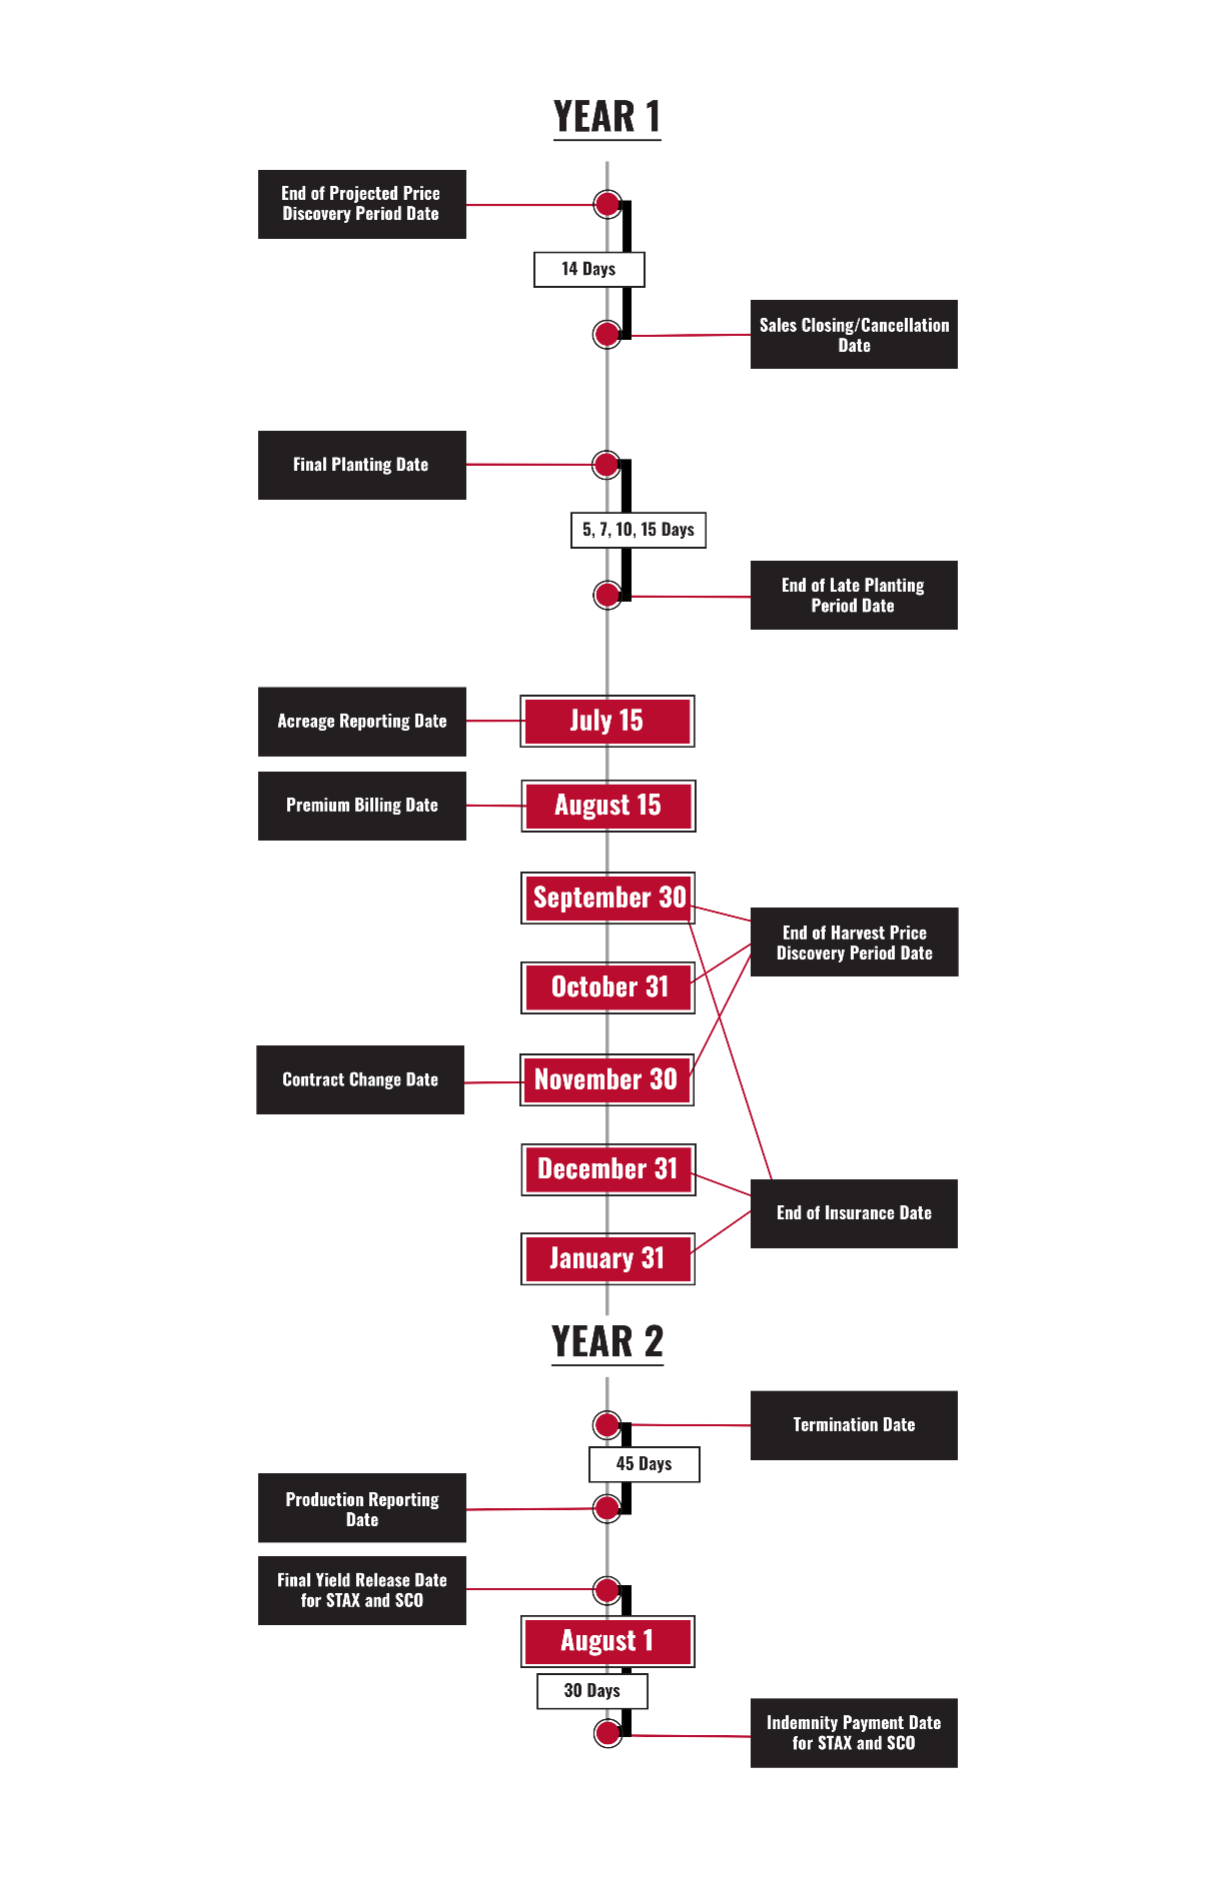
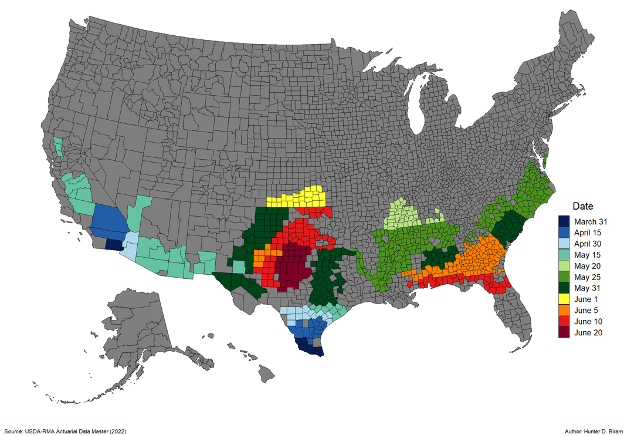
For upland cotton producers, missing critical dates for their federal crop insurance can limit the effectiveness of their risk protection and reduce potential benefits. Our previous article in Southern Ag Today (Chong, Liu, and Biram, 2023) discussed the crop insurance policies available for upland cotton. This article focuses on the essential dates that upland cotton producers must track to effectively manage their coverage and protect their investments.
The U.S. Department of Agriculture Risk Management Agency (USDA RMA) provides key crop insurance dates and definitions for upland cotton. Figure 1 below outlines the timeline related to upland cotton crop insurance. If a listed crop insurance deadline falls on a weekend or holiday, the actual due date shifts to the next business day.
Key crop insurance dates for upland cotton include the Projected Price and Harvest Price Discovery Periods, Sales Closing and Cancellation Dates, Final Planting Date, and the End of the Late Planting Period (See references below for definition and dates from previous SAT articles).
The remaining key crop insurance dates and their definition are discussed below.
Acreage Reporting Date. Producers must annually report the number of acres planted, insurable and uninsurable, to the insurance provider on or before this date or within three days if they abandon their intentions to plant. If crops are planted after the final planting date, producers must report the number of acres planted each day. Additionally, all acres of an insurable crop must be reported. Other required information includes: producer’s share in the crop, acreage location, farming practices used, types or varieties planted, planting dates (if after the final planting date), and any acres unable to be planted. Failure to file the acreage report by the applicable crop acreage reporting date may result in the denial of coverage by the insurance provider. The acreage reporting date for upland cotton is July 15.
Premium Billing date. Although premiums are payable as soon as the crop is planted, producers will not receive a bill until this date. Interest charges begin to accrue on unpaid balances 30 days after the premium billing date at a rate of 1.25% per month. If an indemnity is issued, any outstanding premiums will be deducted from the payment. For upland cotton, the premium billing date is August 15.
Contract Change Date: The RMA may adjust the insurance program from year to year. If any modifications occur, the changes will be available on the RMA website no later than the contract change date. The insurance provider is required to inform the policyholder in writing about updates to the policy, actuarial documents, or Special Provisions of Insurance not later than 30 days prior to the cancellation date. The policyholder has the option to review these updates and choose to maintain coverage for the next crop year, modify the policy by the sales closing date, or cancel the insurance by the cancellation date. For upland cotton, the annual contract change date is November 30.
End of Insurance Date. Following the End of Insurance Date, the farmer no longer has any production or revenue guarantee on the crop. This date is the earliest of the following: the date the crop is harvested, abandoned, or destroyed; the date the final adjustment on losses is made; or a specified calendar date for each crop determined by the RMA. For upland cotton, the end of insurance dates vary by region are (1) September 30 in Val Verde, Edwards, Kerr, Kendall, Bexar, Wilson, Karnes, Goliad, Victoria, and Jackson Counties, Texas, and all Texas counties lying south thereof; (2) January 31 in Arizona, California, New Mexico, Oklahoma, and all other Texas counties; and (3) December 31 in all other states.
Termination Date. If premiums remain unpaid by this date, insurance coverage for the following crop year will be terminated. If a crop insurance policy is going to be terminated, the insurance provider will provide written notice to the producer at least 30 days before the termination date. The termination date varies by region but falls on the same date as the sales closing date and the cancellation date of the next year.
Production Reporting Date. Producers must submit their most recent crop production records by this date to recalculate their Actual Production History (APH) yield. This deadline is typically 45 days after the termination date or sales closing and cancellation dates for the following year.
Final Yield Release Date: For area policies, like STAX and SCO, RMA typically determines final county yields and revenues by mid-July following the crop year. Specifically, for upland cotton, these figures are finalized before August 1.
Indemnity Payment Date: For area policies, like STAX and SCO, any indemnity payments due to policyholders are issued no later than 30 days after the release of the final area yield or revenues. All other indemnities for the underlying cotton policy are paid at least 30 days after the claim has been finalized.By staying informed about key crop insurance deadlines, upland cotton producers can ensure they maximize their risk protection. Tracking these important dates and seeking guidance from crop insurance agents can help safeguard investments and maintain effective coverage.
Figure 1. Key Dates Producers Need to Know for Cotton Crop Insurance Plan
Timely planting is crucial for crop insurance coverage, ensuring producers remain eligible for their selected yield or revenue guarantee. Producers should monitor three key crop insurance planting dates: Earliest Planting Date, Final Planting Date, and End of Late Planting Period Date. These dates determine coverage eligibility and can impact insurance claims. While crop insurance planting dates typically remain consistent from year to year, they may occasionally be reviewed and adjusted by the U.S. Department of Agriculture – Risk Management Agency when necessary. Any changes to these crop insurance planting dates involve a thorough process, including stakeholder input and consultation with Extension specialists and experts.
Earliest Planting Date is the earliest date producers may plant an insured agricultural commodity (e.g., rice, corn, soybeans, and peanuts) and qualify for a replanting payment if the crop is damaged by an insurable cause of loss and such payment is available for the crop. However, cotton does not have a designated Earliest Planting Date. Since cotton planting depends on soil moisture and temperature, which vary annually, a fixed Earliest Planting Date is impractical. Additionally, because the cotton crop insurance program does not include replant payment coverage, an Earliest Planting Date is unnecessary for determining replant eligibility.
Final Planting Date is the deadline by which acres must be planted to receive the full production guarantee selected by the producer. Acres planted after this date will have a reduced guarantee for crop insurance products with a Late Planting Period. Any unplanted acres as of this date must be reported to the insurance agent within three days.
Late Planting Period for cotton crop insurance begins the day after the Final Planting Date and lasts for 5, 7, 10, or 15 days, depending on the location. Late Planting Period ends on the End of Late Planting Period Date. This period applies only to cotton crop insurance products that include a Late Planting Period. The specific length of the late planting period varies by location:
15 days: Counties in Arizona, Arkansas, California, Kansas, Louisiana, Missouri, and Tennessee.
10 days: Counties in Alabama, Georgia, and South Carolina.
7 days: Counties in New Mexico, Oklahoma, and Texas.
5 days: Counties in North Carolina and Virginia.
For Florida, only Nassau County has a 10-day late planting period, while all other counties have 15 days.
For Mississippi, 10 counties in the southern part of the state have a 10-day late planting period, while the rest of the counties have 15 days.
For acreage planted during the Late Planting Period, the crop insurance guarantee decreases by 1% for each day after the Final Planting Date until the End of Late Planting Period Date, while the producer’s insurance premium remains unchanged. Acres planted after the End of Late Planting Period Date are generally uninsurable, except in cases where prevented planting coverage applies.
Our previous article in Southern Ag Today provided a detailed overview of all crop insurance products available to cotton producers. Cotton insured under Yield Protection (YP) or Revenue Protection (RP) plans, with related Supplemental Coverage Option (SCO), Enhanced Coverage Option (ECO), and Hurricane Insurance Protection – Wind Index (HIP-WI) options and endorsements, all follow the same Final Planting Dates, Late Planting Periods, and End of Late Planting Period Dates. The Final Planting Dates for these plans are illustrated in Figure 1.
Cotton insured under Area Risk Protection Insurance (ARPI) and Stacked Income Protection (STAX) does not have a Late Planting Period, thus no End of Late Planting Period Date. Additionally, even though ARPI and STAX policies have the Final Planting Dates, they differ from those of other crop insurance plans. This distinction exists because STAX and ARPI are area-based plans, where coverage and indemnities are determined by county-wide expected and final yields/revenue rather than individual producer’s farm yields or revenue. Since a producer’s specific planting date has a minimal impact on county-wide yield/revenue risk, late planting does not lead to a reduction in coverage under these plans. As a result, the Final Plant Dates for STAX and ARPI align with the End of Late Planting Period Date used for other crop insurance plans.
If planting by these deadlines is not possible, farmers should keep detailed records documenting the cause. If farmers anticipate being unable to complete planting by the Final Planting Date or during the Late Planting Period, they should contact their crop insurance agent as soon as possible to discuss their options.
Figure 1. Regional Variations in Final Planting Dates for Cotton Crop Insurance: YP, RP, SCO, ECO, and HIP-WI Policies
Reference:
Chong, Fayu, Yangxuan Liu, and Hunter Biram. “Exploring Diverse Crop Insurance Options for Cotton Producers.” Southern Ag Today 3(51.3). December 20, 2023.
Besides cotton, another primary row crop suitable to southern soils and the climate is peanuts. As a legume, peanuts are often used as a rotational crop with cotton and/or corn. Peanuts are grown primarily in the southeastern U.S. from Virginia down to Florida and over to Alabama, with some acreage as far west as New Mexico, Texas, and Oklahoma. In 2024, the U.S. is projected to produce 3.2 million farmer stock tons of peanuts (USDA ERS). Market year average prices are expected to be around $530 per ton (USDA FSA), and if realized, the projected total value of peanut production is expected to be $1.7 billion. Not only are peanuts an important rotational crop, but they also contribute significantly to the rural farm economies of the Southern region.
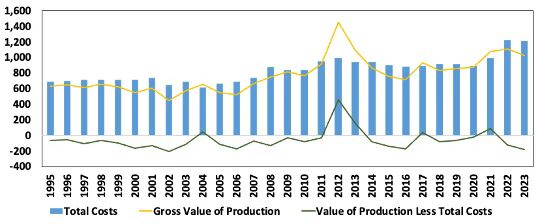
Peanuts are capital intensive particularly because of the specific harvest equipment that must be used to dig up the vines. Then after the vines dry, another machine picks the peanuts from the vines. Analysis of data from the USDA Economic Research Service illustrates the financial challenge of the rising costs of peanut farming. Figure 1 highlights the ongoing profitability challenges southern peanut farmers have faced over the last 29 years. These data account for actual production costs incurred during the production process by farm operators, landlords, and contractors and include expenses for labor, equipment, and other inputs. Revenues generated from peanut sales are also analyzed. The revenues do not include government payments and crop insurance indemnities received by producers. Potential government payments during this time period may include traditional farm bill programs for farmers with base acres, as well as ad-hoc disaster relief programs.
According to Figure 1, the average peanut farmer managed to earn a profit in only five of the last twenty-nine years. On average, peanut growers faced annual losses of $57 per acre. Referring back to the companion article linked above, cotton farmers also faced average annual losses of $94 per acre during this same time period. These long-run average losses per acre show the continued financial challenges incurred by southern farmers despite growing crops that are suitable for the regional climate and soils. As with cotton, long-term economic losses to peanut production put the sustainability of Southern agriculture at risk. A continuation of these trends could result in a prolonged decline in agricultural production, eroding the economic foundation of rural farming communities across the Southern region. It is evident that there continues to be a need for effective agricultural policies and support programs.
Figure 1. Peanut Production Total Costs, Revenue, and Returns for Producers in the United States (1995 – 2023).
Data Source: U.S. Department of Agriculture (USDA) Economic Research Service (ERS), Commodity Costs and Returns for Peanuts, May 1, 2024.