Author: Yuri Clemets Daglia Calil

  • EU-Mercosur Trade Agreement

    EU-Mercosur Trade Agreement

    The European Union (EU) and Mercosur (Brazil, Argentina, Uruguay, and Paraguay) signed a trade agreement on December 6, 2024, after more than 25 years of negotiations. The agreement, yet to be ratified, has the potential to become the most significant EU partnership, encompassing over 700 million people. It emerges amid the U.S. discussion of raising tariffs. 

    Highlights for Agriculture

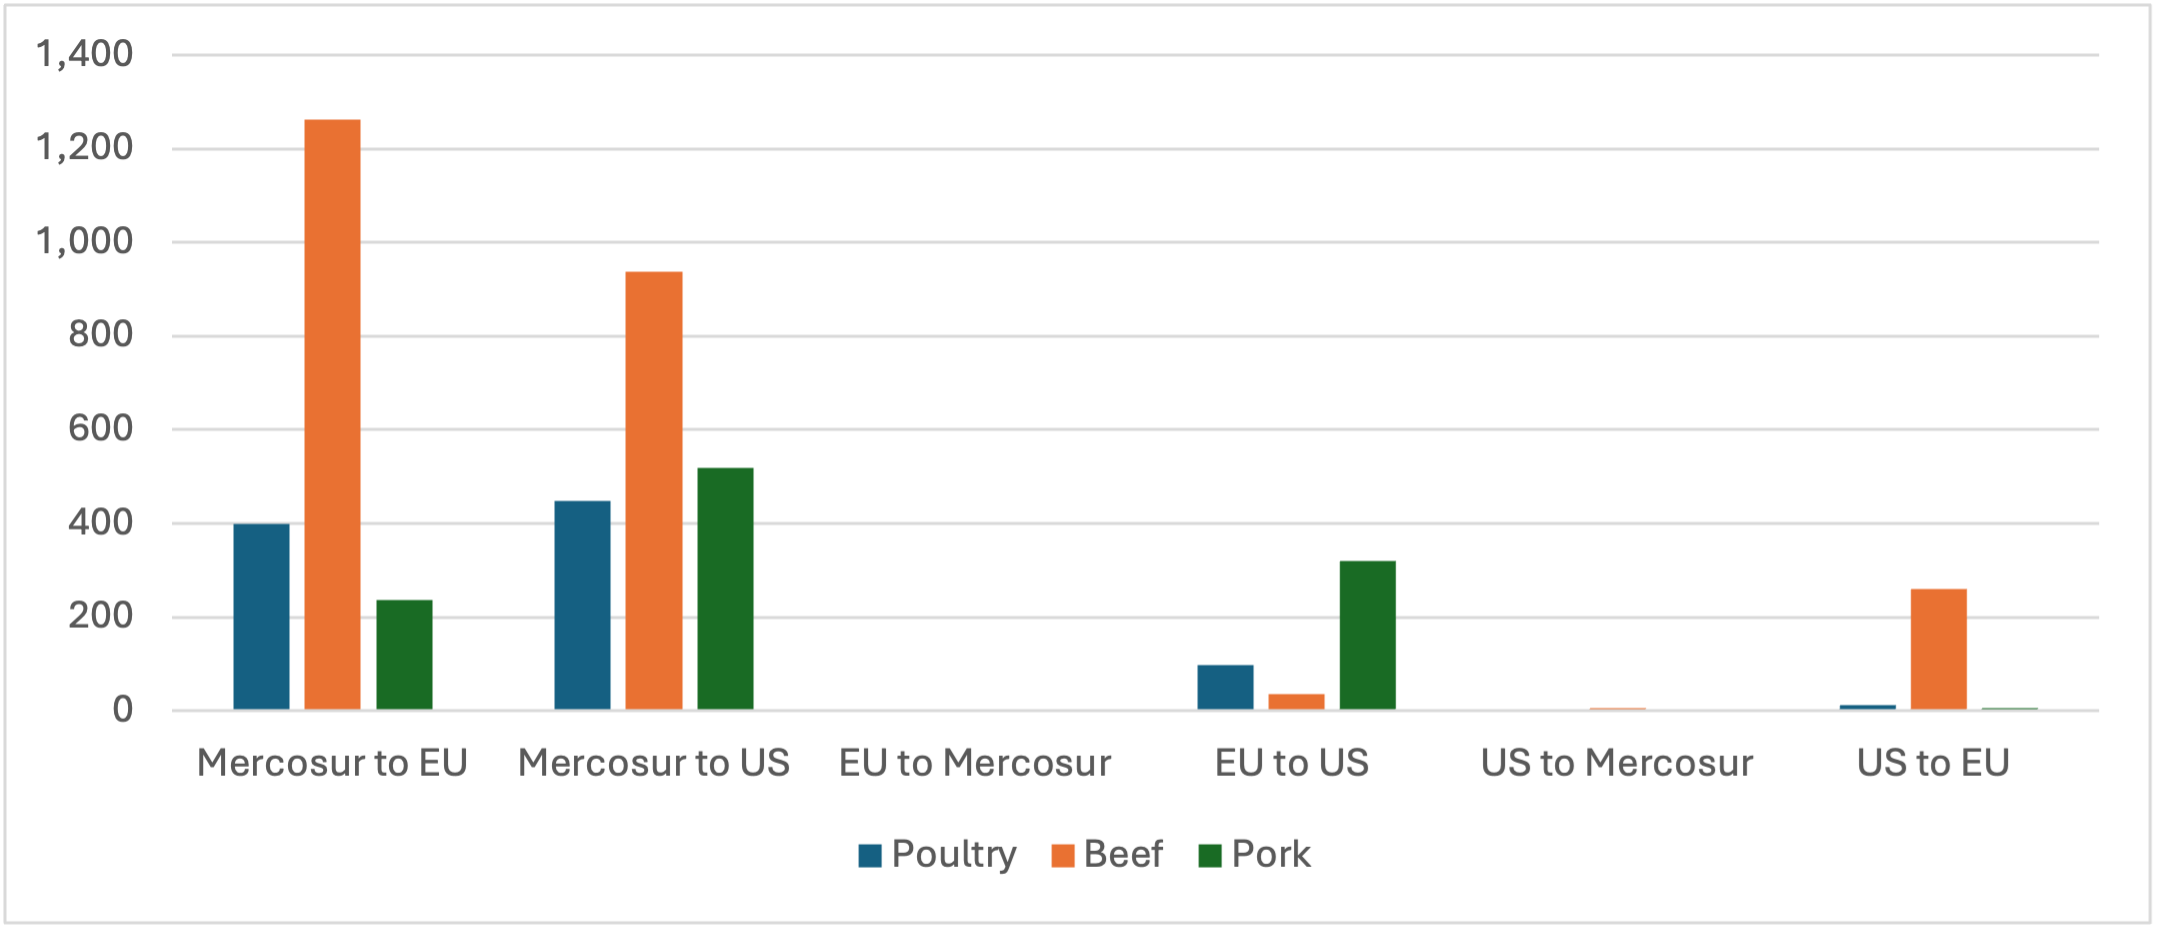
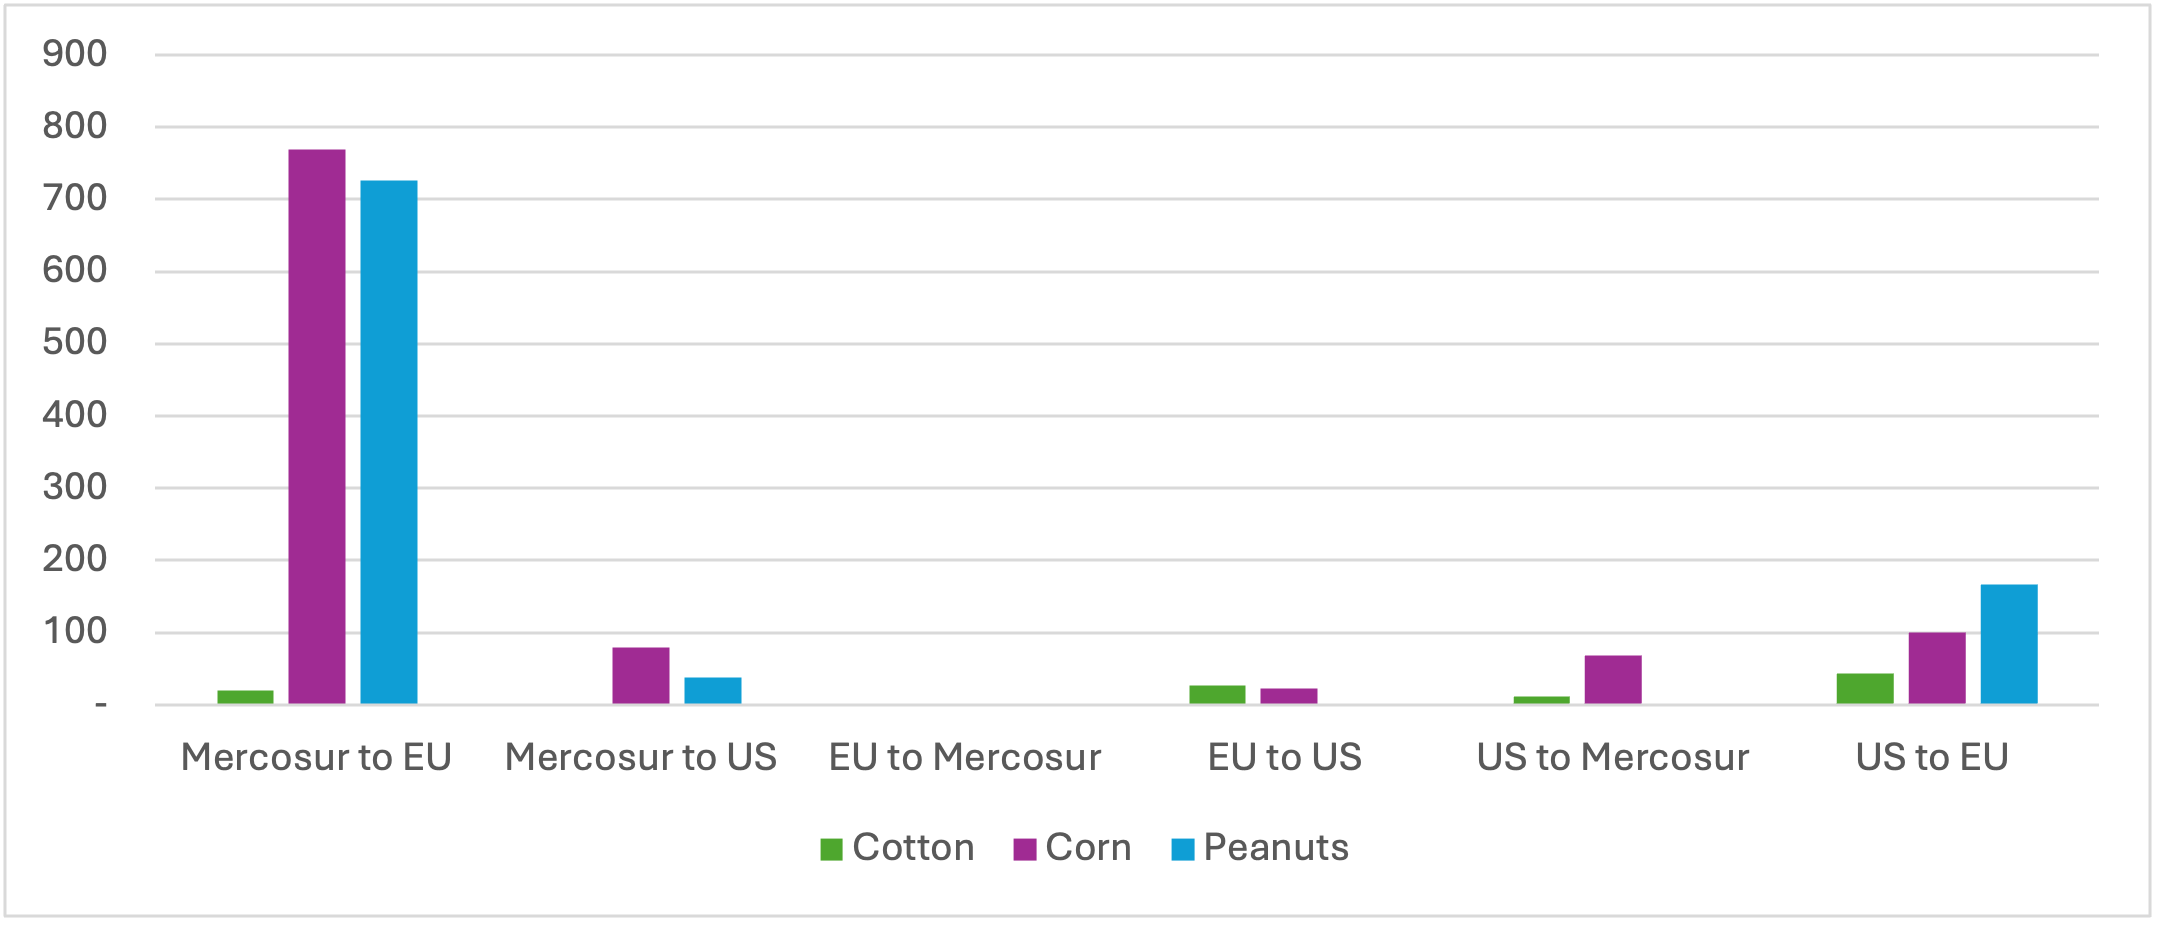
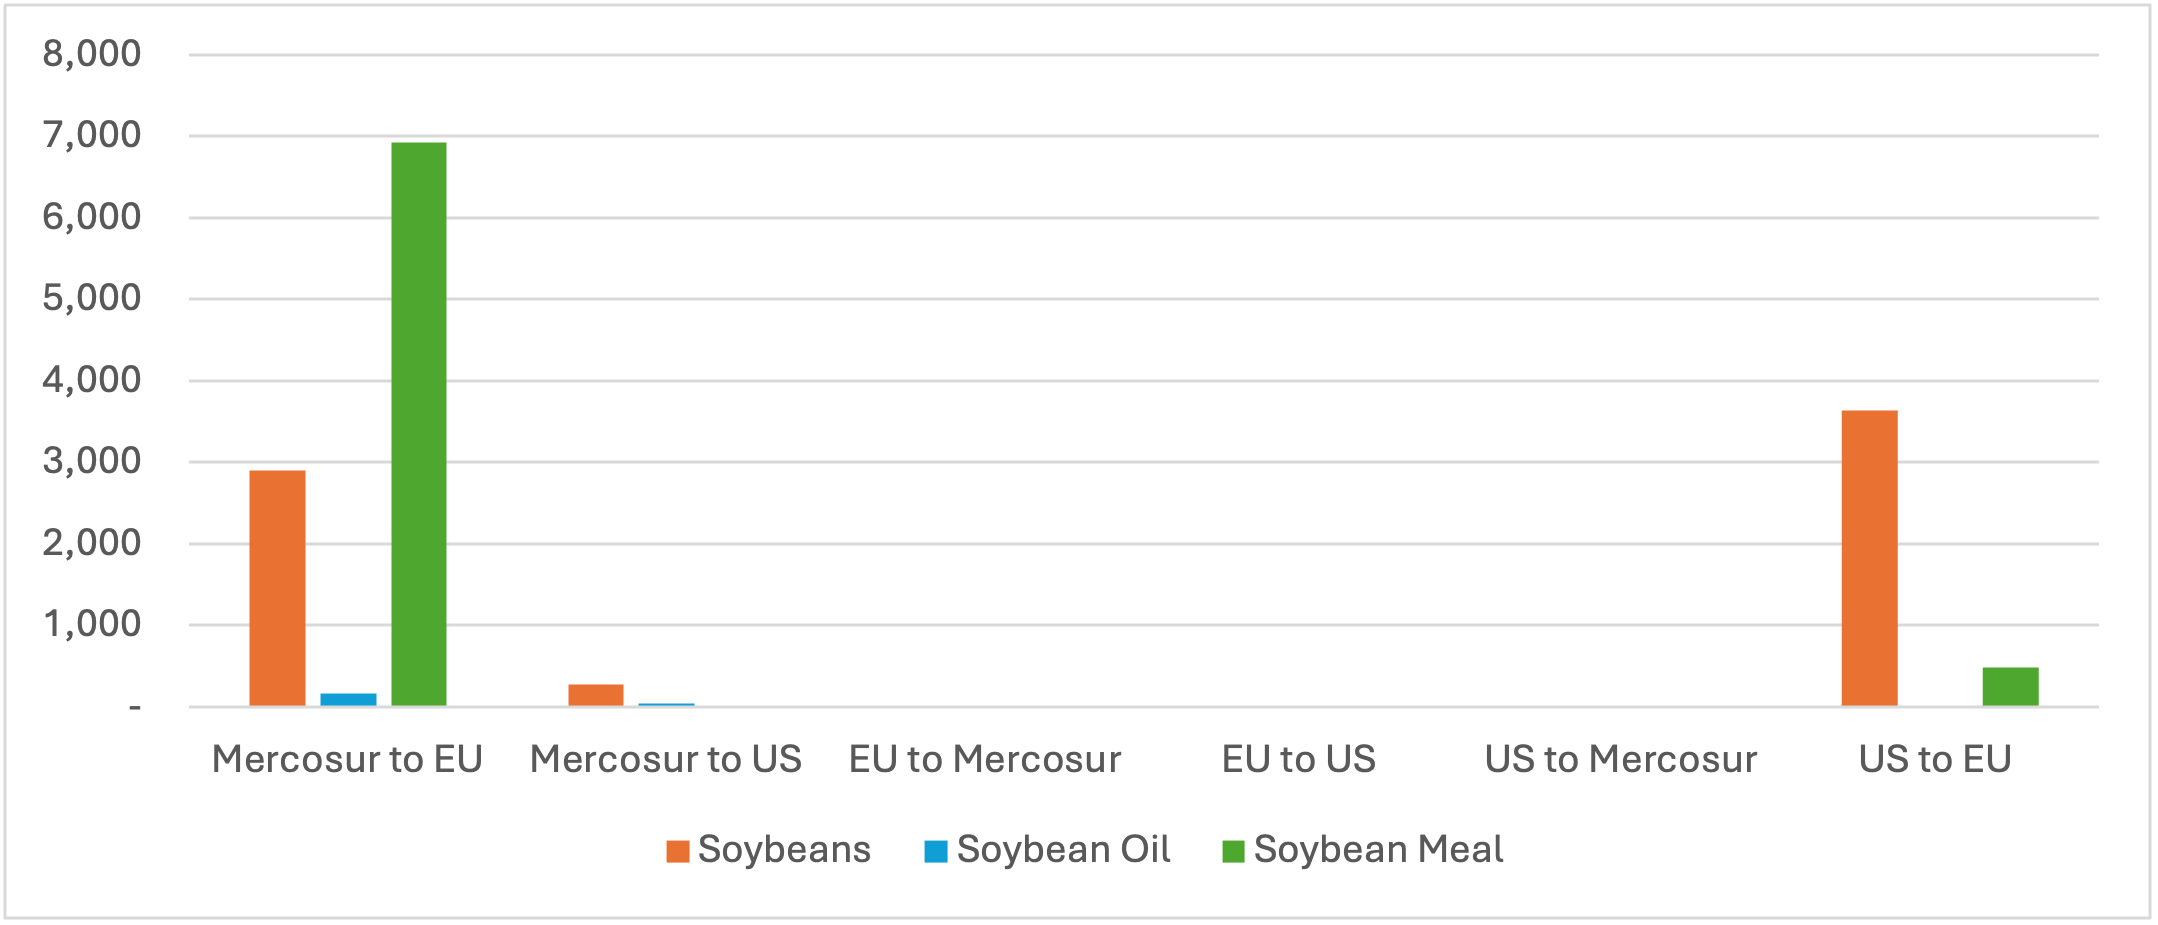
    The flow of agricultural products is more significant from Mercosur to the EU, as illustrated in Figures 1, 2, and 3. The EU-Mercosur Trade Agreement introduces significant changes to agricultural trade by establishing quotas and reducing tariffs over a phased period[1], providing greater access to Mercosur countries.  For beef, an additional quota of 99,000 metric tons (CWE) will be introduced over five years with a 7.5% tariff, while the existing Hilton Quota (10,000 metric tons) will become tariff-free upon the agreement’s implementation. Poultry exports will benefit from a 180,000 metric ton (CWE) quota, phased over five years, with zero tariffs, while pork will have a 25,000 metric ton quota with a fixed tariff of €83 per metric ton, implemented over five years.

    The agreement also includes quotas for sugar (180,000 metric tons with zero tariffs, including 10,000 metric tons reserved for Paraguay), ethanol (450,000 metric tons duty-free for industrial use), and corn (1 million metric tons at zero tariffs, increasing over five years). A 60,000 metric ton quota for rice will start at zero tariffs and gradually increase over five years. Additionally, orange juice tariffs will be eliminated over seven to ten years, with a 50% preferential margin during the transition. These provisions aim to expand market access for Mercosur’s agricultural exports while aligning with EU tariff structures.

    Sustainability: Both blocs committed to following the Paris Agreement, combating deforestation, and reducing greenhouse gas emissions. The EU committed to using data from Mercosur authorities to assess Mercosur’s compliance with the requirements established by European bloc legislation. 

    Challenges Ahead

    The signing of the EU-Mercosur trade agreement represents a significant milestone. However, the agreement may face political challenges in the future. The EU member states and the European Parliament must review and approve the final text. France and Poland are likely to express opposition to the agreement. Additionally, the Mercosur nations will need to ratify the agreement in their respective congresses.

    Implications for the United States

    The EU-Mercosur trade agreement introduces competitive challenges for U.S. agricultural exporters by granting Mercosur countries preferential access to European markets and strengthening the EU’s position in Mercosur. Commodities such as beef (Fig. 1), corn/peanuts (Fig. 2), and soybeans (Fig 3) will face increased competition, with Mercosur benefiting from reduced tariffs and expanded quotas in the EU. At the same time, the agreement allows European goods to gain a stronger foothold in Mercosur countries, reducing U.S. export opportunities in high-value sectors like processed goods and dairy. The deal further challenges the U.S.’s ability to compete globally by setting a precedent for trade norms.

    Figure 1 – 2023 Livestock Export Values by Product and Region (FOB, $ Millions)

    Source: UN Comtrade Database
    Notes: Poultry, HS Code: 0207 (Meat and edible offal of poultry), 1602 (Prepared or preserved poultry); Beef, HS Code: 0201 (Fresh or chilled beef), 0202 (Frozen beef); Pork, HS Code: 0203 (Fresh or frozen pork), 1602 (Prepared or preserved pork).

    Figure 2 – 2023 Crop Export Values by Product and Region (FOB, $ Millions)

    Source: UN Comtrade Database
    Notes: Cotton, HS Code: 5201 (Raw cotton), 5205 (Cotton yarn), 5209 (Woven cotton fabrics); Corn, HS Code: 1005 (Corn/maize), 1102 (Corn flour); HS Code: 1202 (Raw peanuts), 1508 (Peanut oil).

    Figure 3 – 2023 Soybeans Export Values by Product and Region (FOB, $Millions)

    Source: UN Comtrade Database
    Notes: HS Code: 1201 (Soybeans), 1507 (Soybean oil), 2304 (Soybean meal)

    [1] Sources: https://policy.trade.ec.europa.eu/eu-trade-relationships-country-and-region/countries-and-regions/mercosur/eu-mercosur-agreement/factsheets-and-guides_en

    https://agenciabrasil.ebc.com.br/economia/noticia/2024-12/entenda-como-ficam-exportacoes-agricolas-apos-acordo-mercosul-ue


    Calil, Yuri, and Pancho Abello. “EU-Mercosur Trade Agreement.Southern Ag Today 4(52.4). December 26, 2024. Permalink

  • Corn Market Outlook: Higher Ending Stocks, Steady Demand, and Price Pressure

    Corn Market Outlook: Higher Ending Stocks, Steady Demand, and Price Pressure

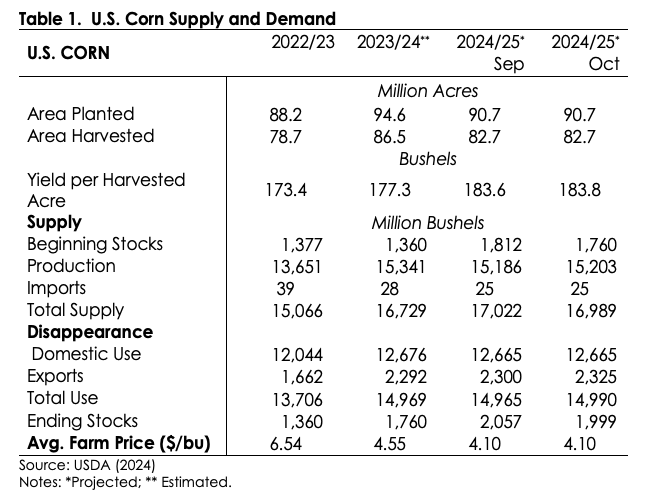
    In its October World Agricultural Supply and Demand Estimates (WASDE) update, USDA forecasted a roughly 2% increase in total corn supply for the 2024/25 season, contrasting with last year’s levels, while demand is forecasted to hold steady. This supply growth and stable demand has led to a downward trend in corn prices, projected at $4.10 per bushel – a 10% decrease from last season. 

    On the supply side, a 29% rise in beginning stocks has boosted total supply availability by 400 million bushels over last year. Despite a 3.7% increase in yields, a 4.4% reduction in harvested acreage shaved overall production by 0.9%, leaving output 138 million bushels below last year’s total (Table 1). Recent USDA ratings show roughly two-thirds of the crop in good or excellent condition, suggesting strong yield potential. Dry weather across the Corn Belt created ideal harvest conditions, accelerating progress to 81% of the crop harvested in the top 18 corn-producing states by October 27 – well ahead of the five-year average of 64%.

    On the demand front, feed and residual use for corn is projected to edge up by 0.2%, or 11 million bushels, compared to last season, as growth in the broiler and hog sectors offsets a decline in the cattle herd. While corn usage for ethanol may see a slight dip of 21 million bushels (-0.4%), corn exports are forecast to climb 1.4%, adding 33 million bushels over last year’s total. The export boost can be partially attributed to competitive U.S. prices and limited supplies from drought-affected South American countries, particularly Brazil. However, total corn demand is projected to remain largely unchanged from the 2023/24 crop season, as shown in Table 1.

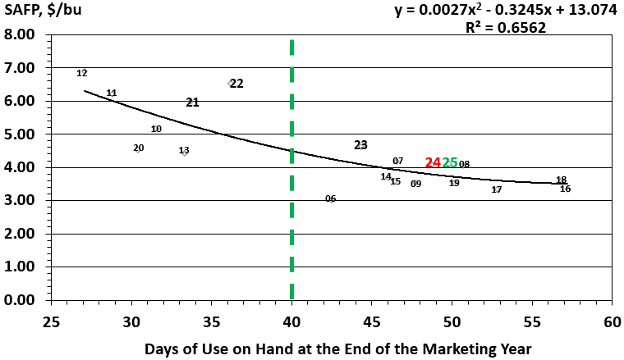
    With supply anticipated to surpass demand, the USDA projects ending corn stocks to climb by 239 million bushels, a 14% increase over last season (Table 1). The “Days of Use on Hand at the End of the Marketing Year” built from ending stock levels indicates how many days the remaining corn supplies would last, based on average daily consumption, assuming no additional supply. This metric has a strong inverse relationship with season-average farm prices (SAFP), as illustrated in Figure 1. Given this relationship, along with USDA projections, Figure 1 suggests prices will hover around $4.10 per bushel in the coming year.

    Latent factors could shift these projections, with geopolitical tensions playing a key role. The outcome of the U.S. elections may spark trade tensions, potentially changing global commodity markets. Meanwhile, the ongoing conflicts in the Middle East and between Russia and Ukraine can impact fertilizer and grain prices. In South America, recent rainfall has improved growing conditions, but the onset of La Niña brings uncertainty. After months of bearish sentiment and a period of neutrality, non-commercial net long positions in corn have turned positive, signaling a shift; speculators now hold more long than short positions, betting on a price rise.

    Figure 1.  U.S. Corn Average Farm Price and Days of Use on Hand

    Sources: USDA, WASDE 10/12/2024, FAPRI August Baseline, Welch (2024).
    SAFP: Season-Average Farm Price

    References

    USDA (2024). WASDE Report. Retrieved from: https://www.usda.gov/oce/commodity/wasde

    Welch (2024). Feed Grain Outlook. Volume 33, Number 61. 


    Calil, Yuri. “Corn Market Outlook: Higher Ending Stocks, Steady Demand, and Price Pressure.Southern Ag Today 4(45.3). November 6, 2024. Permalink

  • Shifting Winds: The Changing Landscape of Cotton Production and Exports in the U.S. and Brazil (Part 2)

    Shifting Winds: The Changing Landscape of Cotton Production and Exports in the U.S. and Brazil (Part 2)

    In Part 1, we examined the importance of international markets for cotton growers amid a significant decline in U.S. cotton processing capacity. Since 1995, U.S. cotton mill use has plummeted by 84%, reaching 1.85 M bales in the 2023 crop season—the lowest level in over a century. During this period, Brazil’s production surged, enabling it to surpass the U.S. in cotton exports. In this second part, we briefly analyze yield and production trends in both countries, exploring their potential impact on future exports.

    After the World Trade Organization (WTO) Agreement on Textiles and Clothing (ATC) came into effect in 1995, U.S. cotton production averaged 17.1 million bales annually. For the 2024/25 crop season, the USDA estimates production at 14.5 million bales (Fig. 1), reflecting an improvement over the past two years. However, untimely rains have hindered optimal crop development in Texas, the largest cotton-producing state. In 2023, Brazil outpaced the U.S. in cotton production (Fig. 1), with USDA forecasting a harvest of 16.7 million bales for the 2024/25 crop season – nearly nine times the amount produced in 1995. This growth in Brazil is primarily due to land expansion and yield improvements.

    Figure 1 – Cotton Production in the U.S. and Brazil: 1960 – 2024. 

    Notes: ATC: Agreement on Textiles and Clothing. 2024 are estimated values. 
    Source: FAS/USDA/PSD. 

    Brazil’s cotton acreage has expanded by 71% since 1995. Most Brazilian cotton is grown as a double crop, following soybean harvest. Cotton competes for land with corn, allowing farmers to benefit from fiber-food diversification. This year, low corn prices prompted growers to shift more acreage to cotton, resulting in a 16.8% increase in planted area. 

    Post-ATC, Brazil began outperforming the U.S. in cotton yield. Enhanced farming practices and the introduction of transgenic cotton seeds in the late 2000s significantly boosted productivity. Brazilian yield soared from 323.9 lbs./ac in 1995 to 1,705 lbs./ac in 2023 – a fivefold increase. In contrast, U.S. cotton yields have plateaued around 846.5 lbs./ac since 2004 (Fig. 2), a notable achievement considering the challenging weather conditions faced by U.S. producers.  

    Figure 2 – U.S. and Brazil Cotton Yields. 

    Notes: ATC: Agreement on Textiles and Clothing. 2024 are estimated values. 
    Source: FAS/USDA/PSD. 

    Brazil’s soil and climate favor cotton expansion, signaling a promising export future. However, the profitability of second-season corn often influences farmers’ decisions to plant cotton. Expanding cotton beyond traditional areas is limited by the need for specialized infrastructure, such as cotton gins and storage facilities. Moreover, cotton demands more sophisticated technology and a longer growing season than corn, adding climatic risk to production. Despite these challenges, Brazil has made notable progress. In 2023, the country achieved a milestone by exporting cotton to Egypt, showcasing the enhanced quality of its fiber. Additionally, a new export route through the port of Salvador, strategically closer to the key cotton region of western Bahia, was established to alleviate bottlenecks at Santos, Brazil’s main export hub.

    Brazil is poised to contend for the top position in global cotton sales. Preliminary analysis indicates that cotton remains more profitable than corn in the country. Despite narrowing margins for Brazilian cotton producers, a modest increase in acreage is expected for the next cycle. Cotton prices on ICE Futures in New York have fallen by 20% since February, now trading around $0.70 per pound. Meanwhile, the dollar’s 12% appreciation against the Brazilian real has bolstered Brazil’s price competitiveness, mitigating the impact of falling cotton prices in the country. Although recent droughts in the U.S. have curtailed production, Brazil’s surging output has halted the effects on global prices. Monitoring Brazil’s cotton market provides valuable insights into global price trends and affects marketing strategies for Southern U.S. growers.

    References. 

    FAS/USDA/PSD. PSD Data Sets. Retrieved from: https://apps.fas.usda.gov/psdonline/app/index.html#/app/home[Accessed September 18, 2024].


    Cali, Yuri, and Rachel Judd. “Shifting Winds: The Changing Landscape of Cotton Production and Exports in the U.S. and Brazil (Part 2).” Southern Ag Today 4(40.4). October 3, 2024. Permalink

  • Shifting Winds: The Changing Landscape of Cotton Production and Exports in the U.S. and Brazil (Part 1)

    Shifting Winds: The Changing Landscape of Cotton Production and Exports in the U.S. and Brazil (Part 1)

    The United States has led world cotton exports since the 1980s. After the 1990s, the U.S. shipped most of its cotton production to foreign markets. As domestic processing capacity shrank,  U.S. cotton farmers became more dependent on international markets. Brazil expanded cotton production and exports in this context, challenging the U.S. leadership in cotton. We briefly contrast the U.S. and Brazilian cotton markets in two parts: the first highlights trade and the second production.  

    The importance of international markets for U.S. cotton farmers has grown in recent decades. In 1995, the World Trade Organization (WTO) implemented the Agreement on Textiles and Clothing (ATC). The ATC gradually phased out quotas on textile imports over ten years. Since the ATC’s implementation, U.S. exports jumped from 37% to 72% of total supply in 2023, underscoring the U.S.’s competitiveness overseas. Brazil exhibited a similar trajectory, reaching 66% of its total supply exported in 2023. Total supply includes beginning stocks, production, and imports. Figure 1 illustrates the upward trend of export relevance to cotton farmers. 

    Figure 1 – Cotton Exports as a Percentage of Total Supply. 

    Notes: Total supply is the sum of beginning stocks, production, and imports. ATC: Agreement on Textiles and Clothing. 2024 are estimated values. 
    Source: FAS/USDA/PSD. 

    Brazil surpassed U.S. cotton exports in 2023. The U.S. exported 11.75 M bales in the 2023 crop season, and Brazil shipped 12.1 M bales, leading cotton exports for the first time (USDA, 2024). Figure 2 shows the growth of Brazilian exports while U.S. exports stagnated. Factors such as Asian demand, favorable exchange rates, government support, and competitive prices fueled Brazilian exports. The U.S.-China trade war (2018-19) further shifted trade dynamics. 

    Figure 2 – U.S. and Brazil Cotton Exports. 

    Notes: ATC: Agreement on Textiles and Clothing. 2024 are estimated values. 
    Source: FAS/USDA/PSD. 

    Before the U.S.-China trade war, China ranked third among the largest importers; today, it tops the list. China now serves as the primary destination for U.S. and Brazilian cotton. According to U.N. Comtrade (2024), Brazil’s share of the Chinese market surged from 9% in 2014 to 37% in 2023, matching the U.S.[1] From 2022 to 2023, Brazilian cotton shipped to China jumped 49%, while U.S. exports dropped 33%. However, in the first half of 2024, the U.S. increased its exports to the Asian country by 79% compared to the same period last year. 

    The continued growth of Brazil’s cotton exports will likely challenge U.S. dominance further. Understanding the surge in Brazilian supply is particularly relevant for Southern growers, which are facing prices below $0.70 per pound, less than half of the May 2022 peak. Also, modest economic growth and high interest rates have constrained consumer spending worldwide, depressing the global demand for cotton. In part 2, we will review yield and production trends and how they may shape the export outlook. 

    References. 

    FAS/USDA/PSD. PSD Data Sets. Retrieved from: https://apps.fas.usda.gov/psdonline/app/index.html#/app/home[Accessed August 22, 2024].

    U.N. Comtrade. Trade Data. Retrieved from: https://comtradeplus.un.org/ [Accessed August 29, 2024].


    [1]. Market share is calculated from cotton quantity. The analysis with the U.S. Comtrade Database used HS 5201 cotton (not carded or combed). 


    Cali, Yuri, and Rachel Judd. “Shifting Winds: The Changing Landscape of Cotton Production and Exports in the U.S. and Brazil (Part 1).Southern Ag Today 4(36.4). September 5, 2024. Permalink

  • U.S. Beef Imports: A Quick Look at Recent Trends

    U.S. Beef Imports: A Quick Look at Recent Trends

    Cattle prices have reached record highs, and the cattle herd is the smallest since the 1950s. USDA predicts high domestic prices will result in increasing imports in the coming years. The U.S. is an attractive market, particularly for lean beef trimmings for ground beef. This article briefly discusses the recent spike in live animals, fresh/chilled, and frozen meat imports.  

    During the first half of 2024, imports of beef and live cattle soared. From January to June 2024, the U.S. imported 175,441 more head of cattle than in the same period last year, a 19% increase, reaching 1.12 million animals (Fig. 1). Over the same span, imported Fresh/Chilled and Frozen beef rose 11% and 29%, totaling 331,550 and 365,067 metric tons (MT), respectively (Fig. 1). Tight lean supplies along with high domestic beef prices help explain the growth in foreign acquisitions. 

    As the U.S. cattle herd declines, live animal imports have increased, mostly from Mexico (Fig. 2). Drought in Mexico and high U.S. cattle prices helped fueled more U.S. feeder cattle imports. In 2023, Mexican sales to the U.S. jumped 43%.  That is 375,879 more head of cattle than in 2022. The Mexican herd has been stable recently, with FAS-PSD/USDA forecasting 0.4% growth in 2024.

    Imported fresh or chilled beef has been growing over the past decade (Fig. 3). In 2023, the U.S. imported more than double the quantity it did in 2013 (Fig. 3). During this period, Canada provided, on average, half of the U.S. imported fresh/chilled meat while Mexico had, on average, 34% of market share. FAS-PSS/USDA predicts Canada stocks will drop 2% in 2024, down to 11.06 million head. 

    The amount of foreign frozen beef increased by 20% from 2022 to 2023, totaling 0.57 MMT last year (Fig. 3). In 2013, Australia and New Zealand each held 41% of the frozen imported beef market. However, their market shares declined to 28% and 29% over the last decade. A two-year drought (2019-20) affected Australia’s supply. Since 2020, shipments from Brazil expanded, reaching 90,303 MT in 2023, representing 16% of the market share. When China temporarily banned Brazilian beef imports in 2021, Brazil diverted its products to other countries, including the U.S. According to FAS-PSD/USDA, Brazil’s (-0.92%) and New Zealand’s (-1.66%) cattle herds are expected to decrease in 2024, while Australia’s stock is projected to increase by 4.93%.

    U.S. beef imports are likely to continue ahead of last year as fewer cows are culled, and lean beef supplies continue to shrink.  Drought in Mexico will be a major factor in feeder cattle imports in coming months.

    Figure 1. The U.S. Total Imported of Live Animals, Fresh/Chilled and Frozen Beef, Quantity: Jan – Jun 2023 vs. Jan – Jun 2024. 

    Source: FAS-USDA (2024).

    Figure 2. U.S. Live Cattle Imports from Canada and Mexico, 2013-2023. 

    Source: FAS-USDA (2024).
    Note: Total quantity imported of live cattle other than purebred or those imported (HS code: 1022940).

    Figure 3. The U.S. Total Imported Fresh/Chilled and Frozen Beef, Quantity: 2013-2023 

    Source: FAS-USDA (2024).

    References

    FAS-PSD/USDA (2024). PSD Reports. Livestock and Poultry. Retrieved from:   https://apps.fas.usda.gov/psdonline/app/index.html#/app/downloads

    FAS-USDA (2024). Standard Query. Retrieved from: https://apps.fas.usda.gov/gats/ExpressQuery1.aspx


    Calil, Yuri. “U.S. Beef Imports: A Quick Look at Recent Trends.” Southern Ag Today 4(35.2). August 27, 2024. Permalink