Category: Crop Marketing

  • Corn and Cotton Prevented Planting Decisions 

    Corn and Cotton Prevented Planting Decisions 

    From 2019 to 2023, 4.6 million corn acres and 1.4 million cotton acres in the 13-state southeast region were prevented from planting (Table 1; USDA-FSA).

    Table 1. Corn and Cotton Prevented Planted Acres for 13 Southern States, 2019-2023

    Source: USDA Farm Service Agency Crop Acreage Data

    Prevented planting is a provision covered by the United States (US) Federal Crop Insurance Program that compensates producers for losses from delayed planting or not being able to plant an eligible crop within that crop’s region-specific planting period. Under the prevented planting provision, revenue protection (RP), revenue protection with harvest price exclusion (RP-HPE), and yield protection (YP) crop insurance pay producers an indemnity if they are impeded from planting an insured crop by a designated final planting date, or within any applicable late planting period.[1] If a producer – who purchased a qualifying policy – is unable to plant by the final planting date, there are four options: 

    1. Plant the insured crop in the late planting period with reduced insurance. For most crops, the production guarantee[2] decreases one percent per day, for each day of delay after the final plant date until the crop is planted or the end of the late planting period. Late planting periods vary by crop and area.

    2. Take the prevented planting payment, based on the applicable prevented planting factor, and leave ground fallow or plant a summer cover crop after the late planting period. Summer cover crops cannot be harvested or grazed before November 1. 

    3. Receive 35% of the prevented planting payment for the original crop and switch to an uninsured second crop.

    4. Forgo the prevented planting payment for the first crop and plant an insured second crop.

    Figure 2. Corn Prevented Planting Decision Tool Results

    Source: University of Tennessee Prevented Planting Decision Aid
    Projected results are dependent on user specified variables and are displayed for educational purposes only. Actual results may vary based on market conditions and individual circumstances. 

    The tool depicted in Figure 2 charts the average net returns across all four prevented planting options, aiding producers in their prevented planting decisions.  Projected net returns are operation specific and will change by commodity market prices, planting costs, average production history (APH), coverage level, and insurance premium costs. Changing each variable to fit an operation allows producers to quantify the impacts of each prevented plant decision.  

    The example in Figure 2 depicts a corn-soybean prevented plant scenario where taking 35% of the full prevented planting payment and planting uninsured soybeans provides the highest projected net returns from June 4th to July 2nd (yellow line in figure 2). After July 2nd, taking the full prevented planting payment provides higher net returns due to the yield losses from later season beans (blue line in Figure 2). It is worth noting that planting an uninsured second crop and taking 35% of the full prevented planting payment is a riskier decision than taking the full prevented planting payment. Regardless of date, planting insured beans or late planted corn are projected lower net return decisions in this scenario. Net returns by day of year are based on Tennessee data and may vary between states. 

    Prevented planting decisions can have large financial impacts on crop producer profitability. In our scenario, late planted corn could even result in a net loss. The prevented plant decision can be quantified by utilizing a prevented planting decision tool to maximize net returns at the farm level. 


    [1]The final planting date is the last day to plant an insured crop and be eligible for full coverage. The late planting period begins the day after the final planting date and ends 25 days after the final planting date. Final and late planting periods vary by crop and region.

    [2] The production guarantee is the guaranteed revenue or yield offered by the crop insurance policy. For an RP policy, the guarantee is calculated by multiplying the insurance price by actual production history (APH) yield, which is a 4-to-10-year trend adjusted average yield used for future crop insurance purchases, by insurance coverage level.

    References

    University of Tennessee Prevented Planting Decision Aid. Available at https://arec.tennessee.edu/prevented-planting-decision-aids/  

    University of Tennessee Field Crop Budgets. 2024. Accessed at: https://arec.tennessee.edu/extension/budgets/

    USDA Farm Service Agency Crop Acreage Data. 2019-2023. Accessed at https://www.fsa.usda.gov/news-room/efoia/electronic-reading-room/frequently-requested-information/crop-acreage-data/index

    USDA Risk Management Agency. Prevented Planting Insurance Provisions Flood. Accessed at: https://www.rma.usda.gov/en/Fact-Sheets/National-Fact-Sheets/Prevented-Planting-Insurance-Provisions-Flood

    USDA Risk Management Agency. Prevented Planting Insurance Provisions Drought. Accessed at: https://www.rma.usda.gov/en/Fact-Sheets/National-Fact-Sheets/Prevented-Planting-Insurance-Provisions-Drought

    USDA Risk Management Agency. Prevented Planting. Accessed at: https://www.rma.usda.gov/en/Topics/Prevented-Planting

    Duncan, Hence, Chris Boyer, and Aaron Smith. “Corn and Cotton Prevented Planting Decisions.Southern Ag Today 4(15.1). April 8, 2024. Permalink

  • The 2024 Sugar Market Domestic Supply and Outlook

    The 2024 Sugar Market Domestic Supply and Outlook

    The domestic production of sugar in the United States (U.S.) originates from sugarcane harvested in Florida, Louisiana, and Texas and sugarbeets harvested across the Upper Midwest, Central Plains, Mountain states, Pacific Northwest, and California. Sugarcane is harvested from October to March and sugarbeets are harvested in the late summer through fall, except for California where sugarbeets are harvested in the spring through the summer. Earlier this year, the U.S. Department of Agriculture (USDA) forecasted a record domestic sugar crop for fiscal year (FY) 2023/24, which is from October 2023 to September 2024. The USDA later lowered its FY 2023/24 forecast to 9.24 million short tons raw value (STRV) of sugar (Figure 1) because of unseasonably warm weather in the Upper Midwest and a severe drought in Louisiana and Texas (USDA, 2024b). 

    U.S. beet sugar production for FY 2023/24 is now estimated at 5.17 million STRV, which is consistent with previous FYs (Figure 1). In earlier USDA reports, the beet sugar production forecast was as high as 5.41 million STRV, but unseasonably warm temperatures in the Red River Valley during the months of December and February led to a portion of sugarbeet piles having to be discarded due to spoilage. This contributed to increased beet shrink, which rose from 7.88% in February to 9.00% in March, and decreased sucrose extraction which fell from 15.26% to 15.02% month-over-month (USDA, 2024c). As a result, USDA lowered projections of beet sugar production this year, from 5.41 million STRV in January to 5.17 million STRV in March (a reduction of almost 240,000 tons in two months).

    U.S. cane sugar production for FY 2023/24 is estimated at 4.07 million STRV. This would be the highest level of cane sugar production since FY 2019/20. Increases from the state of Florida and a better-than-expected crop in Louisiana (which was hard hit by drought during the growing season) contributed to FY 2023/24’s production eclipsing last year’s level. Prior to the onset of drought conditions in Louisiana, the state was poised to post its third consecutive year of strong, record setting production, overtaking Florida for two consecutive years for the first time. However, current estimates of cane sugar production from Louisiana are down about 65,194 tons from last year’s production to 1.94 million tons.

    Figure 1. U.S. Beet and Cane Sugar Production.

    Source USDA 2024a.

    Lastly, the lack of both rainfall and irrigation water for agricultural producers in the Rio Grande Valley of South Texas over the past several years has caused cane sugar production from Texas to fall from as much as 169,000 STRV in 2017 to as few as 40,000 STRV this year. In February, the Board of Directors from the Rio Grande Valley Sugar Growers announced that this would be the last year of cane sugar production in Texas. Given the uncertainty regarding the administration of the 1944 Water Treaty between Mexico and the U.S., which governs water sharing on both the Colorado River as well as the Lower Rio Grande, growers could not count on irrigation water supply, making purchasing crop insurance uncertain and making necessary investments into the sugar mill and farming operations too risky (USDA, 2024c; San Antonio Express News, 2024). 

    In total, U.S. sugar production in FY 2023/24 is estimated to be 9.24 million STRV, which would be the third largest crop behind FY 2017/18 (9.29 million STRV) and last year’s crop (9.25 million STRV). With expected domestic demand of 12.6 million STRV and some exports going to Mexico, total use is projected at 12.7 million STRV (USDA, 2024a) which would, suggest ending stocks of 1.7 million STRV, and a stocks-to-use ratio of 13.4%, all else being equal. On average, the USDA’s estimates of ending stocks-to-use have been low in March relative to the final estimate in December by 1.2% over the past six years, suggesting a final stocks-to-use of approximately 14.6%, and ending stocks of 1.85 million STRV, or 3.7 billion pounds of sugar.

                Even though U.S. sugar producers have seen their input costs rise by more than 30% since the last Farm Bill (Deliberto and DeLong, 2023), the U.S. is still the fifth largest producer of sugar in the world producing more than 9 million STRV of sugar (USDA, 2024d). 

    With 12.5 million STRV of sugar consumption, the U.S. is also the third largest importer of sugar in the world (USDA, 2024d). How these dynamics interact with sugar markets and sugar policy will be addressed in a future Southern Ag Today article.


    References

    Deliberto, M and K.L. DeLong. “Examining Sugarcane and Sugarbeet Production Costs.” Southern Ag Today 3(50.1). December 11, 2023. https://southernagtoday.org/2023/12/11/examining-sugarcane-and-sugarbeet-production-costs/

    United States Department of Agriculture (USDA). 2024a. World Agricultural Supply and 

    Demand Estimates. Retrieved from: https://www.usda.gov/oce/commodity/wasde

    USDA. 2024b. World Agricultural Supply and Demand Estimates. Retrieved from: 

    https://www.usda.gov/oce/commodity/wasde/wasde0324.pdf

    USDA. 2024c. Economic Research Service. Sugar and Sweeteners Outlook. Retrieved from: 

    https://www.ers.usda.gov/webdocs/outlooks/108800/sss-m-427.pdf?v=1130.6

    USDA. 2024d. Foreign Agricultural Service. Sugar: World Markets and Trade. Retrieved from: https://apps.fas.usda.gov/psdonline/circulars/sugar.pdf

    San Antonio Express News. 2024. Texas’ Last Known Sugar Mill Shuts Down in Rio Grande 

    Valley, Citing Water Issues with Mexico. Retrieved from: 

    https://www.expressnews.com/news/article/texas-sugar-mill-closes-cites-water-issues-mexico-18687760.php


    Deliberto, Michael, and Karen L. DeLong. “The 2024 Sugar Market Domestic Supply and Outlook.Southern Ag Today 4(14.1). April 1, 2024. Permalink

  • Peanut Yield Trends

    Peanut Yield Trends

    The USDA released 2023 production estimates in January showing U.S. peanut yields down 7% from 2022 at 3,740 lbs. per acre. As shown in figure 1, the majority of states’ peanut yields declined in 2023, relative to the previous year. The major peanut producing states of Alabama and Florida both saw 17% decreases in their yields. Georgia – the leading state – had a 3% decline to 4,070 lbs. per acre. Yields were down in 2023 largely due to the drought that persisted in the South throughout the latter part of the peanut growing season. Arkansas led the way with its record-high yield of 5,800 lbs. per acre, in part due to most of the state’s peanuts being irrigated.

    Figure 1: 2023 Peanut Yield by State and Percent Change from 2022

    Data source: USDA NASS. Crop Production Annual Summary. January 12, 2024.

    Putting into context where this year’s yield falls historically, let’s look at peanut yield trends since 1970 (figure 2). The 2023 yield is the lowest since 2016. Over the entire 1970-2023 period, peanut yields increased by 36 lbs. per acre annually, on average, but with considerable variation. From 1970 to 2000, peanut yields increased by an average of 7 lbs. per year. Then in 2001, peanut yields reached 3,000 lbs. per acre for the first time, and over the subsequent decade, peanut yields would increase by 57 lbs. per year on average. This substantial increase from 2001-2012 is likely driven by the introduction of the Georgia-06G high yielding runner-type peanut cultivar that was released in 2006 and soon gained a significant market share in the southeast. In 2012, peanut yield surpassed 4,000 lbs. per acre for the first time. However, over the past 12 years, peanut yields have been flat and averaged 3,948 lbs. per acre. In fact, the 2012 mark has yet to be topped. 

    Figure 2: US Peanut Yield Trends

    Data source: USDA NASS. Crop Production Annual Summary. January 12, 2024.

    Peanut yields are an even more critical aspect for profitability due to increased input prices. Production costs are expected to remain elevated in 2024 at $598 per ton, assuming yields equal the five-year average. This means that even with peanut prices expected to reach a decade-high $550/ton, producers would still likely operate at a loss. Strong yields would help lower these breakeven prices, but the recent yield volatility raises concerns that this might not occur.

    References

    Rabinowitz, A. “Peanut Cost of Production, the Farm Bill, and Need for Risk Management.” Southern Ag Today. January 8, 2024. Available at https://southernagtoday.org/2024/01/08/peanut-cost-of-production-the-farm-bill-and-need-for-risk-management/

    USDA-NASS. Crop Production Annual Summary. January 12, 2024.


    Sawadgo, Wendiam. “Peanut Yield Trends.Southern Ag Today 4(13.1). March 25, 2024. Permalink

  • Prospects for Sorghum Premiums in the Upcoming Season: A Forecast Analysis

    Prospects for Sorghum Premiums in the Upcoming Season: A Forecast Analysis

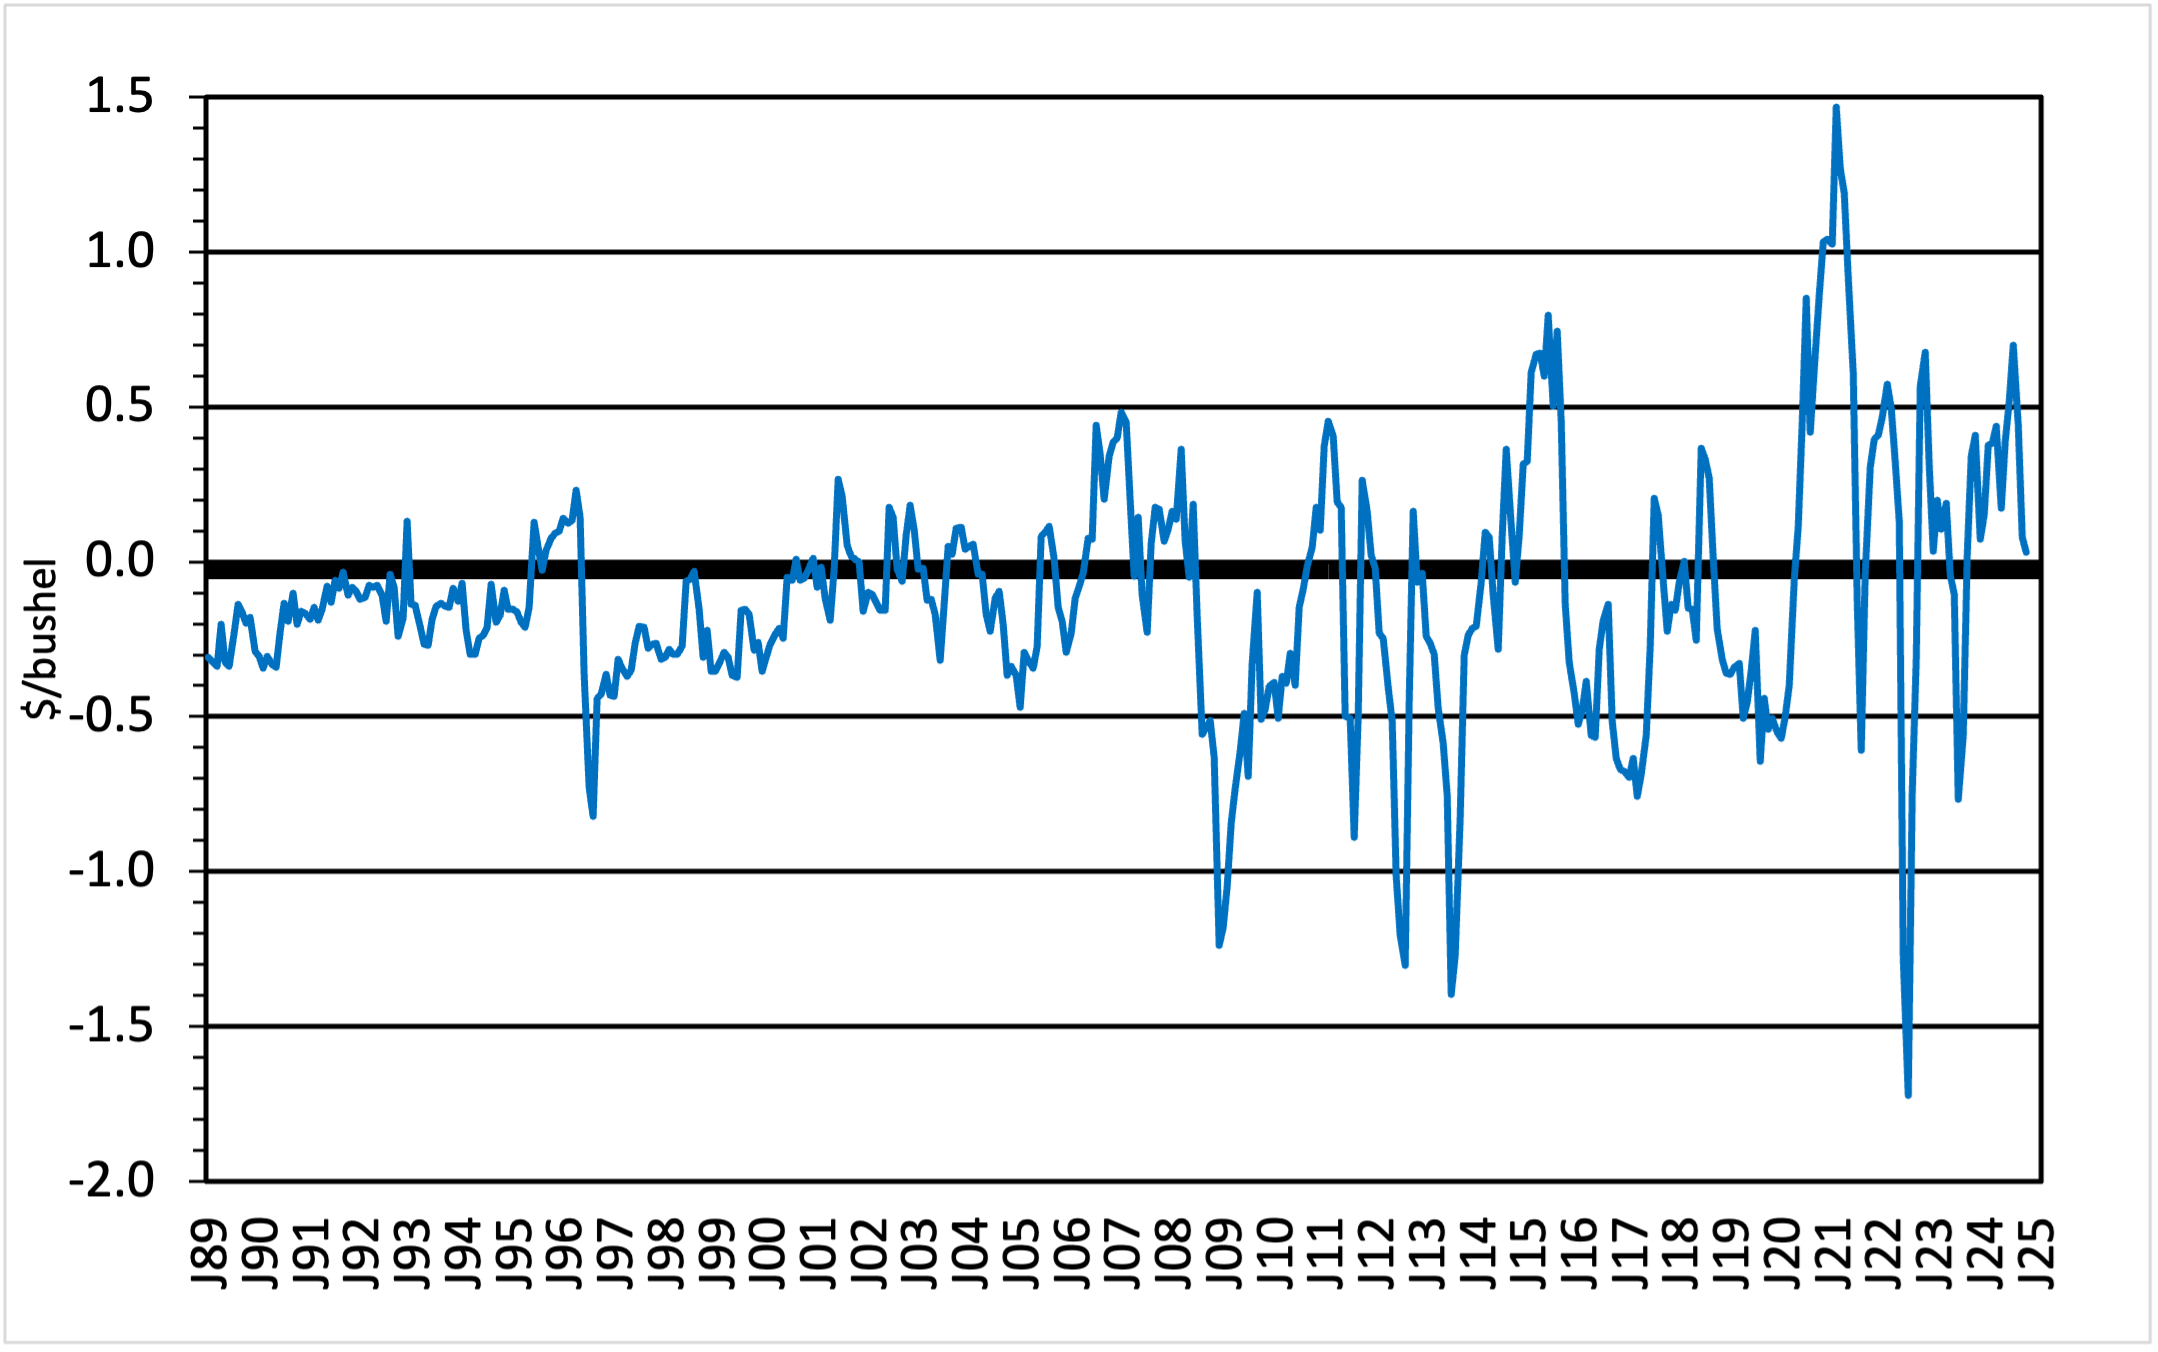
    Sorghum prices generally follow corn prices.  Since 2006/07, the biofuel era, the largest discount of sorghum to corn was -$0.74 per bushel; the largest sorghum premium to corn was +$0.79; and the average price relationship was -$0.11.   (Figure 1).

    Figure 1. Monthly Average Sorghum and Corn Prices Paid to Farmers by Marketing Year

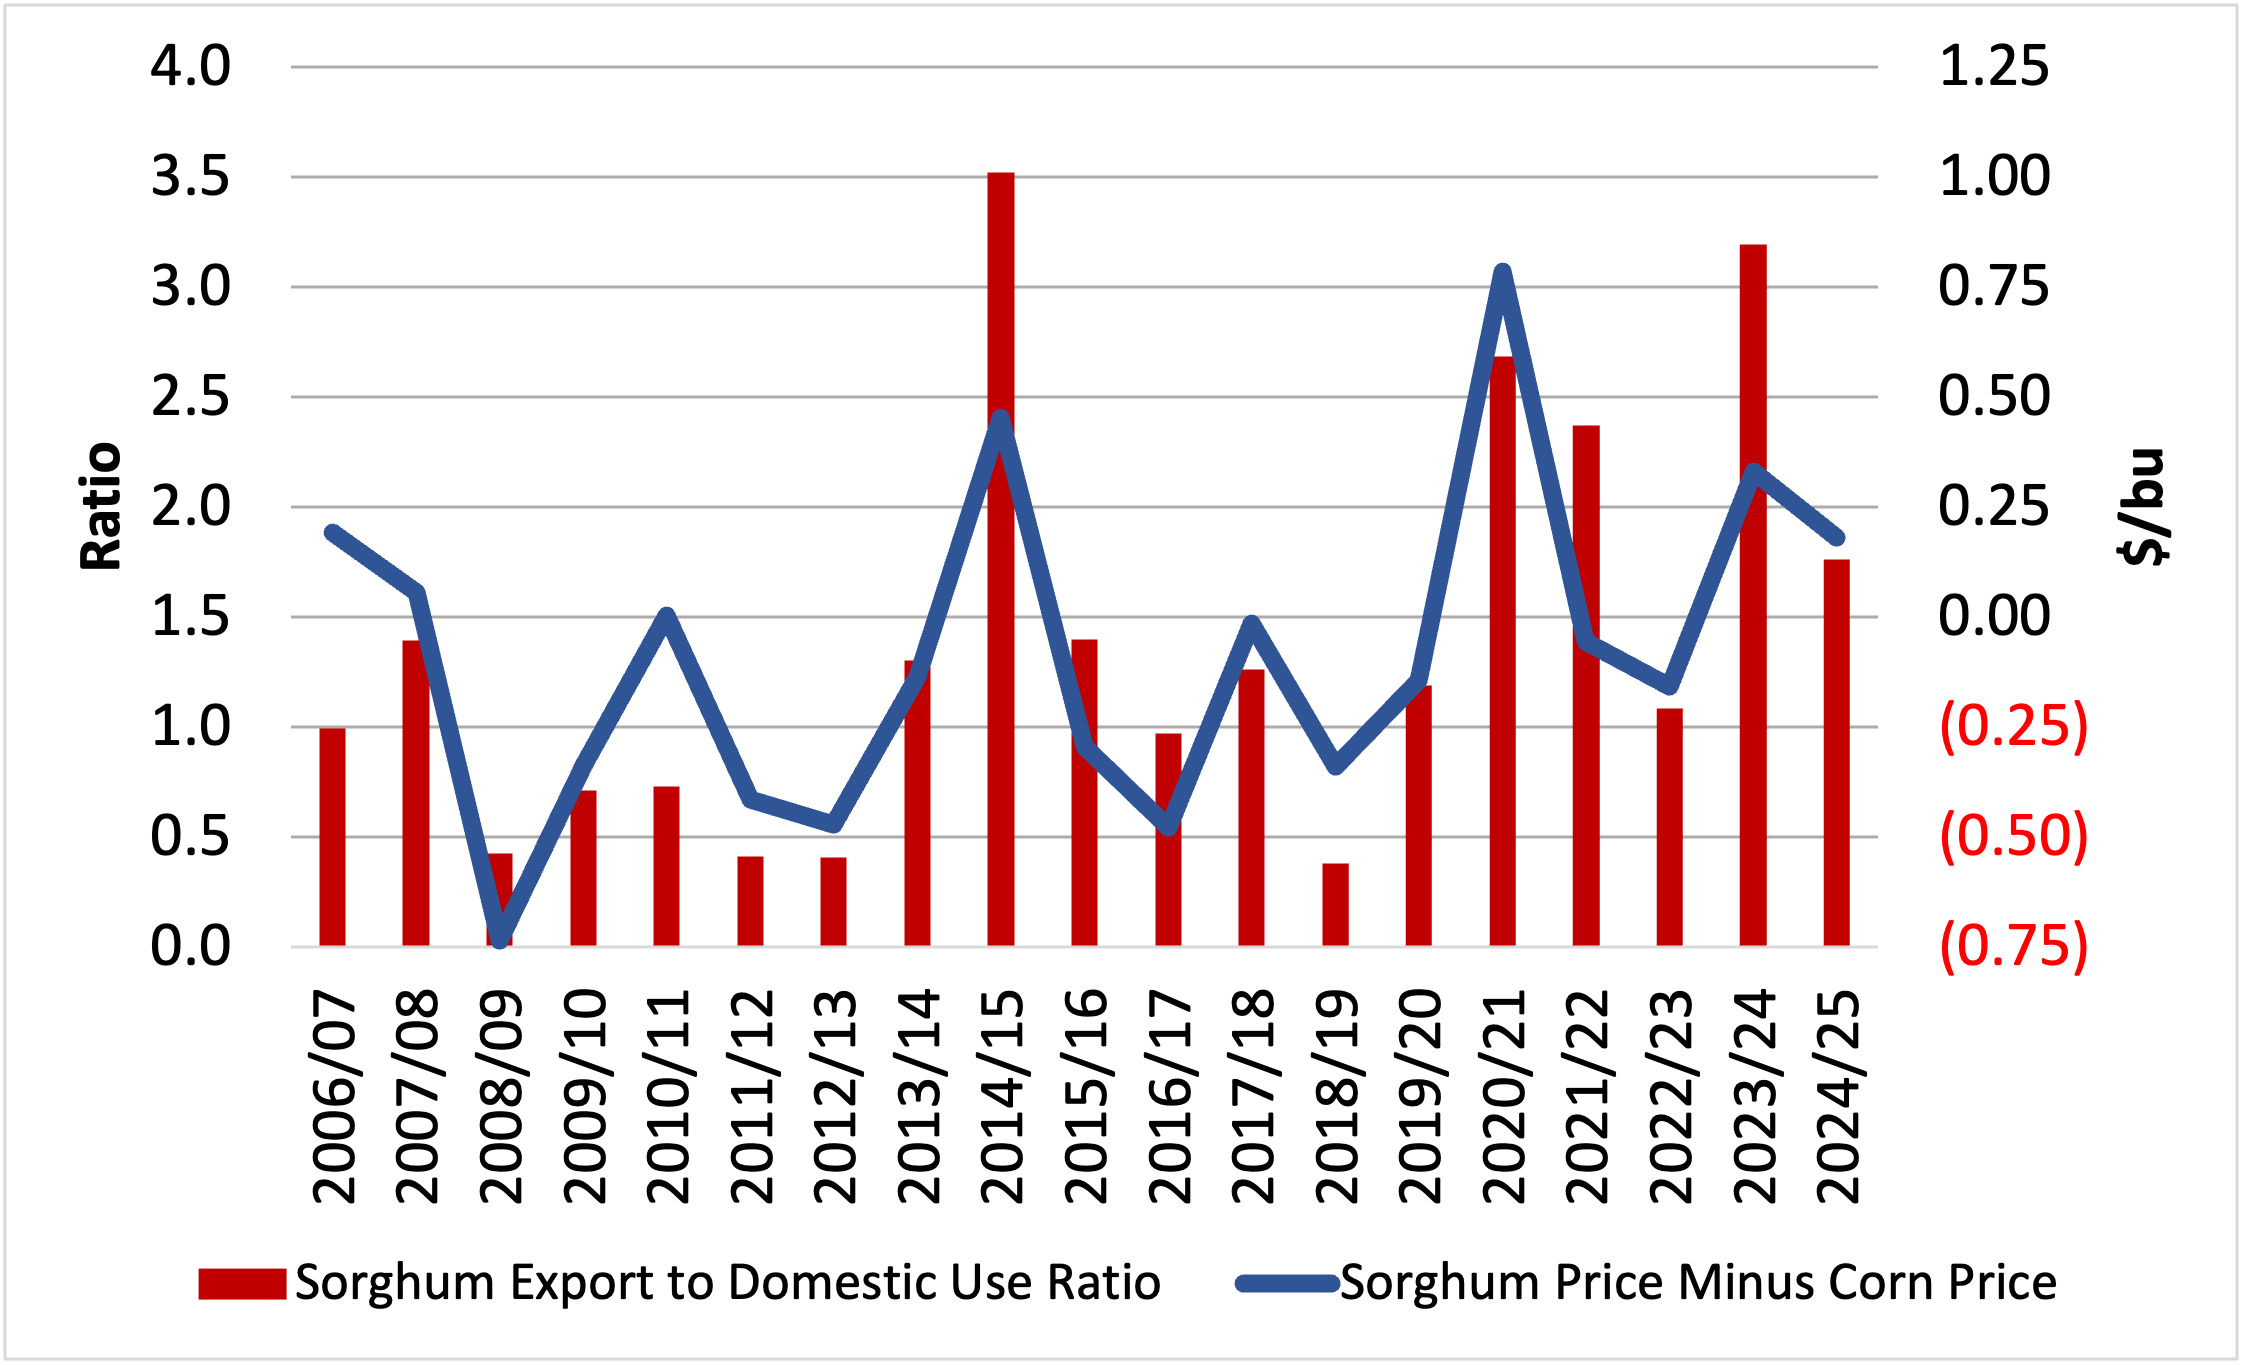
    The level of sorghum premium or discount is largely contingent upon demand, predominantly influenced by exports. Figure 2 shows the relationship between the sorghum exports-to-domestic-use ratio and the premium or discount received by U.S. farmers.

    During the 2020/21 season, we witnessed a significant increase in sorghum premiums due to increased export demand. These premiums occurred because of the US-China Phase One Trade Agreement (U.S. sorghum exports are not subject to tariff-rate quotas like corn), the recovery of the Chinese swine sector, and high corn prices that supported high exports of U.S. sorghum to China. The export ratio over domestic consumption during 2020/21 increased to 2.68 (Figure 2). Exports during this season totaled 279 million bushels, while domestic consumption totaled 104 million bushels. After 2020/21, the ratio of exports over domestic consumption decreased due to lower yields, drought, and fewer exports, reaching a low level of 1.08 in the 2022/23 season and a discount in the price of sorghum to corn of -$0.16 per bushel.

    Figure 2: Sorghum to Corn (Premium or Discount) and the Ratio of Sorghum Exports to Domestic Use

    Source (Dr. M. Welch, USDA February WASDE, USDA, NASS Agricultural Prices)

    During the 2023/24 season, the level of exports increased along with higher production and lower domestic consumption. Production in 2023/24 increased to 318 million bushels from the previous year of 188 million bushels, a result of significantly larger harvested acreage and better yields. The exports-over-domestic-consumption ratio also increased to 3.00 alongside better premiums over corn.

    Looking forward to next season, production for 2024/25 is expected to increase again, given USDA’s February WASDE projections and projections from the Ag Outlook Conference on February 15, 2024. Planted acres are expected to decrease by 2.8% from the previous season, but the area harvested projection is unchanged with a return to more normal growing conditions. The projected yield in 2024 of 69.2 bushels per acre is much better than the drought impacted yields of the last two years, up 33% compared to 2023. 

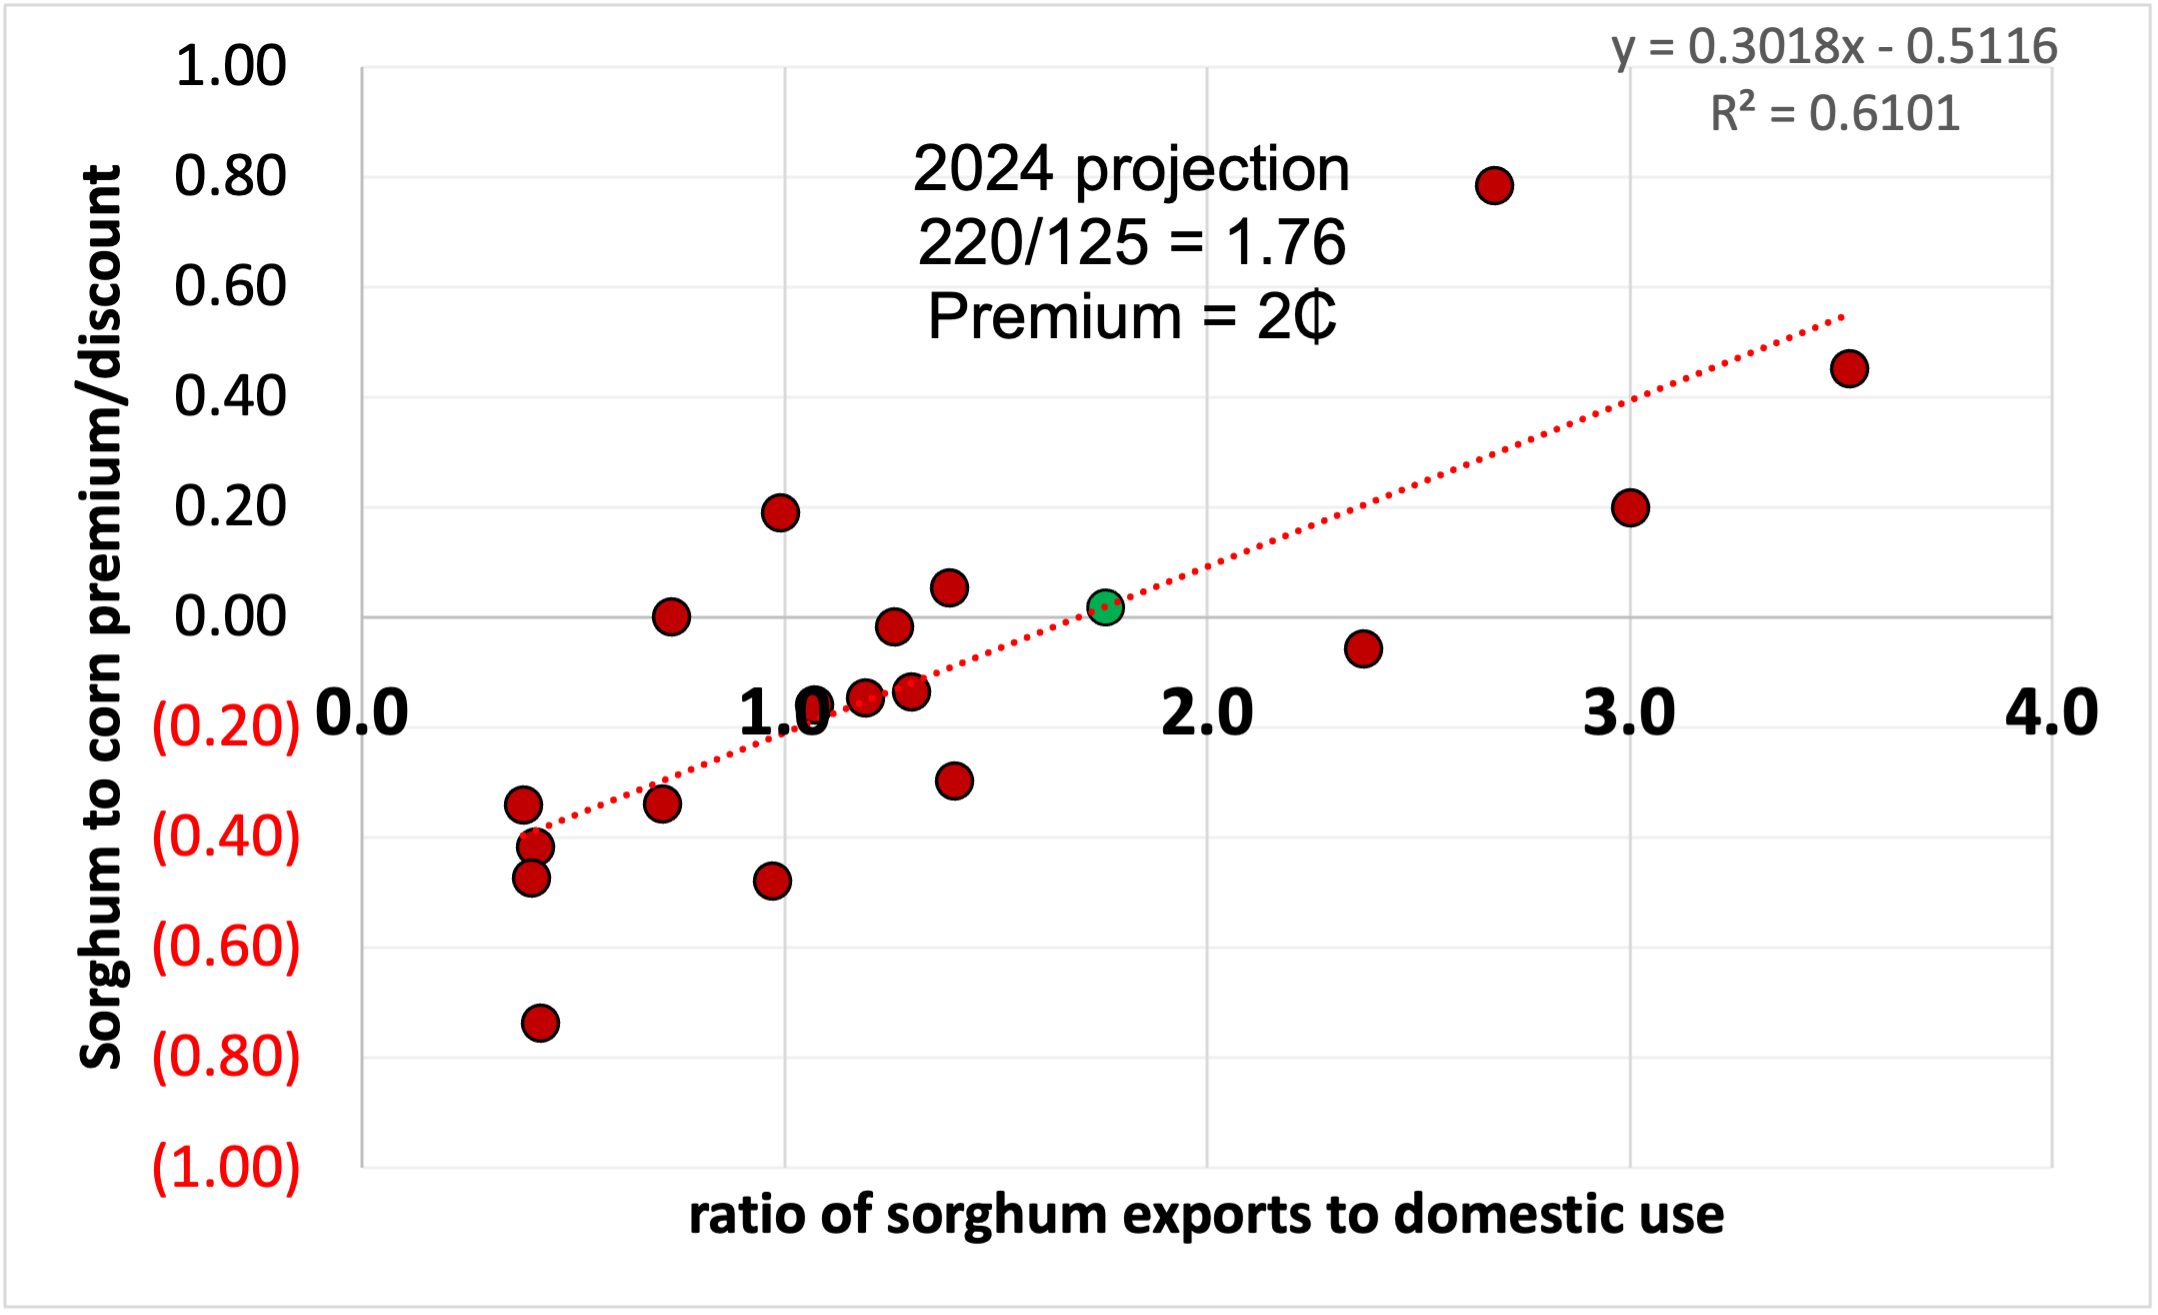
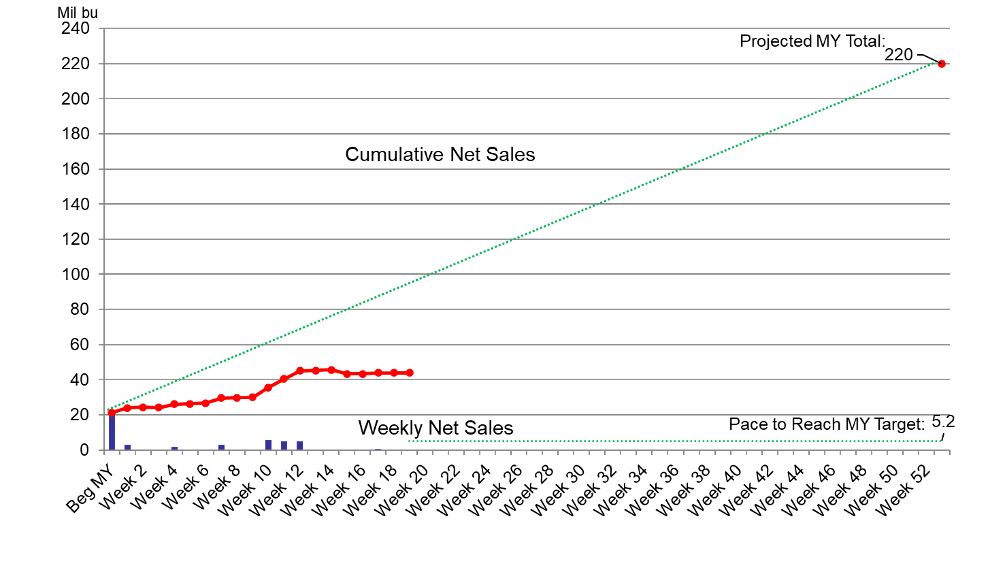
    Domestic use and exports are expected to increase next season. Domestic use is projected to be 115 million bushels (+35 million bushels), while exports are expected to be around 295 million bushels (+55 million bushels). This level of exports and domestic consumption results in a ratio of sorghum exports to domestic use of 2.57. The sorghum premium over corn price at this ratio would be around $0.26/bu using Dr. Welch’s model to calculate sorghum-to-corn premium or discount as a function of the ratio of sorghum exports to domestic use (Figure 3).  While this price relationship is not exact, the ratio of sorghum exports to domestic use in the 2024/25 marketing year is projected to be the 4th highest of the biofuel era, suggesting a better-than-average sorghum price relationship to corn. 

    Figure 3: Sorghum-to-Corn Premium/Discount as Function of the Ratio of Sorghum Exports to Domestic Use

    Source: Dr. Mark Welch, USDA February 2024 WASDE and 2024 Ag Outlook Conference.

    Abello, Francisco Pancho. “Prospects for Sorghum Premiums in the Upcoming Season: A Forecast Analysis.Southern Ag Today 4(12.1). March 18, 2024. Permalink

  • A Quick Look at the 2024 Rice Market

    A Quick Look at the 2024 Rice Market

    Following two consecutive years of decline (see Figure 1), United States (U.S.) rice production increased to roughly 2.9 million acres in 2023 (USDA-ERS, 2024). In 2022 and 2023, the world was consuming more rice which showed up in the long grain rice Marketing Year Average Prices (MYAP) of $16.70/cwt and $15.7/cwt, respectively (USDA-NASS, 2024).  Production increases in 2023 (see Figure 1) followed 2022 high prices that were last seen around harvest of 2013. Fast forward to March 2024, where the current November rough rice futures contract is trading at $14.66/cwt. The November contract price decline has been steady since late December 2023 but has recently begun to increase again ($0.44/cwt since February 27, 2024). 

    Figure 1. U.S. Rice Production, Exports, and Stocks. Source: USDA-FAS, 2024

    There was an extreme multi-year drought in California during the 2022 growing season. During this time, California rice producers could not plant nearly 300,000 acres, due to a lack of water for irrigation (Smith, 2023). Arkansas (a state that almost exclusively grows long-grain varieties) responded by increasing its acreage of medium-grain rice by 55,000 acres in 2023 (USDA-NASS, 2023). However, California rebounded in 2023 and surpassed 500,000 acres of medium-grain rice (Farm Progress, 2024). An abundance of medium-grain rice could hinder any upside price potential if the demand for medium-grain remains at normal levels.

    An Eastern Pacific El Nino has also disrupted off-season rice production for Thailand, Burma, and Indonesia. These countries rely on off-season production to improve their stocks and export amounts. Now, they face extreme drought, impacting yields and production, and may not have enough carry-over and ending stocks to bring rice to the global economy (Reuters, 2023). The USDA forecasts that global rice production for 2023/24 will exceed 2022/23 by only 0.1% (583,000 metric tons). Thus, the El Nino conditions are poised to further tighten global rice supplies in these major exporting countries. 

    Global rice supplies are also strained from India’s July 2023 export ban on non-basmati rice (Glauber and Mamun, 2024). The ban was implemented to help lower domestic rice prices and to ensure rice availability in India. On a global scale, India accounted for nearly 40% of all rice exports in 2022, further showing the global impact of India’s exports (USDA-FAS, 2023). Referring to Figure 2, the ban forced a 93% decline in non-basmati rice exports between August and November of 2023 (Glauber and Mamum, 2024). Importing countries are now forced to turn to alternative suppliers to meet their rice demands. It’s worth noting that India is currently in an election year and it’s doubtful the ban would be lifted before a general election in April or May. If the ban is lifted post-election, watch for Indian rice to flood the market, and put further downward pressure on global rice prices. 

    Figure 2. India Rice Exports. Source: International Food Policy Research Institute, 2024

    Overall, the 2024 rice market will be extremely sensitive to ongoing global conflicts, weather, government policies, and shipping issues such as low water levels in the Panama Canal, a potential return to low water levels in the Mississippi River, and conflicts in the Red Sea. There could continue to be opportunities in the export market should Mississippi River levels stabilize during harvest and if India’s export ban continues. With planting around the corner, it’s worth highlighting that on a per-bushel basis, the current soybean-to-rice price ratio for November 2024 delivery is 1.78 ($11.73/$6.60). This ratio has continued to decline since 2021, when the ratio was 2.41. All to say that the relative prices of other commodities, such as soybeans, are in a similar declining price environment as rice.  

    References

    Barchart.com. (2024, February). Rough Rice Nov ’24 (ZRX24). Retrieved February 29, 2024, from https://www.barchart.com/futures/quotes/ZRX24/profile.

    Fitchette, T. (2023). How will Rice and Soybeans Compete for Acreage in 2024? Farm Progress. Retrieved February 21, 2024, from https://www.farmprogress.com/rice/how-will-rice-and-soybeans-compete-for-acreage-in-2024-.

    Glauber, J. and Abdullah, M. (2024). India’s Export Restrictions on Rice Continue to Disrupt Global Markets, Supplies, and Prices. International Food Policy Research Institute. Retrieved February 25, 2024, from https://www.ifpri.org/blog/indias-export-restrictions-rice-continue-disrupt-global-markets-supplies-and-prices.

    Reuters (2023, November). Dry Soil to Curb Asia’s Early 2024 Rice output, Pressure Supply. Retrieved February 29, 2024, from https://www.reuters.com/markets/commodities/dry-soil-curb-asias-early-2024-rice-output-pressure-supply-2023-12-01/.

    Smith, A.D. (2023). California Rice is Back. Ag Data News. Retrieved February 28, 2024, from https://asmith.ucdavis.edu/news/california-rice-back.

    USDA-FAS. (2024, February). Grain: World Markets and Trade. Retrieved February 12, 2024, from https://apps.fas.usda.gov/psdonline/app/index.html#/app/downloads

    USDA-FAS. (2023, September). Rice Export Prices Highest in More Than a Decade as India Restricts Trade. Retrieved January 8, 2024, from https://fas.usda.gov/data/rice-export-prices-highest-more-decade-india-restricts-trade

    USDA-NASS (2023, March). Arkansas Prospective Plantings. Retrieved January 14, 2024, from https://www.nass.usda.gov/Statistics_by_State/Arkansas/Publications/Crop_Releases/Prospective_Plantings/2023/arplant23.pdf.

    USDA-ERS. (2024, January). Rice Outlook: January 2024. Retrieved January 26, 2024, from https://www.ers.usda.gov/webdocs/outlooks/108291/rcs-24a.pdf?v=5101.6.


    Loy, Ryan. “A Quick Look at the 2024 Rice Market.Southern Ag Today 4(11.1). March 11, 2024. Permalink