Farming in 2025 will be challenging for many row crop producers. Low commodity prices, disappointing 2024 yields, high input costs, and policy uncertainty will require crop farmers to make important agronomic, financial, and risk management decisions. Below are a few points to consider during the planning process.
1) Commodity prices are low and there is currently nothing on the radar that would indicate substantial improvement will occur in 2025. Drought (beyond just the southern region), production disruptions abroad, and geopolitics could improve price prospects, but at this point in time, increases in commodity prices are highly uncertain and mostly wishful thinking.
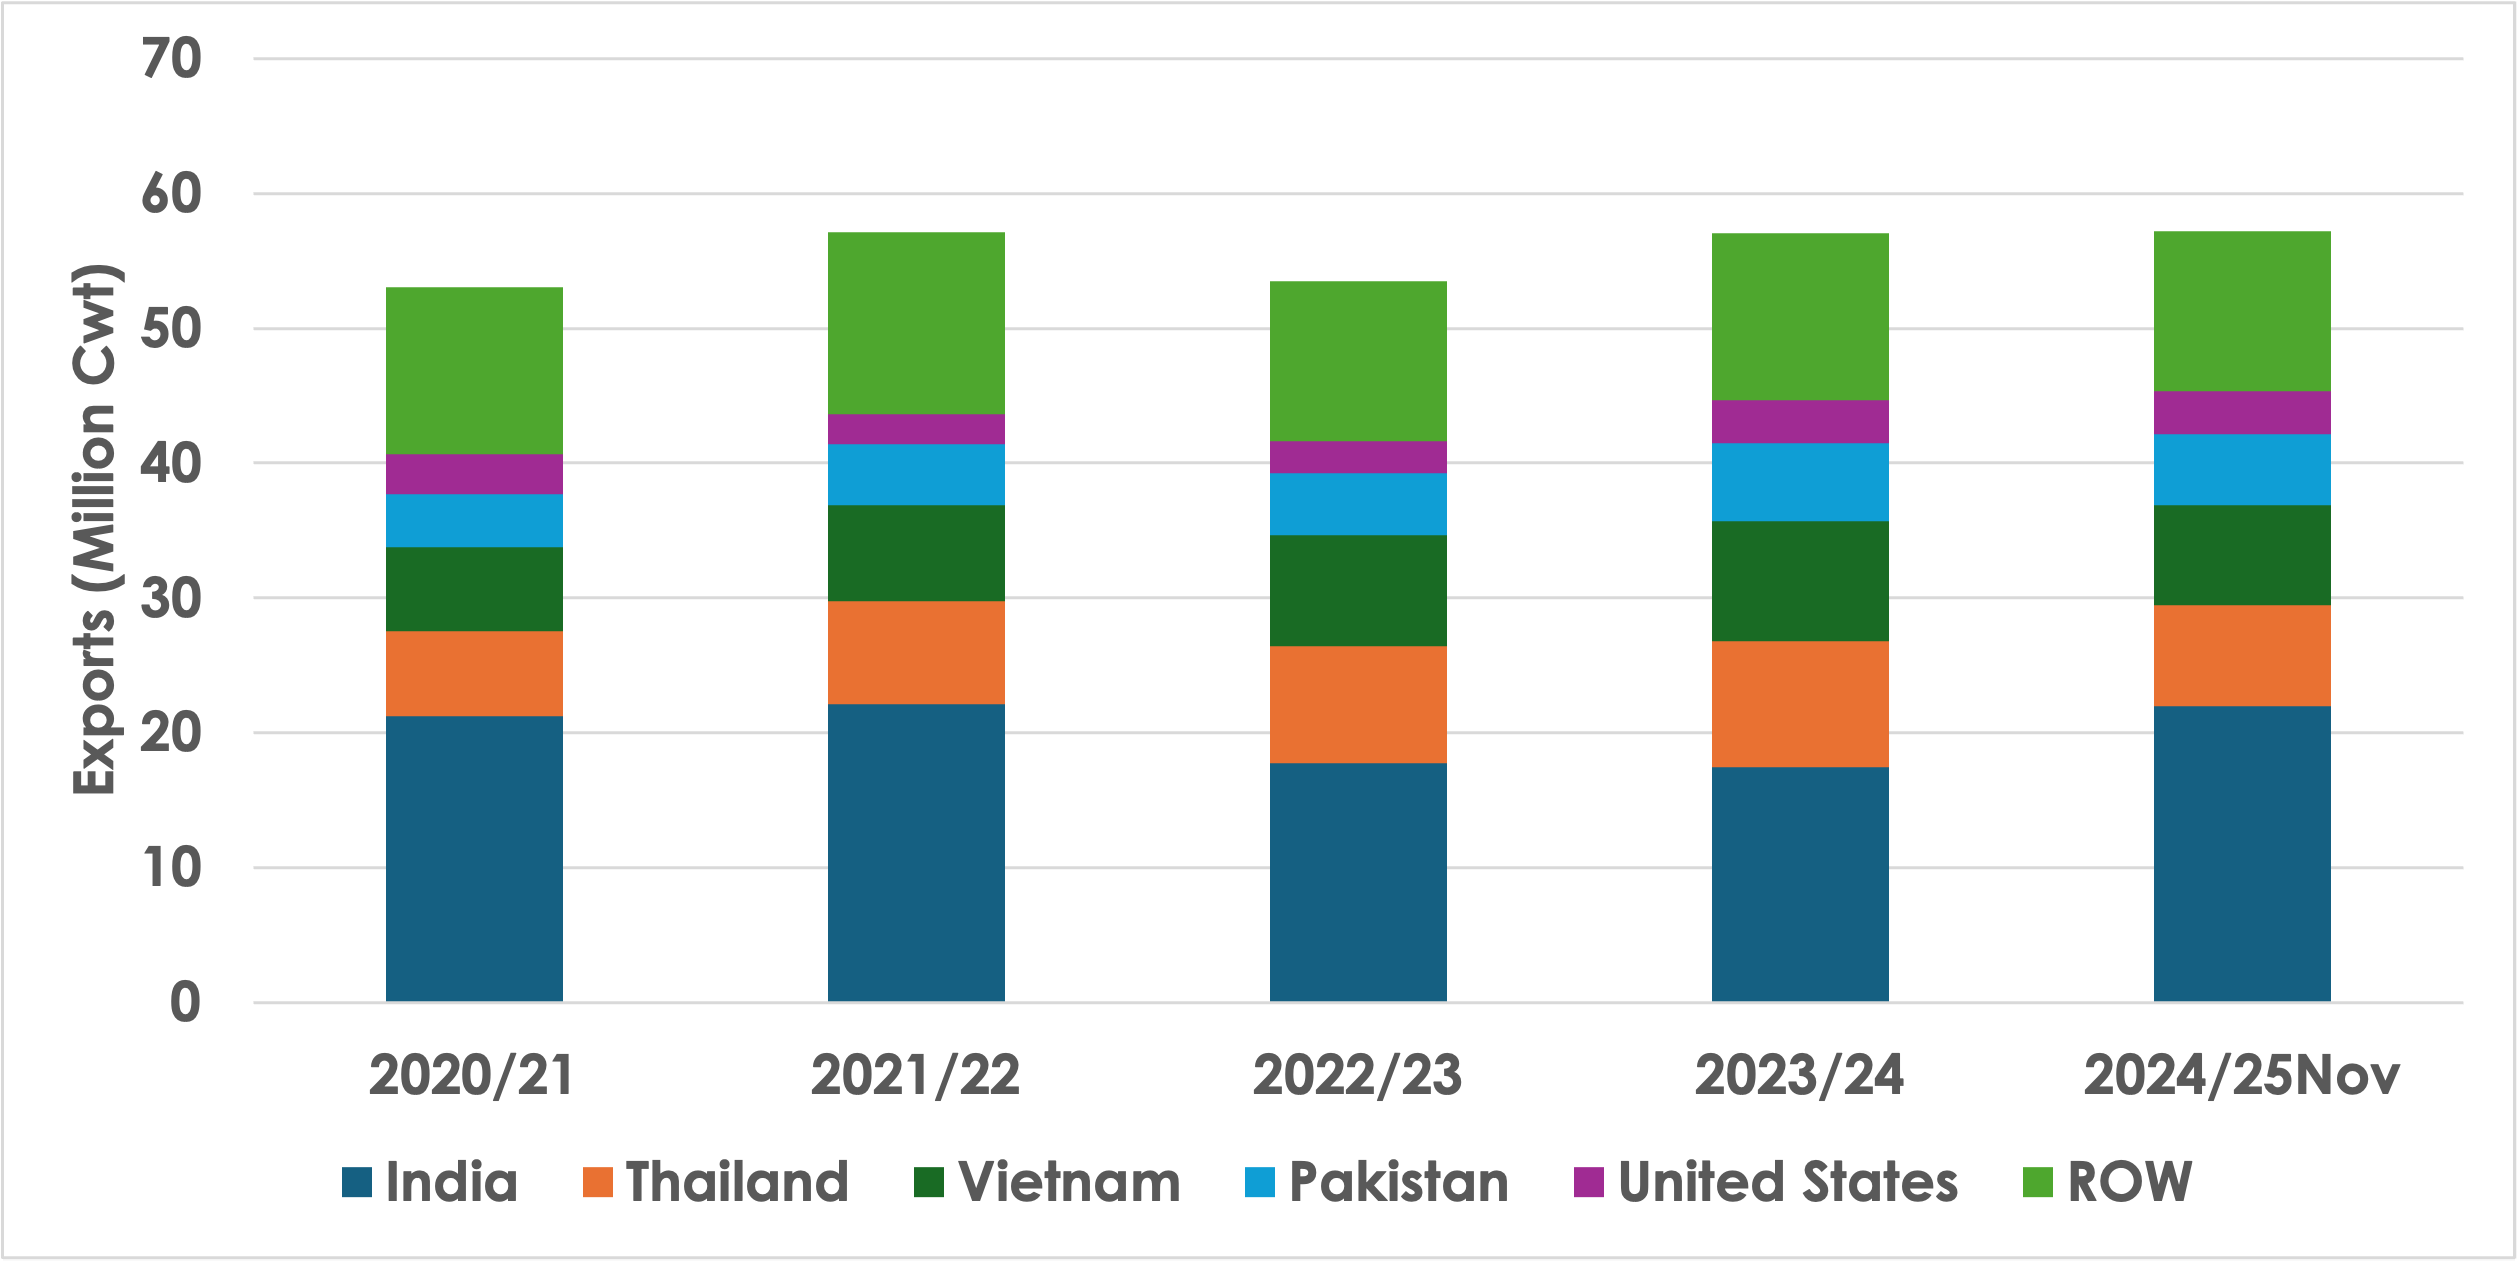
2) Trade/retaliatory tariffs are a concern and provide the potential for substantial downside price risk in commodities that are heavily reliant on export sales, like soybeans and cotton. Protecting against downside price movements should be considered.
3) Producers need to distinguish between cash versus non-cash costs (capital recovery) in the short term. We can farm in the short-term covering cash costs, but in the long term we need to cover total economic costs.
4) Input costs and profit margins need to be managed effectively – do not cut costs at the expense of yield but do not pursue the highest yield possible. Approximately 90% of cash costs are in five cost categories: land, seed, chemical, fertilizer, and operating expenses for equipment (fuel, labor, repairs and maintenance). Farmers should evaluate the efficiency of these five costs to assist in managing profit margins.
5) Secure financing early. It will be a challenging year for many farmers to secure operating credit for 2025. Obtaining financing needs to occur as early as possible. Understand your financial position and how lenders evaluate credit applications. There are five main factors lenders consider: repayment, liquidity, solvency, collateral, and relationship. Which factors lenders emphasize, and the ratio or measure to evaluate the factor, will depend on the agricultural lender or credit provider. Talk to your primary lender early and often.
6) Develop a marketing and risk management plan that includes crop insurance, storage analysis, contracts, futures, and options. Do not use the same marketing and risk management strategy in the current market environment as when we had higher prices and higher volatility two years ago.
7) There is the potential for payments from the federal government (FARM Act? or other Ad Hoc legislation) and a new Farm Bill is possible in 2025. Until they are realized, it is not advised to incorporate these potential payments into the 2025 financial plan. If realized, they are a bonus.
Due to the above challenges and the complexity of modern farming, it is essential for farmers to surround themselves with a strong support network. Important roles in farmer support networks include:
Lawyer – Having appropriate legal advice is essential for agricultural enterprises. This can include a local lawyer for general legal matters but may also include specialized legal advice for more complex legal concerns. Paying for specialization is often cheaper in the long run.
Accountant – Nobody likes paying taxes, but it is essential for farmers to obtain assistance when preparing tax returns, planning purchases, or transitioning the farm to the next generation. A good accountant can save you money and assist if you have issues with the IRS.
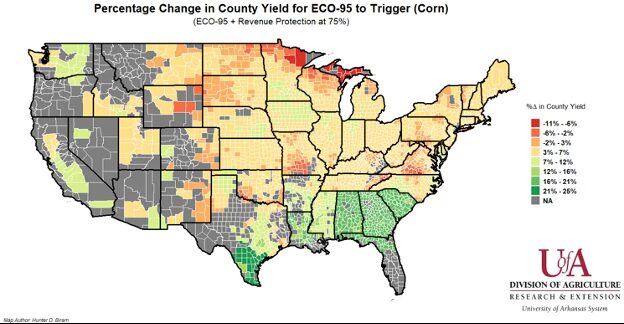
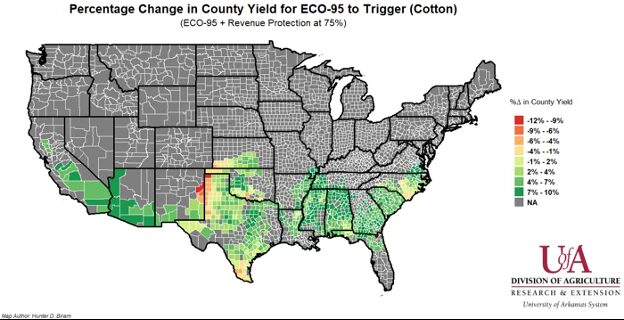
Crop Insurance Agent – Crop insurance is the primary risk management tool for most crop producers. Crop insurance can be complicated to navigate and requires individual, policy-specific analysis to ensure you are receiving the most effective coverage for the premium paid.
Agricultural Lender – Agriculture is a capital-intensive business. Adequate and consistent access to operating and term debt is essential for most farmers. Having a primary agricultural lender that understands your operation and that will stick with you through agricultural cycles is imperative. This is not to say that all credit will be obtained through one lender. Farmers need to make sure that the cost of credit is fully analyzed and that decisions make financial sense.
Broker / Marketer / Grain Merchandiser – Marketing is not a strength for most farmers. However, in times of low prices and tight margins, marketing can be the difference between profit and loss. Obtaining expertise or a second opinion can be a tremendous benefit.
Crop Consultant / Agronomist – Every production year is different and will require problem solving so a crop can be produced and sold. Yield is important; however, in periods of low prices and elevated input costs, it is essential that each input pulls its own weight economically. The cost of the input must be fully covered by financial benefits. A good agronomist can help navigate the agronomic challenges of the production season.
Extension Agent / Specialist – Extension provides a network to problem solve and connect producers with expertise to address problems and verify information independent of a financial motive. Searching the internet can be a powerful tool to assist in decision making. However, the internet has carpet bombed the information landscape with unreliable advice, opinions, and conspiracies, so be wary of information sources.
Smith, Aaron. “2025 Crop Planning.” Southern Ag Today 4(51.3). December 18, 2024. Permalink